Atmospheric composition of West Africa: highlights from the AMMA international program
←
→
Page content transcription
If your browser does not render page correctly, please read the page content below
ATMOSPHERIC SCIENCE LETTERS
Atmos. Sci. Let. 12: 13–18 (2011)
Published online 16 August 2010 in Wiley Online Library
(wileyonlinelibrary.com) DOI: 10.1002/asl.289
Atmospheric composition of West Africa: highlights from
the AMMA international program
Céline H. Mari,1 * Claire E. Reeves,2 Katherine S. Law,3 Gérard Ancellet,3 Maria Dolores Andrés-Hernández,4
Brice Barret,1 Joëlle Bechara,15 Agnès Borbon,15 Idir Bouarar,3 Francesco Cairo,5 Roisin Commane,11
Claire Delon,1 Matthew J. Evans,12 Federico Fierli,5 Cédric Floquet,11 Corinne Galy-Lacaux,1 Dwayne E. Heard,11
Carine D. Homan,6 Trevor Ingham,11 Niels Larsen,13 Alastair C. Lewis,7 Catherine Liousse,1 Jennifer G. Murphy,8
Emiliano Orlandi,5 David E. Oram,2 Marielle Saunois,1,9 Dominique Serça,1 David J. Stewart,14 Daniel Stone,11,12
Valérie Thouret,1 Peter van Velthoven10 and Jason E. Williams10
1 Laboratoire Aerologie, University of Toulouse, CNRS, Toulouse, France
2 School of the Environmental Sciences, University of East Anglia, Norwich, UK
3 UPMC, Université de Paris 06, Université Versailles St-Quentin, CNRS/INSU, LATMOS-IPSL, Paris, France
4 Institute of Environmental Physics, University of Bremen, Bremen, Germany
5 ISAC, Institute for Atmospheric Sciences and Climate, National Research Council, Italy
6 Department of Physics, University of Wuppertal, Germany
7 National Centre for Atmospheric Science, University of York, Heslington, York, UK
8 Department of Chemistry, University of Toronto, Ontario, Canada
9 National Center for Atmospheric Research, Boulder, Colorado, USA
10 Royal Netherlands Meteorological Institute, De Bilt, The Netherlands
11 School of Chemistry, University of Leeds, Leeds, UK
12 School of the Environment, University of Leeds, Leeds, UK
13 Danish Meteorological Institute, Danish Climate Center, Copenhagen, Denmark
14 Department of Chemistry, University of Reading, Reading, UK
15 Laboratoire Interuniversitaire des Systèmes Atmosphèriques, Universités de Paris 12 et Paris 7, CNRS, Créteil, France
*Correspondence to: Abstract
Céline H. Mari, Laboratoire
Aerologie, Universite de Toulouse, The atmospheric composition of West Africa reflects the interaction of various dynamical
CNRS, 31400 Toulouse, France. and chemical systems (i.e. biogenic, urban, convective and long-range transport) with
E-mail: signatures from local to continental scales. Recent measurements performed during the
celine.mari@aero.obs-mip.fr African Monsoon Multidisciplinary Analyses (AMMA) observational periods in 2005 and
2006 provide new data which has allowed new insight into the processes within these systems
that control the distribution of ozone and its precursors. Using these new data and recently
published results, we provide an overview of these systems with a particular emphasis
on ozone distributions over West Africa during the wet season. Copyright 2010 Royal
Received: 11 February 2010 Meteorological Society
Revised: 22 June 2010
Keywords: West Africa; AMMA; atmospheric chemistry; convection; long-range trans-
Accepted: 16 July 2010
port; biogenic emission; biomass burning; urban pollution; ozone
1. Background the composition of the atmosphere through several
processes (i.e. rapid vertical transport of gases and
The West African subregion is an important provider aerosols to the upper troposphere (UT), heterogeneous
of ozone and aerosols, which are radiatively active processing, emissions of NOx by lightning and alter-
components in the climate system. Prior to the African ation of the land surface wetness affecting the liber-
Monsoon Multidisciplinary Analyses (AMMA) pro- ation of NOx from soils). Combustion of fuelwood
gram, our knowledge about the distribution of O3 and for domestic energy is a continual source of air pollu-
its precursors over West Africa was limited. Mea- tion primarily in urban areas. Vegetated regions emit
surements performed during the AMMA observational large amounts of biogenic organic compounds which
periods in 2005 and 2006 revealed a variety of new influence the production of ozone. During the AMMA
dynamical and chemical mechanisms that control the program, an experimental strategy was set up to quan-
distribution of ozone and its precursors in this subre- tify these processes and to understand their impact at
gion. Details of the field campaigns are available in the global scale.
Lebel et al. (2010).
During the dry season (boreal winter), West Africa 2. Tropical biogenically dominated
is marked by strong emissions of pollutants from environments
biomass burning. During the wet season (typically
from May to September), the region is influenced by In the lower troposphere over West Africa during the
mesoscale convective systems (MCSs), which impact wet season, the ozone distribution shows a significant
Copyright 2010 Royal Meteorological Society
14 C. H. Mari et al.
south–north gradient with lower values over forested following the passage of precipitating MCSs (Stew-
regions and higher values north of 12◦ N (Adon et al., art et al., 2008) were interpreted as being due to the
2010; Reeves et al., 2010) (Figure 1). From dense release of NOx from soils. A mesoscale model study
rain forest in the coastal belt to the sub-Sahelian in which NOx emissions from soils were defined by an
savanna in the north, there are 72 million hectares of algorithm driven by various environmental parameters
forest in West Africa. Dry deposition loss of ozone to (e.g. soil moisture and pH) supported these conclu-
vegetation is the main driver of the ozone minimum sions (Delon et al., 2008). As part of the IDAF net-
over the forested areas, but factors relating to the work, long-term measurements over diverse African
biogenic emissions also affect the observed ozone ecosystems confirmed that, in the wet season, concen-
latitudinal profile (Saunois et al., 2009). trations of nitrogen components were highest over the
Vegetated regions, south of 10◦ N, emit large dry savannas (Adon et al., 2010) and that the nitro-
amounts of biogenic volatile organic compounds gen cycle of the whole Sahelian region is impacted by
(VOCs) (Ferreira et al., 2010; Murphy et al., 2010) these strong NOx emissions together with the ammo-
(Figure 1). Emissions from vegetation are dependent nia source from animals (Galy-Lacaux et al., 2009).
both on environmental conditions and plant type; high Saunois et al. (2009) showed that the soil NOx emis-
emission rates of isoprene were observed for West sions combined with northward advection of biogenic
African native plants, while a non-native plant orig- VOCs play a key role in producing enhanced ozone
inating from South America was found to be more concentrations over the dry savanna regions, with pro-
important for monoterpenes (Saxton et al., 2007). Air- duction rates of up to about 7 ppbv/day.
craft measurements of OH and HO2 radicals (Com- This large-scale impact of biogenic emissions was
mane et al., 2010) indicate that the maximum con- also verified by Williams et al. (2009) who found that
biogenic VOCs released from Africa are estimated
centrations of both species occur over the forested
to contribute 2–4% of the global burden of VOC
region. HO2 is controlled by relatively simple pho-
and that 2–45% of tropospheric O3 over equatorial
tochemical processes (Stone et al., 2010). In con-
Africa may come from African soil NOx emissions.
trast, the high reactivity of the short-lived biogenic
Further, these emissions also contribute to enhanced
VOCs leads to model underestimates of OH, simi-
ozone production over the tropical Atlantic downwind
lar to that found in other low NOx regions of the of West Africa (Williams et al., 2009).
world impacted by biogenic VOCs (Saunois et al.,
2009). Conversely, longer-lived and secondary organ-
ics can be oxidized north of the forested area where 3. Urban environments and air quality
they are transported and/or produced and contribute
to the ozone maximum there (Saunois et al., 2009) Air pollution, particularly in urban centres, is an
(Figure 1). emerging issue for human health in many West African
Enhanced concentrations of NOx and O3 observed countries. Increasing levels of toxic pollutants are a
in the boundary layer over semiarid Sahelian regions result of industrial emissions and vehicle exhausts as
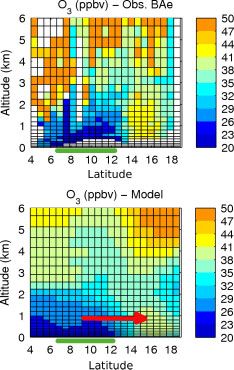
Figure 1. (Left) Observed isoprene-mixing ratio (in pptv) along the BAe-146 aircraft tracks below 700 m (refer Murphy et al., 2010
for details on aircraft measurements). (Right) Latitude–altitude distribution of ozone simulated by a mesoscale model (bottom) and
observed by the BAe-146 aircraft (top) in August 2006. The green bar marks the latitudinal extension of the vegetated area. The
red arrow indicates the advection to northern latitudes by the nocturnal boundary layer jet (adapted from Saunois et al., 2009).
Copyright 2010 Royal Meteorological Society Atmos. Sci. Let. 12: 13–18 (2011)Atmospheric composition of West Africa 15
well as the burning of coal, wood or other fuels to meet southern Germany (Höller et al., 2009). Despite this,
domestic energy requirements. Exceptionally high O3 NO concentrations were found to be enhanced in the
concentrations (up to 284 ppbv at 1 km altitude) UT (Figure 3).
observed during the dry season by the ozone sound- Moreover, Andrés-Hernández et al. (2009), on occa-
ing network in Cotonou, Benin, have been linked to sions, found peroxy radical concentrations in the out-
an unusual combination of sources including biomass flow of convective clouds to be coupled with NO
burning, urban pollution and the petrochemical indus- indicating that either NOx and a radical precursor (e.g.
try (Minga et al., 2010). Hopkins et al. (2009) reported formaldehyde, acetone or peroxides) have been simul-
top–down emissions estimate for the Lagos megac- taneously lifted from lower altitudes or that fresh NO
ity in Nigeria based on aircraft measurements. Annual emissions have occurred within uplifted air laden with
emission fluxes for NOx were found to be comparable a radical precursor. Significant O3 production rates
with previous bottom–up estimates for other develop- of around 1 ppb/h were calculated for these MCS
ing megacities, whereas VOC and CO emissions per outflows. At the cloud scale, MCSs have contrast-
capita were among the highest ever reported. Inter- ing signatures with high O3 production observed for
estingly, measured O3 levels were not significantly MCSs which had existed for more than 1.5 days as
elevated in this case, possibly due to titration in pol- this allows more peroxide formation, and for those
luted conditions. MCS which originated south of 10◦ N where more CO
is available for transport to the UT (Ancellet et al.,
2009).
4. Convective environments The NOx in the UT induces a quasi-persistent large-
scale O3 latitudinal gradient with an O3 minimum
MOZAIC commercial aircraft data over the West in the intertropical convergence zone and lightning
African continent had previously shown that convec- NOx-related O3 maxima in the southern and the north-
tion uplifts O3 -poor air into the UT and contributes ern Hadley cells (Sauvage et al., 2007; Saunois et al.,
to an observed O3 minimum at 12–14 km (Sauvage 2008). However, based on a multi-model study, Bar-
et al., 2007; Saunois et al., 2008). This was further ret et al. (2010) demonstrated that global model sim-
confirmed during the AMMA by ozonesondes (Cairo ulations of lightning NOx (magnitude, altitude and
et al., 2010; Thouret et al., 2009) (Figure 2) and air- geographical position) (Figure 3) are very sensitive
craft observations (Ancellet et al., 2009). to the convection scheme employed, in particular the
Using aircraft measurements, Bechara et al. (2009) detrainment flux levels and intensity. Interestingly,
observed up to three times higher concentrations none of the models simulate a NOx maximum over
of VOCs in the UT during convective conditions Central Africa as might be expected given the max-
compared to non-convective conditions and model imum in lightning imaging sensor (LIS) flash fre-
studies suggest that the UT is frequently perturbed quencies over this region. Simulated O3 enhance-
by MCSs up to an altitude of about 14 km (Law ments induced by the lightning NOx source are the
et al., 2010). In addition, the MCS can produce NOx highest over the northern tropical Atlantic and West
from lightning, but NOx production per standard Africa.
stroke over West Africa was found to be 40% lesser
than the thunderstorms over northern Australia and
5. Long-range transport
Surprisingly, the AMMA revealed a persistent influ-
ence of fires from the Southern Hemisphere in the
mid and lower troposphere of West Africa during the
wet season. Import of biomass burning emissions from
Central Africa (Liousse et al., 2010) over the south-
ern part of the region was originally proposed by
Sauvage et al. (2005) based on MOZAIC data. These
incidences of biomass burning import were found
to be driven by the Southern Hemisphere African
easterly jet activity (Mari et al., 2008) (Figure 4). Sig-
natures of such transport were observed by ozone
soundings made in Cotonou, Benin and co-located
aircraft measurements with O3 concentrations up to
120 ppbv in the lower troposphere (Thouret et al.,
2009) (Figure 4). Significant O3 production rates (7
Figure 2. Vertical ozone-mixing ratio profiles from 17 ozone ppbv/day) have been estimated in middle tropospheric
soundings in Niamey (Niger) between 27 July and 25 August biomass burning plumes transported downwind over
2006 (courtesy N. Larsen, adapted from Cairo et al., 2009). the Atlantic Ocean (Real et al., 2010). Global model
Copyright 2010 Royal Meteorological Society Atmos. Sci. Let. 12: 13–18 (2011)16 C. H. Mari et al.
Figure 3. Vertical profiles of NO-mixing ratios observed during the AMMA Special Observational Period in August 2006 by the
DLR Falcon 20 (red) and simulated by four chemistry transport models: MOCAGE, LMDz-INCA, TM4 and TOMCAT for (Left)
observations that have been impacted by MCSs in the previous 3–4 days and (right) observations with no recent MCSs impact
(courtesy I. Bouarar; adapted from Barret et al., 2010).
6
5
4
Altitude (km)
3
2
mean RS (10/08 + 14/08) Cotonou
1 mean BAe (08/08 + 13/08) 5.5N7N
DF20 13/08 4N5.5N
mean RS Aug. 2006 + sigma
0
0 20 40 60 80 100 120 140
Ozone (ppbv)
Figure 4. (Left) Vertical profiles of ozone up to 7 km from the ozone-sounding dataset: August monthly mean and standard
deviation (grey), average of the two soundings on 10 and 14/08 (black); from BAe-146 in the region between 5.5 ◦ N and 7◦ N on
the 08 and 13/08 (red); and from D-F20 in the region 4–5.5 ◦ N on the 13/08 (blue) (adapted from Thouret et al., 2009). (Right)
Simulated tracer concentration at 650 hPa on August 15 1200 UTC, originating from the Southern Hemispheric biomass burning
emissions during an active phase of the southern African easterly jet (courtesy East Orlandi, adapted from Real et al., 2010).
simulations of the transport of biomass burning emis- convectively lifted over West Africa. Barret et al.
sions show that often transport from Central Africa (2008) showed a clear influence of CO-rich air uplifted
occurs in the lower troposphere rather than the mid- from Asia (Figure 5). Uplift of clean air over the
troposphere when using the ECMWF meteorological Indian Ocean as well as transport of air from the
analysis (Williams et al., 2010). lower stratosphere around the Tibetan High also affect
Central African biomass burning emissions can trace gas concentrations in the TTL (Law et al., 2010).
also be injected periodically into the UT via deep Interestingly, the TTL also has enhanced levels of
convection over Central Africa and easterly trans- non-volatile particles, although the reasons are yet
ported in the lower Tropical tropopause layer (TTL) unknown (Borrmann et al., 2009).
by the Tropical easterly jet (TEJ) (Mari et al.,
2008). Slow, but significant, ozone production (1–2
ppbv/day) has been estimated during downwind trans-
port of these air masses around 200 hPa (Real et al., 6. Challenges for the future
2010).
Much of the air in the TTL has been advected Measurements performed during the AMMA observa-
from the east in the TEJ rather than having been tional periods in 2005 and 2006 gave a first view of
Copyright 2010 Royal Meteorological Society Atmos. Sci. Let. 12: 13–18 (2011)Atmospheric composition of West Africa 17
Figure 5. CO fields, in ppbv, assimilated in the MOCAGE global model, averaged over the period 5–31 July 2006 at 140 hPa
(top) and 205 hPa (bottom). Horizontal winds from the ECMWF operational analyses are superimposed as black arrows. White
contours at 205 hPa indicate deep convection (OLR contours at 220 W/m2 ) (adapted from Barret et al., 2008).
the atmospheric composition over West Africa. Sev- References
eral questions remain on the contributions of differ-
ent components of the vegetation to natural emissions Adon M, Galy-Lacaux C, Yoboue V, Delon C, Lacaux JP, Castera P,
of chemical species and how they change with sea- Gardrat E, Pienaar J, Al Ourabi H, Laouali D, Diop B, Sigha-
Nkamdjou L, Akpo A, Tathy JP, Lavenu F, Mougin E. 2010. Long
son and rainfall. How will deforestation and deserti- term measurements of sulfur dioxide, nitrogen dioxide, ammonia,
fication, in a changing climate, modify the chemical nitric acid and ozone in Africa using passive samplers. Atmospheric
emissions? Rapid urbanization and concentration of Chemistry and Physics Discussion 10: 4407–4461.
economic activities in Western Africa’s urban centres Ancellet G, Leclair de Bellevue J, Mari C, Nedelec P, Kukui A,
Borbon A, Perros P. 2009. Effects of regional-scale and convective
is an emerging issue for the West African popula-
transports on tropospheric ozone chemistry revealed by aircraft
tion. The impact of emissions from industry, motor observations during the wet season of the AMMA campaign.
vehicles and households on air quality is a major con- Atmospheric Chemistry and Physics 9: 383–411.
cern. In situ observations in several cities of West Andrés-Hernández MD, Kartal D, Reichert L, Burrows JP, Meyer
Africa (Dakar, Ouagadougou, Bamako and Lagos) Arnek J, Lichtenstern M, Stock P, Schlager H. 2009. Peroxy radical
observations over West Africa during AMMA 2006: photochemical
have revealed concentrations of pollutants (black car- activity in the outflow of convective systems. Atmospheric Chemistry
bon aerosols and NO2 ) comparable to those observed and Physics 9: 3681–3695.
in Asian megacities (Liousse and Galy-Lacaux, 2010). Barret B, Ricaud P, Mari C, Attié J-L, Bousserez N, Josse B, Le
Current emission inventories estimate only a small Flochmoën E, Livesey NJ, Massart S, Peuch V-H, Piacentini A,
contribution of anthropogenic emissions from West Sauvage B, Thouret V, Cammas J-P. 2008. Transport pathways of
CO in the African upper troposphere during the monsoon season:
Africa, but, based on first evaluations against in situ a study based upon the assimilation of spaceborne observations.
data, these may be underestimated. The question thus Atmospheric Chemistry and Physics 8: 3231–3246.
remains concerning the evolution of these emissions Barret B, Williams JE, Bouarar I, Yang X, Josse B, Law K, Le
especially since Africa is the continent with the high- Flochmoën E, Liousse C, Peuch V-H, Carver G, Pyle J, Sauvage B,
est projected increase in the population in the next few vanVelthoven P, Mari C, Cammas J-P. 2010. Impact of West
African Monsoon convective transport and lightning NOx production
decades. upon the tropical upper tropospheric composition: a multi-
model study. Atmospheric Chemistry and Physics Discussion 10:
2245–2302.
Acknowlegdements Bechara J, Borbon A, Jambert C, Colomb A, Perros PE. 2009.
Evidence of the impact of deep convection on reactive volatile
The support of the AMMA project is gratefully acknowledged organic compounds in the upper tropical troposphere during the
(see http://onlinelibrary.wiley.com/doi/10.1002/asl.331/full for AMMA experiment in West Africa. Atmospheric Chemistry and
full acknowledgement). Physics Discussion 9: 20309–20346.
Copyright 2010 Royal Meteorological Society Atmos. Sci. Let. 12: 13–18 (2011)18 C. H. Mari et al.
Borrmann S, Kunkel D, Weigel R, Minikin A, Deschler T, Wilson JC, concentrations over Cotonou in December 2005? Atmospheric
Curtius J, Shur GN, Belyaev GV, Law KS, Cairo F. 2009. Aerosols Chemistry and Physics 10: 895–907.
in the tropical and sub-tropical UT/LS: in-situ measurements of sub- Murphy JM, Oram DE, Reeves CE. 2010. Measurements of volatile
micron particle abudance and volatility. Atmospheric Chemistry and organic compounds over West Africa. Atmospheric Chemistry and
Physics Discussion 9: 24587–24628. Physics Discussion 10: 3861–3892.
Cairo F, Pommereau JP, Law KS, Schlager H, Garnier A, Fierli F, Real E, Orlandi E, Law KS, Fierli F, Josset D, Cairo F, Schlager H,
Ern M, Streibel M, Arabas S, Borrmann S, Berthelier JJ, Blom Borrmann S, Kunkel D, Volk M, McQuaid JB, Stewart DJ, Lee J,
C, Christensen T, D’Amato F, Di Donfrancesco G, Deshler T, Lewis A, Hopkins JR, Ravegnani F, Ulanovski A, Liousse C.
Diedhiou A, Durry G, Engelsen O, Goutail F, Harris NRP, Kerstel 2010. Cross-hemispheric transport of central African biomass
ERT, Khaykin S, Konopka P, Kylling A, Larsen N, Lebel T, Liu burning pollutants: implications for downwind ozone production.
X, MacKenzie AR, Nielsen J, Oulanowski A, Parker DJ, Pelon Atmospheric Chemistry and Physics 10: 3027–3046.
J, Polcher J, Pyle JA, Ravegnani F, Rivière ED, Robinson AD, Reeves CE, Formenti P, Afif C, Ancellet G, Attie J-L, Bechara J,
Röckmann T, Schiller C, Simões F, Stefanutti L, Stroh F, Some L, Borbon A, Cairo F, Coe H, Crumeyrolle S, Fielri F, Flamant C,
Siegmund P, Sitnikov N, Vernier JP, Volk CM, Voigt C, von Hobe M, Gomes L, Hamburger T, Jambert C, Law KS, Mari C, Mat-
Viciani S, Yushkov V. 2010. An introduction to the SCOUT-AMMA suki A, Methven J, Mills GP, Minikin A, Murphy JG, Nielsen JK,
stratospheric aircraft, balloons and sondes campaign in West Africa, Oram DE, Parker DJ, Richter A, Schlager H. 2010. Chemical and
August 2006: rationale and roadmap. Atmospheric Chemistry and aerosol characterisation of the troposphere over West Africa during
Physics 10: 2237–2256. the monsoon period as part of AMMA. Atmospheric Chemistry and
Commane R, Floquet C, Ingham T, Stone D, Evans MJ, Heard DE. Physics Discussion 10: 7115–7183.
2010. Observation of OH and HO2 radicals over West Africa. Saunois M, Mari C, Thouret V, Cammas JP, Peyrille P, Lafore JP,
Atmospheric Chemistry and Physics Discussion 10: 7265–7322. Sauvage B, Volz-Thomas A, Nedelec P, Pinty JP. 2008. An
Delon C, Reeves CE, Stewart DJ, Serça D, Dupont R, Mari C, idealized two-dimensional approach to study the impact of
Chaboureau J-P, Tulet P. 2008. Biogenic nitrogen oxide emissions the West African monsoon on the meridional gradient of
from soils – impact on NOx and ozone over West Africa during tropospheric ozone. Journal of Geophysical Research 113: D07306,
AMMA: modelling study. Atmospheric Chemistry and Physics 8: DOI:10.1029/2007JD008707.
2351–2363. Saunois M, Reeves CE, Mari C, Murphy JG, Stewart DJ, Mills GP,
Ferreira J, Reeves CE, Murphy JG, Garcia-Carreras L, Parker DJ, Oram DE, Purvis RM. 2009. Ozone budget in the West
Oram DE. 2010. Isoprene emissions modelling for West Africa African lower troposphere during the AMMA (African Monsoon
using MEGAN. Atmospheric Chemistry and Physics Discussion 10: Multidisciplinary Analysis) campaign. Atmospheric Chemistry and
6923–6953. Physics 9: 6979–7032.
Galy-Lacaux C, Laouali D, Descroix L, Gobron N, Liousse C. 2009. Sauvage B, Thouret V, Cammas J-P, Gheusi F, Athier G, Nédélec P.
Long term precipitation chemistry and wet deposition in a remote dry 2005. Tropospheric ozone over Equatorial Africa: regional aspects
savanna site in Africa (Niger). Atmospheric Chemistry and Physics from the MOZAIC data. Atmospheric Chemistry and Physics 5:
9: 1579–1595. 311–335.
Höller H, Betz H-D, Schmidt K, Calheiros RV, May P, Houngni- Sauvage B, Thouret V, Cammas JP, Brioude J, Nedelec P, Mari C.
nou E, Scialom G. 2009. Lightning characteristics observed by 2007. Meridional ozone gradients in the African upper tro-
a VLF/LF lightning detection network (LINET) in Brazil, Aus- posphere. Geophysical Research Letters 34: Art. No. L03817,
tralia, Africa and Germany. Atmospheric Chemistry and Physics 9: DOI:10.1029/2006GL028542.
7795–7824. Saxton JE, Lewis AC, Kettlewell JH, Ozel MZ, Gogus F, Boni Y,
Korogone US, Serça D. 2007. Isoprene and monoterpene emissions
Hopkins JR, Evans MJ, Lee JD, Lewis AC, Marsham JH, McQuaid
from secondary forest in northern Benin. Atmospheric Chemistry and
JB, Parker DJ, Stewart DJ, Reeves CE, Purvis RM. 2009. Direct
Physics 7: 4095–4106.
estimates of emissions from the megacity of Lagos. Atmospheric
Stewart DJ, Taylor CM, Reeves CE, McQuaid JB. 2008. Biogenic
Chemistry and Physics 9: 8471–8477.
nitrogen oxide emissions from soils: impact on NOx and ozone over
Law KS, Cairo F, Fierli F, Palazzi E, Borrmann S, Schlager H,
west Africa during AMMA (African Monsoon Multidisciplinary
Streibel M, Viciani S, Ravegnani F, Volk M, Schiller C et al. 2010.
Analysis): observational study. Atmospheric Chemistry and Physics
Air mass origins influencing TTL chemical composition over West
8: 2285–2297.
Africa during 2006 summer monsoon. Atmospheric Chemistry and
Stone D, Evans MJ, Commane R, Ingham T, Floquet C, McQuaid
Physics Discussion 10: 15485–15536.
JB, Brookes DM, Monks PS, Purvis R, Hamilton J, Hopkins J, Lee
Lebel T, Parker DJ, Flamant C, Bourles B, Marticorena B, Mougin E, J, Lewis AC, Stewart D, Murphy J, Mills G, Oram D, Bandy BJ.
Peugeot C, Diedhiou A, Haywood JM, Ngamini JB, Polcher J, 2010. HOx observations over West Africa during AMMA: impact of
Redelsperger JL, Thorncroft CD. 2010. Quarterly Journal of the isoprene and NOx. Atmospheric Chemistry and Physics Discussion
Royal Meteorological Society 136: 8–33. 10: 17029–17072.
Liousse C, Galy-Lacaux C. 2010. Urban pollution in West Africa. Thouret V, Saunois M, Minga A, Mariscal A, Sauvage B, Solete A,
IGBP Newsletter in press. Agbangla D, Nédélec P, Mari C, Reeves CE, Schlager H. 2009. An
Liousse C, Guillaume B, Grégoire JM, Mallet M, Galy C, Poirson A, overview of two years of ozone radiosoundings over Cotonou as
Solmon F, Pont V, Mariscal A, Dungal L, Rosset R, Yoboué V, part of AMMA. Atmospheric Chemistry and Physics 9: 6157–6174.
Bedou X, Serça D, Konaré A, Granier C, Mieville A. 2010. African Williams JE, Scheele MP, van Velthoven PFJ, Cammas J-P, Thouret
aerosols modeling during the EOP-AMMA campaign with updated V, Galy-Lacaux C, Volz-Thomas A. 2009. The influence of biogenic
biomass burning emission inventories. Atmospheric Chemistry and emissions from Africa on tropical tropospheric ozone during 2006:
Physics Discussion 10: 7347–7382. a global modeling study. Atmospheric Chemistry and Physics 9:
Mari CH, Cailley G, Corre L, Saunois M, Attié JL, Thouret V, 5729–5749.
Stohl A. 2008. Tracing biomass burning plumes from the Southern Williams JE, Scheele MP, van Velthoven PFJ, Thouret V, Saunois M,
Hemisphere during the AMMA 2006 wet season experiment. Reeves CE, Cammas J-P. 2010. The influence of biomass burning
Atmospheric Chemistry and Physics 8: 3951–3961. on tropospheric composition over the tropical Atlantic Ocean and
Minga A, Thouret V, Saunois M, Delon C, Serça D, Sauvage B, equatorial Africa during the West African Monsoon. Atmospheric
Mariscal A, Leriche M, Cros B. 2010. What caused extreme ozone Chemistry and Physics Discussion 10: 7507–7552.
Copyright 2010 Royal Meteorological Society Atmos. Sci. Let. 12: 13–18 (2011)You can also read