Standardized image interpretation and post-processing in cardiovascular magnetic resonance - 2020 update
←
→
Page content transcription
If your browser does not render page correctly, please read the page content below
Schulz-Menger et al. Journal of Cardiovascular Magnetic Resonance                  (2020) 22:19
https://doi.org/10.1186/s12968-020-00610-6

 POSITION STATEMENT                                                                                                                             Open Access

Standardized image interpretation and
post-processing in cardiovascular magnetic
resonance - 2020 update
Society for Cardiovascular Magnetic Resonance (SCMR): Board
of Trustees Task Force on Standardized Post-Processing
Jeanette Schulz-Menger1*, David A. Bluemke2, Jens Bremerich3, Scott D. Flamm4, Mark A. Fogel5,
Matthias G. Friedrich6, Raymond J. Kim7, Florian von Knobelsdorff-Brenkenhoff8 , Christopher M. Kramer9,
Dudley J. Pennell10, Sven Plein11 and Eike Nagel12

  Abstract
  With mounting data on its accuracy and prognostic value, cardiovascular magnetic resonance (CMR) is becoming an
  increasingly important diagnostic tool with growing utility in clinical routine. Given its versatility and wide range of
  quantitative parameters, however, agreement on specific standards for the interpretation and post-processing of CMR
  studies is required to ensure consistent quality and reproducibility of CMR reports. This document addresses this need by
  providing consensus recommendations developed by the Task Force for Post-Processing of the Society for Cardiovascular
  Magnetic Resonance (SCMR). The aim of the Task Force is to recommend requirements and standards for image
  interpretation and post-processing enabling qualitative and quantitative evaluation of CMR images. Furthermore, pitfalls
  of CMR image analysis are discussed where appropriate. It is an update of the original recommendations published 2013.
  Keywords: Magnetic resonance imaging, Heart, Recommendations, Image interpretation, Post-processing

Preamble                                                                             consistent quality and reproducibility of CMR reports.
Cardiovascular magnetic resonance (CMR) has evolved                                  This document addresses this need by updating the 2013
into a gold standard non-invasive imaging tool in cardio-                            consensus recommendations developed by the Task Force
vascular medicine, especially for visualizing and quanti-                            for Post-Processing of the Society for Cardiovascular Mag-
fying cardiovascular anatomy, volumes, and function, as                              netic Resonance (SCMR) [1]. The aim of the document is
well as for myocardial tissue characterization. CMR has                              to recommend requirements and standards for image
unique capabilities in the diagnostic workup of sus-                                 interpretation and post-processing, enabling qualitative
pected cardiovascular disease. It continues to expand its                            and quantitative evaluation of CMR images. Furthermore,
utility in day-to-day clinical practice. Given its versatility                       pitfalls of CMR image analysis are discussed where appro-
and wide range of quantitative parameters, agreement                                 priate. The Task Force is aware that for some of the rec-
on specific standards for the image interpretation and                               ommendations the body of evidence is limited. Thus, this
post-processing of CMR studies is required to ensure                                 document represents an expert consensus providing guid-
                                                                                     ance based on the best available evidence at present as
* Correspondence: jeanette.schulz-menger@charite.de
                                                                                     endorsed by the SCMR. As CMR continues to develop,
1
 Department of Cardiology and Nephrology, Working Group on                           updated recommendations for image acquisition, inter-
Cardiovascular Magnetic Resonance, Experimental and Clinical Research                pretation and post-processing will be provided by online
Center, a joint cooperation between the Charité Medical Faculty and the
Max-Delbrueck Center for Molecular Medicine, and HELIOS Klinikum Berlin
                                                                                     appendices when needed and updated Task Force papers.
Buch, Schwanebecker Chaussee 50, 13125 Berlin, Germany
Full list of author information is available at the end of the article

                                       © The Author(s). 2020 Open Access This article is distributed under the terms of the Creative Commons Attribution 4.0
                                       International License (http://creativecommons.org/licenses/by/4.0/), which permits unrestricted use, distribution, and
                                       reproduction in any medium, provided you give appropriate credit to the original author(s) and the source, provide a link to
                                       the Creative Commons license, and indicate if changes were made. The Creative Commons Public Domain Dedication waiver
                                       (http://creativecommons.org/publicdomain/zero/1.0/) applies to the data made available in this article, unless otherwise stated.
Schulz-Menger et al. Journal of Cardiovascular Magnetic Resonance   (2020) 22:19                                     Page 2 of 22

   The recommendations are considered for the applica-                  2. Post-processing software with regulatory approval
tion of CMR in clinical routine in adult patients. For                     for use in patients, ideally providing the following
some applications, quantification is considered as                         tools:
providing added information but is not mandatory (e.g.,                    a) Full DICOM send/retrieve functionality,
perfusion), whereas for others quantification is required                      network connection with local Picture
for all clinical reports (e.g., T2* assessment in iron over-                   Archiving and Communication System (PACS)
load). In general, the intention of this Task Force is to                      or server solution with compliant patient
describe the scenarios in which quantitative analysis                          security properties
should be performed and how it is performed. Quantifi-                     b) View all short-axis cines as movies in a single
cation itself is a moving target as artificial intelligence                    display, zoom, pan and change contrast for
approaches to quantification are presently being insti-                        single images as well as image series
tuted within CMR analysis software programs and will                       c) Perform endocardial and epicardial contour
impact techniques in this arena in the future. The rec-                        tracings on cines
ommendations respect societal recommendations for                          d) Correct for atrioventricular annular location
structured reporting of cardiovascular imaging studies in                      from the long-axis slice onto the most basal left
general (ACCF / ACR / AHA / ASE / ASNC / HRS /                                 ventricular (LV) short-axis location in contour
NASCI / RSNA / SAIP / SCAI / SCCT / SCMR) [2] and                              tracings
specifically for CMR studies (SCMR) [3]. The recom-                        e) Cross-referencing of structures for confirmation
mendations do not supersede clinical judgment regard-                          of slice position and anatomy
ing the contents of individual interpretation of imaging                   f) Simultaneously view cine, late gadolinium
studies. The Task Force made every effort to avoid con-                        enhancement (LGE) and/or perfusion images
flicts of interest and, where present, to disclose potential                   from the same location
conflicts.                                                                 g) Simultaneously view short- and long-axis images
                                                                               of the same region
General recommendations                                                    h) Simultaneously view images of the approximate
The recommendations listed in this section apply to the                        same location on the current and prior study for
acquisition and post-processing of all CMR data. CMR                           serial studies
studies should be performed for recommended indications.                   i) Perform quantitative signal intensity (SI) and
Data acquisition and reporting should conform to the                           derived analyses
recommendations of SCMR [3, 4]. Consistent methods of                      j) Perform standardized segmentation of the
acquisition and measurements are essential for serial evalu-                   myocardium according to the segment model of
ation of changes over time. Standardized structured reports                    the American Heart Association (AHA) [5]
with tables of measurements are helpful for reporting                      k) Measure flow velocities and flow volumes
follow-up examinations. Any analysis should be performed                   l) Manually correct or enter heart rate, blood
using uncompressed or lossless compressed Digital Imaging                      pressure, height, weight, body surface area
and Communications in Medicine (DICOM) source im-                          m) Calculate volumes in stacked or 3D datasets
ages. Factors like type of sequence, spatial resolution, con-                  with minimal user interaction, including and
trast agent and kinetics may influence visual and                              excluding trabecular tissue and papillary
quantitative analysis and should be considered. Quantitative                   muscles from the LV volume [6]
values should only be provided based on adequate image                     n) Document important findings in screenshots for
quality. Since there are no objective criteria for inadequate                  the report
images, this determination needs to rely on the experience                 o) For evaluation of angiography the software
of the reporting physician. Readers should have adequate                       ideally provides the following tools:
training and clinical experience that includes normal data-                    i) 3D multiplanar and maximum intensity
sets to avoid over-interpretation of normal variants. The                           projection (MIP) capabilities
identity and responsibility of the reader should be appropri-                  ii) Volume rendering and surface shaded
ately documented in the report. Furthermore, the reader of                          reconstructions optional for reporting but
clinical data is also responsible for the use of adequate                           not mandatory for quantitative analysis
post-processing hardware and software. The general re-                         iii) Measurement of distances and areas in
quirements include:                                                                 3D-MR angiography (MRA) images
                                                                               iv) MIP reconstruction based on non-
  1. Workstation and screen of adequate specification                               subtracted or subtracted 3D-MRA
     and resolution (as per the specifications of the post-                         datasets
     processing software)                                                      v) Multiplanar reformatting (MPR)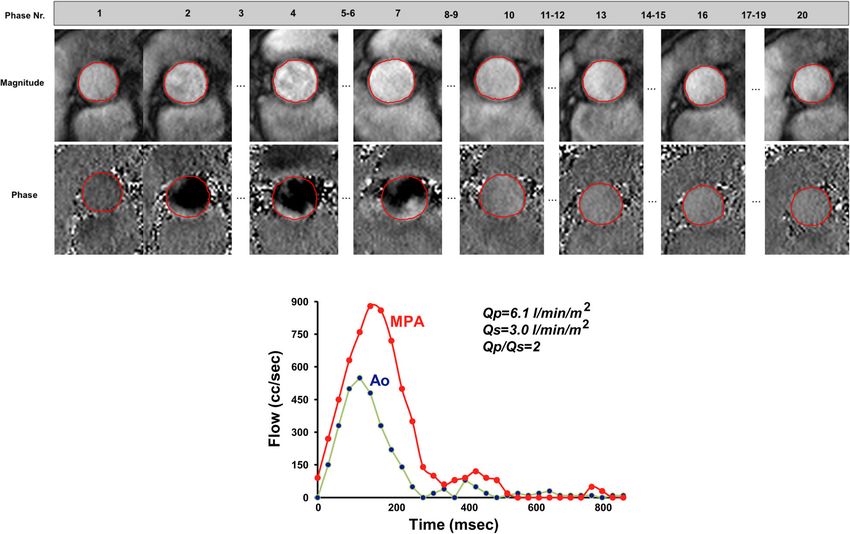
Schulz-Menger et al. Journal of Cardiovascular Magnetic Resonance             (2020) 22:19                                                      Page 3 of 22

Left ventricular chamber assessment                                             Quantitative analysis
Visual analysis
                                                                                   a) General recommendations
  a) Before analyzing the details, review all cines in cine                           i) In patients with severe arrhythmias, the end-
     mode, validate observations from one plane with                                       systolic volumes tend to be overestimated and
     the others, and check for artifacts, especially in                                    ejection fraction underestimated. In case of sig-
     patients with irregular heart rates.                                                  nificant artifacts this should be denoted in the
  b) Dynamic evaluation of global LV function:                                             report.
     Interpretation of both ventricular chambers, in                                  ii) Calculated parameters: LV end-diastolic volume,
     concert with extracardiac structures including                                        LV end-systolic volume, LV stroke volume, LV
     assessment for hemodynamic interaction between                                        ejection fraction, cardiac output, LV mass, and
     the two chambers (e.g., shunts, evidence of                                           body-surface area indexed values of all except
     constrictive physiology).                                                             ejection fraction. The parameters quantified
  c) Assessment of LV function from a global and                                           may vary depending on the clinical need.
     segmental perspective. Segmental wall motion is                                  iii) Evaluation of the stack of short axis images with
     based on segmental wall thickening during                                             computer-aided analysis packages.
     systole. Wall motion is categorized as:                                          iv) Contours of endocardial and epicardial borders
     hyperkinetic, normokinetic, hypokinetic, akinetic,                                    at end-diastole and end-systole (Fig. 1).
     dyskinetic.                                                                      v) Epicardial borders should be drawn on the
  d) In presence of segmental wall motion abnormalities,                                   middle of the chemical shift artifact line (when
     use of standard LV segmentation nomenclature                                          present).
     corresponding to the supplying coronary artery                                   vi) The LV end-diastolic image should be chosen as
     territories is recommended [3, 5, 7].                                                 the image with the largest LV blood volume.

 Fig. 1 Left ventricular (LV) chamber quantification. For LV chamber quantification, the endocardial (blue) and epicardial (yellow) contours are
 delineated in diastole (left) and systole (right) in a stack of short axis slices that cover the whole left ventricle. a and b illustrate the approach with
 inclusion of the papillary muscles as part of the LV volume. c and d show the approach with exclusion of the papillary muscles from the
 LV volume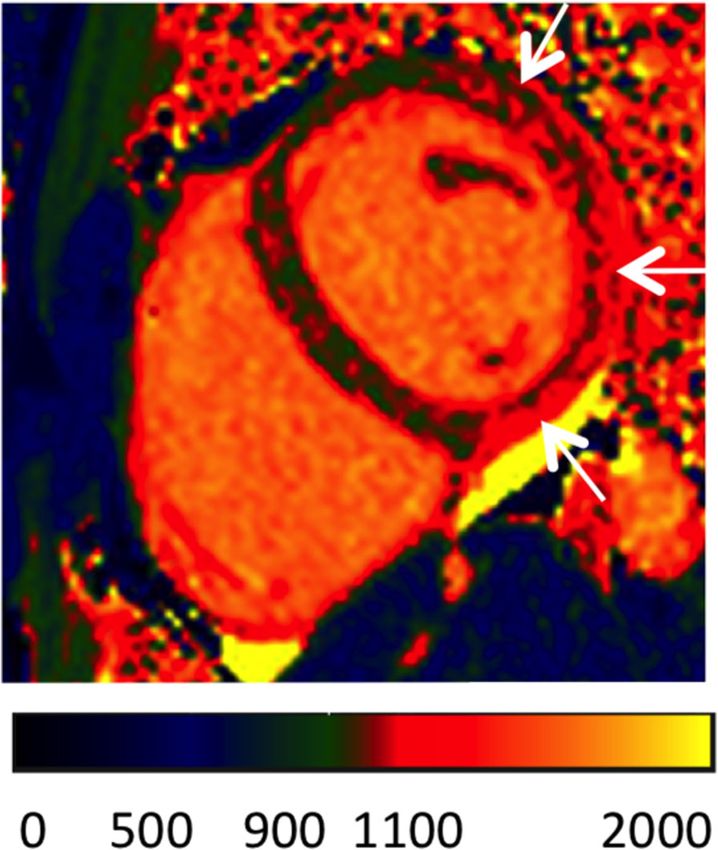
Schulz-Menger et al. Journal of Cardiovascular Magnetic Resonance   (2020) 22:19                                       Page 4 of 22

          For its identification, the full image stack should                   thickness and interslice gap) minus the total
          be be evaluated and one phase has to be identi-                       endocardial volume (sum of endocardial cross-
          fied as end-diastole for all the short axis loca-                     sectional areas multiplied by the sum of the slice
          tions. In addition, closure of the mitral valve or                    thickness and interslice gap), which is then
          the phase immediately before opening of the                           multiplied by the specific density of myocardium
          aortic valve may be used for orientation.                             (1.05 g/ml).
     vii) The LV end-systolic image should be chosen as                    ii) Papillary muscles: Papillary muscles and
          the image with the smallest LV blood volume.                          trabecular tissue are myocardial tissue and thus
          For its identification, the full image stack has to                   ideally should be included with the myocardium
          be evaluated and one phase has to be identified                       as part of LV mass, and this is particularly
          as end-systole for all the short axis locations.                      relevant in diseases with LV hypertrophy [6].
     viii)Deviations may occur and extra care should be                         However, readers may decide to exclude
          taken in the setting of LV dyssynchrony.                              trabecular tissue and papillary muscles from the
     ix) Automatic contour delineation algorithms must                          myocardial mass. Reference ranges that use the
          be checked for appropriateness by the reader.                         same approach must be used (Fig. 1) [8–10].
  b) LV volumes                                                            iii) Basal descent and apex: When the most basal
     i) Papillary muscles and trabecular tissue are                             slice contains only a small crescent of basal
          myocardial tissue and thus ideally should be                          lateral myocardium and no discernable
          included with the myocardium as part of LV                            ventricular blood pool, an epicardial contour for
          mass. As there is still discussion on the exact                       the visible myocardium is included for LV mass
          delineation of papillary muscles (e.g. versus                         only. Similarly, when the most apical slice
          trabeculation) and not all evaluation tools allow                     contains only a circle of myocardium without
          for their inclusion without manual drawing of                         cavitary blood pool, an epicardial contour
          contours, they are often included in the blood                        without an endocardial contour should be
          pool volume in clinical practice, which is                            drawn for LV mass calculations.
          acceptable. Reference ranges that use the same                d) Rapid quantitative analysis
          approach both on the acquisition and post-                       i) A rapid quantitative analysis, known as the area-
          processing side must be used. (Fig. 1) [8–10].                        length method, can be performed using biplanar
     ii) Outflow tract: The LV outflow tract is included                        (e.g. 2- and 4-chamber views) or rotational mul-
          as part of the LV blood volume. When aortic                           tiple long axis views. In cases without expected
          valve cusps are identified on the basal slice(s)                      significant regional variation of wall motion, this
          the contour is drawn to include the outflow                           technique allows for faster evaluation and is not
          tract to the level of the aortic valve cusps.                         limited by problems related to basal descent.
     iii) Basal descent: As a result of systolic motion of                      However, the 4-chamber view is strongly influ-
          the mitral valve toward the apex (basal descent),                     enced by breath-hold position. The accuracy is
          care must be taken with the one or two most                           not similar to short axis coverage, but allows a
          basal slices by using a standardized consistent                       fast analysis often more similar to transthoracic
          approach. A slice that contains LV blood volume                       echocardiography results. When the area-length
          at end-diastole may include only left atrium (LA)                     method is used, with either a single long-axis view
          without LV blood volume at end-systole. The LA                        or a biplane approach, specific mention of the
          can be identified by tracking wall thickening (if                     analysis technique should be made in the report.
          there is thickening - then it is in the LV cavity)               ii) Calculation [11–13]:
          and cavity (shrinking in systole, when in the cav-                    – Single long-axis equation: LV volume =
          ity). Alternatively, the basal slice may be defined                       0.85 × (LV-area)2/ LV-length. This is typically
          by at least 50% of the blood volume surrounded                            performed using a 4-chamber view with cal-
          by myocardium. Currently however, there is no                             culations of LV volume obtained on both
          expert consensus on which method to use. Some                             end-diastolic and end-systolic phases. LV
          software packages automatically adjust for systolic                       area is the planimetered area of the LV cavity
          atrioventricular ring descent using cross-                                from an endocardial contour with the base
          referencing from long axis locations.                                     drawn as a straight line through the medial
  c) LV mass                                                                        and lateral aspects of the mitral annulus. LV
     i) Calculation: difference between the total                                   length is the linear dimension from the mid-
          epicardial volume (sum of epicardial cross-                               point of the mitral annular line to the apical
          sectional areas multiplied by the sum of the slice                        tip of the endocardial contour.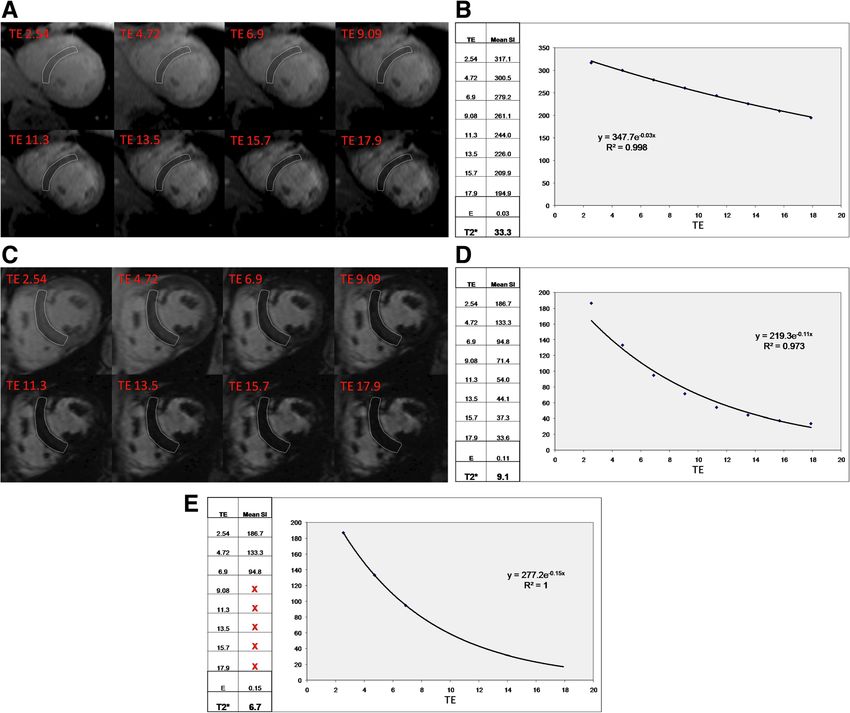
Schulz-Menger et al. Journal of Cardiovascular Magnetic Resonance   (2020) 22:19                                        Page 5 of 22

          – Biplane equation: LV volume = 0.85 × (LV-area1              b) Assessment of global and regional RV function
              x LV-area2) / LV length. Here, both 4-chamber                (septal wall, free wall), where appropriate. Wall
              (LV-area1) and 2-chamber [or vertical] (LV-                  motion should be described as hyperkinetic,
              area2) long-axis views are used to calculate both            normokinetic, hypokinetic, akinetic, or dyskinetic.
              end-diastolic and end-systolic volumes, similar              For qualitative regional analysis, wall motion in the
              to the single long-axis equation.                            RV free wall (e.g., basal, mid, and apical portions),
          – Multi-plane long axis: A series of long-axis                   outflow tract and inferior wall may be evaluated as
              views rotating around the central longitudinal               relevant to the specific clinical scenario and
              axis of the LV is used to calculate volumes.                 diagnosis.
              Six views provide results that do not differ              c) Assessment of LV and RV chambers for
              from short-axis stacks [14].                                 hemodynamic interaction (i.e. constrictive
  e) Cavity diameter and LV wall thickness can be                          physiology).
     obtained similar to echocardiography using two
     CMR approaches [12, 15]:                                         Quantitative analysis
     i) Basal short-axis slice: immediately basal to the
          tips of the papillary muscles.                                a) General recommendations
     ii) 3-chamber view: in the LV minor axis plane at                     i) Calculated parameters: RV end-diastolic volume,
          the mitral chordae level basal to the tips of the                     RV end-systolic volume, RV ejection fraction, RV
          papillary muscles.                                                    stroke volume, cardiac output, and body-surface
     iii) Both approaches have good reproducibility. The                        area indexed values of all except ejection fraction.
          3-chamber view is most comparable to data                             Similar to the LV, the parameters quantified may
          obtained with echocardiography.                                       vary depending on the clinical need [16].
     iv) For maximal LV wall thickness, the measurement                    ii) The contiguous stack of short-axis images or
          should be made perpendicular to the LV wall to                        axial cine images is evaluated with computer-
          ensure accurate measurements. At the apex,                            aided analysis packages (Fig. 2) [17, 18]. Auto-
          short-axis images are oblique to the axis of the                      matically generated contours have to be care-
          wall and will be inaccurate. In this location in par-                 fully reviewed.
          ticular, long-axis views should be used.                         iii) An axial stack of cines covering the RV provides
  f) Research:                                                                  the best identification of the tricuspid valve
     i) Real-time cine acquisitions become increasingly                         plane. A short-axis stack of cines is best for de-
          available and might be beneficial in patients                         lineating the inferior wall.
          with arrhythmia or limited breathholding                         iv) Endocardial borders are contoured at end-
          capacity. 3D cine acquisitions are also evolving                      diastole and end-systole (Fig. 2).
          to accelerate examination time. Post-processing                  v) The RV end-diastolic image should be chosen as
          of real-time images and 3D cine acquisitions is                       the image with the largest RV blood volume.
          still technically evolving. The Task Force                            For its identification, the full image stack has to
          chooses to refrain from making a dedicated                            be evaluated and one phase has to be identified
          statement at this time.                                               as end-diastole for all locations.
     ii) Quantitative evaluation of LV myocardial                          vi) RV end-systolic image should be chosen as the
          dynamics (e.g., strain, rotation, time-to-peak vel-                   image with the smallest RV blood volume. For
          ocity) is feasible by several imaging techniques                      its identification, the full image stack has to be
          (e.g., tagging, DENSE, SENC, tissue phase map-                        evaluated and one phase has to be identified as
          ping, feature tracking) and requires specific post-                   end-systole for all slices.
          processing software. As research applications are                vii) As for the LV, it may be necessary to review all
          evolving and consensus evidence is being accu-                        image slices in the stack to define end-systole.
          mulated, the Task Force chooses to refrain from                  viii)The pulmonary valve may be visualized, and
          making a dedicated statement at this time.                            contours are included just up to, but not
                                                                                superior to this level.
Right ventricular (RV) chamber assessment                               b) RV volumes
Visual analysis                                                            i) Total volumes are taken as the sum of volumes
                                                                                from individual 2D slices, accounting for any
  a) Review all cines in cine mode, validate observations                       interslice gap and slice thickness. RV trabeculae
     from one plane with the others, and check for                              and papillary muscles are typically included in
     artifacts and coverage of the right ventricle (RV).                        RV volumes.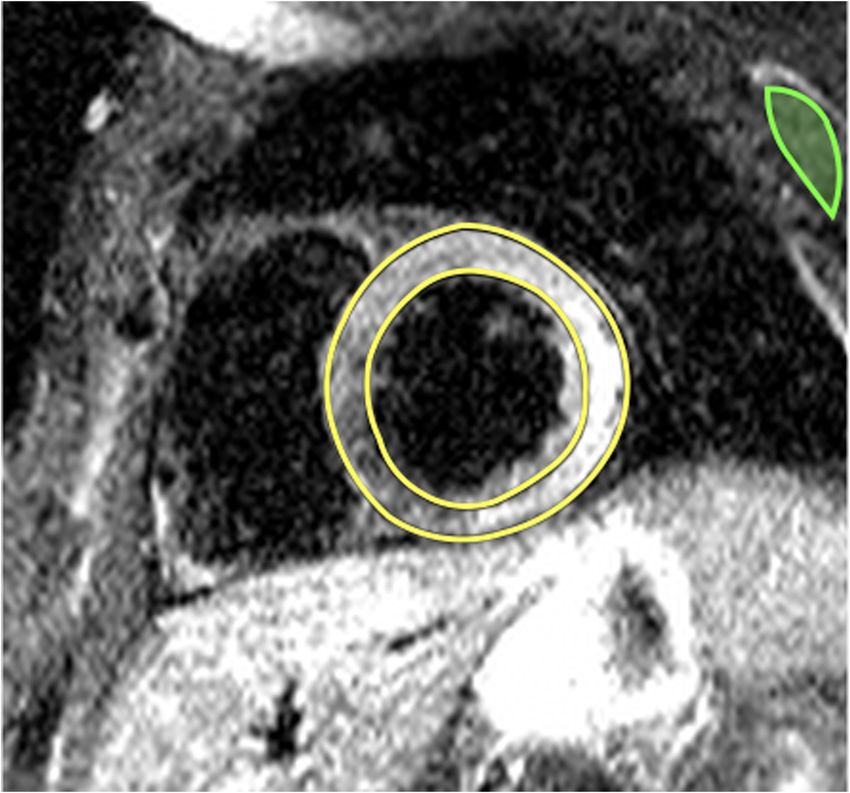
Schulz-Menger et al. Journal of Cardiovascular Magnetic Resonance             (2020) 22:19                                                     Page 6 of 22

 Fig. 2 Right ventricular (RV) chamber quantification. For RV volume quantification, the endocardial (red) contours are delineated in diastole (a)
 and systole (b) in a stack of transaxial slices covering the whole RV (top). Alternatively, a stack of short axis slices can be used (c, d). Here, the
 yellow contours indicate the RV in diastole (c) and systole (d); the RV is contoured following the LV analysis (in c and d, red / green contours
 indicate endocardial / epicardial borders of the LV) and with reference to the LV

  c) RV mass is usually not quantified in routine assessment.                          i) Display perfusion and corresponding LGE
     In selected patients, quantification of RV mass may be                                 images side-by-side.
     considered (e.g., in pulmonary hypertension).                                     ii) Adjust window, contrast and brightness level for
  d) Confirmation of results                                                                an optimized contrast within the LV
     i) If no shunts or valvular regurgitation is                                           myocardium (not the entire image). The aim of
         present, the RV and LV stroke volumes                                              image adjustment is to set a maximal window
         should be nearly equal (small differences are                                      width without “spilling” of the LV cavity signal
         seen as a result of bronchial artery supply                                        into the myocardium. Ensure that myocardium
         and papillary muscle inclusions in the                                             before contrast arrival is nearly black and that
         measurements). Since the LV stroke volume                                          the window settings maximize the contrast
         is more reliably determined than the RV                                            within the myocardium. Note that that the
         stroke volume, the LV data can be used to                                          correct level and window settings requires
         validate RV data.                                                                  review of both pre- and peak contrast images.
                                                                                       iii) Apply the same contrast, brightness and window
Post-processing of myocardial perfusion imaging                                             settings to all images of the dynamic series.
Visual analysis                                                                        iv) Review series as cines and/or by scrolling
                                                                                            through individual images.
                                                                                       v) Check that there was an adequate
  a) Workflow:                                                                              haemodynamic response to stress by reviewing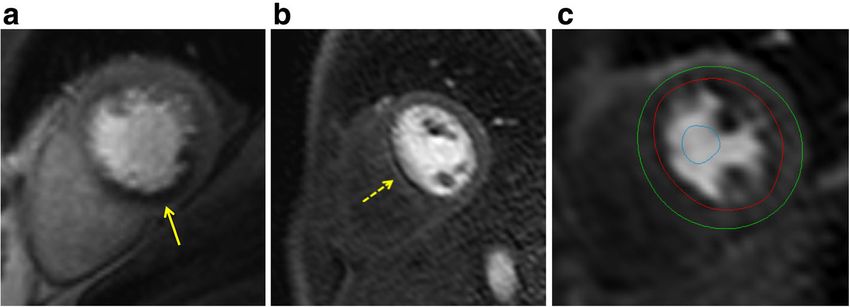
Schulz-Menger et al. Journal of Cardiovascular Magnetic Resonance          (2020) 22:19                                                  Page 7 of 22

          the heart rate and blood pressure change                                iv) Is usually most prominent in the subendocardial
          between stress and symptomatic response to                                   portion of the myocardium.
          stress. Images may also be checked for ‘splenic                         v) Often manifests as a transmural gradient across
          switch off’ during stress [19].                                              the wall thickness of the segment involved: most
     vi) The key diagnostic feature for identifying a                                  dense in the endocardium and gradually
          perfusion defect is the arrival and first passage                            becoming less dense towards the epicardium.
          of the contrast bolus through the LV                                    vi) Over time, defect regresses from the
          myocardium.                                                                  subepicardium towards the subendocardium.
     vii) Visual analysis is based on a comparison                                vii) Is present at stress but not at rest.
          between regions to identify relative                                    viii)Conforms to the distribution territory of one or
          hypoperfusion. Comparison should be made                                     more coronary arteries.
          between endocardial and epicardial regions,                          e) Interpret location and extent of inducible perfusion
          between segments of the same slice and                                  defect(s) using AHA segment model [5].
          between slices.                                                         i) Comment on transmurality of perfusion defect
  b) Stress images alone may permit the diagnosis of                                   [20].
     inducible perfusion defects. When the diagnosis is                           ii) Indicate extent of perfusion defect relative to
     unclear based on stress images alone and rest                                     scar on LGE.
     images are available, these two image series can be                       f) Criteria for dark banding artifacts (Fig. 3b): A
     compared. In general, an inducible perfusion defect                          common source of false-positive reports are suben-
     will be present on the stress, but not the rest                              docardial dark banding artifacts [21]. These artifacts
     images. If perfusion defects are seen on both stress                         have the following characteristics:
     and rest images, they may be artifacts or have other
     causes such as myocardial scar. Note that artifacts
     may be less pronounced or absent on rest                                  – Are most prominent when contrast arrives in the
     compared with stress images due to differences in                           LV blood pool.
     haemodynamics and contrast kinetics between                               – Lead to a reduction in signal compared with
     stress and rest.                                                            baseline myocardial signal whereas a true
  c) Scar tissue may not necessarily cause a perfusion                           perfusion defect does not show a decrease in
     defect, especially if rest perfusion is acquired after                      signal compared with baseline. These subtle
     stress. Scar should therefore always be identified                          differences can be hard to appreciate visually. It
     from LGE and not from perfusion images.                                     can therefore be helpful to draw a region of
  d) Criteria for an inducible perfusion defect (Fig. 3a):                       interest (ROI) around the suspected artifact and
     i) Occurs first when contrast arrives in LV                                 display its SI-time profile.
          myocardium.                                                          – Persist only transiently before the peak myocardial
     ii) Persists beyond peak myocardial enhancement                             contrast enhancement.
          and for several RR intervals.                                        – Appear predominantly in the phase-encoding
     iii) Is more than two pixels wide.                                          direction.

 Fig. 3 Perfusion imaging. a Perfusion defect in the inferior segments (yellow arrow). Note defect is predominantly subendocardial, affects the
 perfusion territory of the right coronary artery and is more than one pixel wide. b Dark banding artifact (yellow arrow). Note defect is very dark,
 occurs already before contrast reaches the myocardium, is seen in the phase encoding direction (right-left in this case), and is approximately one
 pixel wide. c Positioning of endocardial (red) and epicardial (green) contours and a region-of-interest (ROI) in the LV blood pool (blue) for
 semiquantitative or quantitative analysis of perfusion data
Schulz-Menger et al. Journal of Cardiovascular Magnetic Resonance (2020) 22:19 Page 8 of 22
– Are approximately one pixel wide. analysis. These problems are less likely if
Dark banding present at stress and at rest with acquisition is corrected for coil sensitivity.
no corresponding scar on LGE images is also
indicative of an artifact [22]. Note however that Quantitative analysis
differences in heart rate and baseline contrast can
change the appearance and presence of dark a) A quantitative analysis of the SI change in
banding between stress and rest perfusion images. myocardial perfusion CMR studies can be
Thus, absence of dark banding at rest with typical performed. Several methods have been described
dark banding at stress should not on its own be for this purpose. In clinical practice, these are rarely
considered diagnostic for an inducible perfusion required, but they may supplement visual analysis
defect. for example in suspected multi-vessel disease or
suspected inadequate response to vasodilator stress.
Fully automated methods for quantitative perfusion
analysis are becoming available and may soon be-
g) Pitfalls of visual analysis come more widely used. Quantitative analysis is also
i) Multi-vessel disease: Visual analysis is based on frequently used in research studies.
relative signal differences within an imaged b) Requirements:
section of the heart. Theoretically, the presence i) Validation and definition of a normal range with
of balanced multivessel disease can result in the specific pulse sequence and contrast regime
most or all of the imaged section appearing used for data acquisition. If only a comparison
hypoperfused, which can lead to false-negative between regions of the same study is made,
readings and needs to be considered in relevant establishing a normal range is less relevant.
clinical circumstances. In practice, however, ii) A temporal resolution of one RR interval is
truly balanced ischaemia is rare and a perfusion recommended.
defect in one or more territories will be more iii) Consideration of potential saturation effects
prominent. Even if all coronary territories are (higher contrast agent doses are more likely to
affected, the severity of the observed defects typ- lead to saturation effects).
ically is more pronounced around the geo- c) Semi-quantitative analysis:
graphic center(s) of the coronary territories. In i) Analysis methods that describe characteristics of
addition, a clear endocardial to epicardial signal the SI profile of myocardial perfusion CMR
gradient is usually seen in multi-vessel disease studies without estimating myocardial blood
[23]. Quantitative analysis of the dynamic perfu- flow are typically referred to as “semi-
sion data may be of further help to detect glo- quantitative analysis methods”.
bally reduced myocardial perfusion reserve in ii) Workflow:
multi-vessel disease. – Select an image from the dynamic series with
ii) Microvascular disease: Diseases that affect the good contrast between all cardiac
myocardial microvasculature (e.g., diabetes compartments (some post-processing tools
mellitus, systemic hypertension) may lead to a generate an average image of the series).
global subendocardial reduction in perfusion – Outline LV endocardial and epicardial
[24–27]. This can lead to false-positive readings contours on this image (manual or
relative to angiographic methods and needs to automated) (Fig. 3c).
be considered in relevant clinical circumstances. – Propagate contours to all other dynamic
Features suggesting microvascular disease are images.
the presence of concentric LV hypertrophy and – Correct contour position for in-plane motion
a concentric, often subendocardial perfusion de- (some analysis packages register images prior
fect crossing coronary territories. Differentiation to contours being outlined).
from multi-vessel disease can be challenging. – Depending on the type of analysis to be
iii) If vasodilation during stress data acquisition performed, place a separate ROI in the LV
was inadequate, visual analysis may lead to blood pool. Preferably, the basal slice is used.
false negative interpretation of the perfusion Exclude papillary muscles and flow artifacts
study [28]. from the ROI.
iv) The distance of the myocardium to the surface – Select a reference point in the LV
coil affects signal intensity and may lead to myocardium for segmentation (usually one of
misinterpretation if not considered in the the RV insertion points) [5].Schulz-Menger et al. Journal of Cardiovascular Magnetic Resonance (2020) 22:19 Page 9 of 22
– Segment LV myocardium according to AHA – Model-based methods [40, 41].
classification [5] – Model-independent methods [42, 43].
– Generate SI / time profiles for myocardial
segments +/− LV blood pool. Post-processing of late gadolinium enhancement
– Consider generating division into endocardial (LGE) of the left ventricle
and epicardial layers and repeat analysis [20]. Visual assessment
iii) Frequently used semi-quantitative analysis
methods (see [29] for detailed review): a) For most clinical indications, visual assessment of
– Maximal upslope of the myocardial SI profile, LGE images is sufficient.
may be normalized to LV upslope [30]. b) Workflow:
– Time to peak SI of the myocardial SI profile i) Modify image window and level so that:
[31, 32]. – Noise is still detectable (nulled myocardium
– Ratio of stress/rest values for the above should not be a single image intensity).
(often referred to as “myocardial perfusion – LGE regions are not saturated (LGE regions
reserve index”) [33, 34]. should not be a single image intensity).
– The upslope integral (area under the signal ii) Note, on magnitude (not phase-sensitive
intensity-time curve) [35]. inversion recovery [PSIR]) images, if normal
iv) Limitations of semi-quantitative analysis myocardium has a faint “etched” appearance
methods: (darkest at the border with slightly higher
– SI may vary according to distance from coil. image intensity centrally), this signifies an
This can be partially corrected by using a inversion time that was set too short and will
pre-contrast proton density image or other lead to underestimation of the true extent of
coil sensitivity correction tools. LGE (Fig. 4). In general, an inversion time
– No absolute measurement of myocardial that is slightly too long is preferred to one
blood flow given. that is slightly too short [44].
d) Quantitative analysis c) Criteria for presence of LGE.
i) Analysis methods that process the SI profile of i) High SI area that is visibly brighter than
myocardial perfusion CMR studies to derive “nulled” myocardium.
estimates of myocardial blood flow are typically ii) Verify regions with LGE in at least one other
referred to as “quantitative analysis methods” orthogonal plane and/or in the same plane
[29, 36, 37]. obtain a second image after changing the
ii) Requirements: direction of readout.
– It is a prerequisite for reliable quantification d) Assess pattern of LGE
that data acquisition used an appropriate i) Coronary artery disease (CAD) type: Should
pulse sequence and contrast regime. involve the subendocardium and be consistent
– The requirements for the acquisition method with a coronary artery perfusion territory.
depend on the analysis method. Currently, ii) Non-CAD-type: Usually spares the
this typically requires at least a proton subendocardium and is limited to the mid-wall
density image, the generation of an input or epicardium, although non-CAD-type should
function which is not saturated by using dual be considered if subendocardial involvement is
bolus [38] or dual contrast [39]. global [45].
– Motion correction to correct for respiratory e) Interpret location and extent using AHA 17-segment
motion is preferable. model [5] [20].
iii) Workflow: i) Comparison of LGE images should be made
– Manual analysis methods require contour with cine and perfusion images (if the latter are
placement as described above for semi- obtained) to correctly categorize ischemia and
quantitative analysis. Dynamic SI data are viability [46].
then typically exported to off-line worksta- ii) Estimate average transmural extent of LGE
tions for further processing. within each segment (0%, 1–25%, 26–50%,
– Fully automated methods are becoming 51–75%, 76–100%) [44].
available, which generate pixel-wise maps of iii) In patients with acute myocardial infarction,
myocardial perfusion without user input. include subendocardial and mid-myocardial
iv) Several analysis methods have been described, hypoenhanced no-reflow zones as part of
including: infarct size.Schulz-Menger et al. Journal of Cardiovascular Magnetic Resonance (2020) 22:19 Page 10 of 22
Fig. 4 Late gadolinium enhancement (LGE) imaging. Role of inversion time in LGE imaging: On the left panel which is a magnitude (non-PSIR)
LGE image, normal myocardium has a faint “etched” appearance (darkest at the border with higher signal intensity centrally) signifying an
inversion time that was set too short and which will lead to underestimation of LGE. On the right panel, the image was repeated with a longer
inversion time and demonstrates a larger LGE zone in the inferior wall. For non-PSIR magnitude imaging, always use the longest inversion time
possible that still nulls normal myocardium
f) Pitfalls to refrain from making a dedicated statement at this
i) Bright ghosting artifacts can result from poor time regarding the optimal method for quantitative
electrocardiogram (ECG) gating, poor breath- assessment [50–55].
holding, and long T1 species in the imaging
plane (e.g., cerebrospinal fluid, pleural effusion, Research tools / quantitative analysis
gastric fluid, etc.) [47]
ii) On non-PSIR images, tissue with long T1 a) Quantification of LGE extent:
(regions below the zero-crossing) may appear i) Manual planimetry:
enhanced [44, 48]. – Outline endocardial and epicardial borders.
iii) Occasionally, it can be difficult to distinguish no – Manual planimetry of LGE regions in each slice.
reflow zones or mural thrombus from viable – Summation of LGE areas.
myocardium. Imaging using a long-inversion time – Multiplication of total LGE area with slice
[49], using PSIR, or performing post-contrast cine thickness plus interslice gap as well as
imaging may be helpful in this regard. specific gravity of myocardium provides the
iv) In case of reduced contrast, the interpretation of approximate LGE mass, which can be used
additional sequences may be necessary (see to calculate the ratio of LGE to total
below section “Dark-blood/grey blood LGE”). myocardial mass.
v) In PSIR images manual windowing and – Considered subjective.
quantification algorithms may behave differently – Adjustment for regions with intermediate
when compared with magnitude images. signal intensities (grey zones) caused by
partial volume can improve reproducibility of
Quantitative analysis measurements [54].
ii) The n-SD technique:
a) Quantitative analysis is primarily performed to – Manual outlining of endocardial and
measure LGE extent and/or grey-zone extent for re- epicardial borders for the myocardial ROI.
search purposes. Subjective visual assessment is still – Manual selection of a normal “remote” (dark)
a prerequisite to identify poor nulling, artifacts, no- region ROI within the myocardium to define
reflow zones, etc., and to draw endocardial and epi- the reference SI (mean and standard
cardial borders. deviation, SD). This subjective approach can
b) Multiple different methods of delineating LGE extent affect measurements.
are described in the literature including the following: – It is susceptible to spatial variations in
manual planimetry, the n-SD technique, and the full surface coil sensitivity.
width half maximum (FWHM) technique. As the re- – Selection of a threshold between normal
search applications are evolving and consensus evi- myocardium and LGE. The relative SNR of
dence is being accumulated, the Task Force chooses scar tissue versus normal myocardium canSchulz-Menger et al. Journal of Cardiovascular Magnetic Resonance (2020) 22:19 Page 11 of 22
vary dependent on contrast agent type, dose – As the research application(s) are evolving and
and time after injection, field strength, type consensus evidence is being accumulated, the
of sequence and other variables including the writing group chooses to refrain from making a
underlying injury itself. As such, there is no dedicated statement at this time regarding the
cutoff value which works for all situations optimal method for quantitative assessment of
and usually manual tracing is performed as dark-blood/grey blood LGE images.
the standard of truth. But (semi-) automated d) LGE in other chambers than LV
thresholding may improve reproducibility
after adequate standardization. As a starting There is increasing evidence about LGE imaging of the
point for semiautomatic thresholding we RV, which is usually captured with standard LGE proto-
recommend 5-SD for infarction. There is cols imaging the LV. Imaging the thin LA wall is difficult
currently not enough evidence to provide a and requires specialized sequences. As the applications
cut-off for non-ischemic LGE. are evolving and consensus evidence is being accumu-
– The presence of LGE within the myocardium lated, the writing group chooses to refrain from mak-
is then determined automatically. ing a dedicated statement at this time regarding the
– Requires manual corrections to include no- post-processing assessment of LGE in chambers other
reflow zones and to exclude artifacts and LV than the LV.
blood pool (errors in the endocardial
contour).
iii) FWHM technique: Post-processing of T1 mapping
– Manual outlining of endocardial and Background
epicardial borders for the myocardial ROI. In 2013, the “T1 Mapping Development Group” published
– Uses the full width of the myocardial ROI SI a consensus statement that proposed suitable terminology
histogram at half the maximal signal within and specific recommendations for site preparation, scan
the scar as the threshold between normal types, scan planning and acquisition, quality control,
myocardium and LGE. visualization and analysis, and technical directions [62].
– Visual determination whether LGE is present Building on this initiative, the Consensus Group on
or not, and, if LGE is present, manual Cardiac MR Mapping has formed itself and published in
selection of a ROI that includes the region of 2017 “Clinical recommendations for CMR mapping of T1,
“maximum” signal. This subjective selection T2, T2* and extracellular volume: A consensus statement
can affect measurements. by the Society for Cardiovascular Magnetic Resonance
– Is also susceptible to spatial variations in (SCMR) endorsed by the European Association for
surface coil sensitivity, albeit perhaps less so Cardiovascular Imaging (EACVI)” [63]. The following rec-
than the n-SD technique [51]. ommendations refer to these consensus statements. For
– Considered more reproducible than the n-SD more details regarding when and how to use T1 mapping,
technique [53]. refer to this original consensus statement as well as to the
– Since the technique assumes a bright LGE SCMR protocol recommendations (Fig. 5).
core, it may be less accurate than the n-SD
technique if LGE is patchy or grey [56].
– Requires manual corrections to include no- Visual analysis
reflow zones and to exclude artifacts and LV
blood pool (errors in the endocardial a) The visual analysis of the series of differently T1-
contour). weighted source images should aim to detect and
b) Peri-infarct zone: verify diagnostic image quality.
– Multiple methods for quantifying the extent of the b) The visual analysis of the final T1 map should aim
peri-infarct or grey zones are reported [57, 58]. to detect artifacts and verify diagnostic image
– The Task Force does not endorse any specific quality. Automatically generated quality control
evaluation technique due to the strong impact of maps (e.g., T1*) may be used to exclude
partial volume effects. misregistration or significant artifacts.
c) Dark-blood/grey blood LGE c) Maps may be displayed in color if the pertinent
– Multiple techniques are described in the look-up tables are set according to site-specific
literature but one that is “flow-independent”, ranges of normal, or in gray scale in combination
(i.e., does not rely on blood flow to suppress with appropriate image processing, to highlight
blood-pool signal) is preferable [59–61]. areas of abnormality.Schulz-Menger et al. Journal of Cardiovascular Magnetic Resonance (2020) 22:19 Page 12 of 22
i) Extracellular volume (ECV) estimation requires T1
mapping acquisitions before contrast agent
administration (native T1) and after contrast agent
administration (typically > 10 min post-contrast to
approach steady-state conditions). The proposed
post-processing steps should be applied equally to
both maps.
j) For calculating ECV, a ROI in the center of the
blood pool in the native and in the post-contrast T1
map should be drawn excluding papillary muscles
and trabeculae.
k) For calculating ECV, hematocrit of the same day
should be available. If this is not available,
hematocrit may be estimated from native values of
blood pool T1 (“synthetic ECV”) [65].
l) ECV is given in %. The formula for calculating
ECV:
1 1
T 1myopostGd T 1myonative
Fig. 5 Native T1 map in a patient with acute myocarditis illustrating ECV ¼ ð100−hematocrit Þ
1 1
T1 elevation in the subepicardial lateral LV wall (modified from [64])
T 1blood postGd T 1blood native
Quantitative analysis
a) For global assessment and diffuse disease, a single m) Inline ECV maps can be a useful alternative to manual
ROI should be drawn conservatively in the septum ECV calculations. The raw images should be checked
on mid-cavity short-axis maps to reduce the impact to verify a diagnostic image quality and processing.
of susceptibility artifacts from adjacent tissues. n) For clinical reports, the type of pulse sequence,
b) In case of artifacts or inconclusive results obtained reference range, and type/dose of gadolinium
from mid-cavity ROIs, basal ROIs can be used for contrast agent (if applied) should be quoted.
validation. o) Mapping results should include the numerical
c) For focal disease, additional ROIs might be drawn in absolute value, the Z-score (number of standard de-
areas of abnormal appearance on visual inspection. A viations by which the result differs from the local
very small ROI (< 20 pixels) should be avoided. normal mean; if available), and the normal range of
d) The position and size of automatically generated the CMR system.
ROIs should be validated. p) Local results should be benchmarked against
e) Drawing ROIs on greyscale images rather than published reported ranges, but a local reference
color maps may reduce bias. range should be primarily used.
f) For assessing diffuse disease, focal fibrosis as q) Reference ranges should be generated from data
assessed by LGE imaging should be excluded from sets that were acquired, processed, and analyzed in
the ROI. the same way as the intended application, with the
g) There is currently no specific recommended / upper and lower range of normal defined by the
preferred analysis software package. The image mean ± 2 SD of the normal data, respectively.
reader should be trained with the local standards r) Parameter values should only be compared to other
and with the analysis software package of choice parameter values if they are obtained under similar
and be familiar with the appearance of artifacts. conditions. In other words, the acquisition scheme,
h) The sensitivity of mapping techniques to field strength, contrast agent and processing
confounders such as heart rate and magnetic field approach should be the same, and the results
inhomogeneities should be considered during should be reported along with corresponding
interpretation. reference ranges for the given methodology.Schulz-Menger et al. Journal of Cardiovascular Magnetic Resonance (2020) 22:19 Page 13 of 22
Post-processing of T2-weighted imaging e) High SI areas suggestive of myocardial edema
Visual analysis should be compared to
i) regional function.
a) The visual analysis of T2-weighted images aims for ii) other tissue pathology such as scar/fibrosis and
detecting or excluding regions with significant SI in- infiltration.
crease, as a marker for an increased free water con- f) Pitfalls of visual analysis:
tent (edema). i) Surface coil reception field inhomogeneity: The
b) Qualitative, visual analysis of myocardial SI may be uneven distribution of the sensitivity of the
sufficient for diseases with significant regional receiving surface coil may lead to falsely low SI in
injury to the myocardium, such as acute ischemic segments distant to the coil or falsely high SI in
injury/infarction, acute myocarditis (Fig. 6), stress- segments close to the coil surface, especially in
induced (Takotsubo) cardiomyopathy, and dark-blood triple-inversion recovery spin echo
sarcoidosis. (STIR, TIRM) images. If no efficient SI correction
c) Workflow: algorithm for balancing the signal intensity across
i) Identify and display appropriate image(s). the reception field is available, the body coil, albeit
ii) Modify image contrast and brightness in the with a lower signal-to-noise ratio, provides a
myocardial tissue to minimize SI in the most more homogeneous signal reception.
normal appearing myocardium (noise should ii) Low SI artifacts: Arrhythmia or through-plane mo-
still be detectable there) and to maximize the tion of myocardium may cause artifacts, making
maximal SI displayed in the myocardium area areas appear with falsely low SI, especially in dark-
without allowing for “over-shining”, i.e., blood triple-inversion recovery spin echo images.
displaying non-white pixels as white. iii) High SI artifacts: In dark-blood triple-inversion
iii) Check for artifacts (typically SI changes crossing recovery spin echo images, slow flowing blood
anatomical structures). may lead to insufficient flow suppression and
d) Criteria for edema: results in high SI of blood, typically along the
i) Clearly detectable high SI area respecting subendocardial border. This can be confused
anatomical borders. with myocardial edema.
ii) Follows an expected regional distribution
pattern (transmural, subendocardial, Semi-quantitative analysis
subepicardial, focal).
iii) Verifiable in two perpendicular views. a) Because low SI artifacts can lead to SI distribution
patterns that may mimic extensive myocardial
edema, a mere visual analysis may lead to incorrect
results. SI quantification with reference regions is
much less sensitive to these errors and therefore is
recommended.
b) Requirements:
i) Tested normal values for SI values or ratios.
c) Workflow
i) Global SI analysis:
– Outline LV endocardial and epicardial
contours.
– For the T2 SI ratio, draw the contour for a
ROI in a large area of the skeletal muscle
closest to the heart and to the center of the
reception field of the coil (for short axis views
preferably in the M. serratus anterior [66].
ii) Regional SI analysis:
– Draw the contour for a ROI in the affected
area and divide the SI by that of the skeletal
muscle.
Fig. 6 T2-weighted image (short-tau inversion recovery, STIR) in a iii) While a cut-off of 1.9 can be used for dark
midventricular short axis view with increased SI in the inferolateral
blood triple-inversion recovery spin echo [67], a
and lateral segments in acute myocarditis
locally established value is recommended,Schulz-Menger et al. Journal of Cardiovascular Magnetic Resonance (2020) 22:19 Page 14 of 22
because SI and ratio values may vary between analysis software package of choice and be aware of
sequence settings (especially echo time (TE)) and familiar with the appearance of artifacts.
and CMR scanner models. For these images, a h) Sensitivity of mapping techniques to confounders
color-coded map, based on the parametric cal- such as heart rate and magnetic field
culation and display of myocardial pixels with a inhomogeneities should be considered during
SI ratio of 2 or higher, can also be used. interpretation.
i) Mapping results should include the numerical
Post-processing of T2 mapping absolute value, the Z-score (number of standard de-
Background viations by which the result differs from the local
The Consensus Group on Cardiac MR Mapping published normal mean), and the normal reference range.
in 2017 “Clinical recommendations for CMR mapping of j) Parameter values should only be compared to other
T1, T2, T2* and extracellular volume: A consensus state- parameter values if they are obtained under similar
ment by the Society for Cardiovascular Magnetic Reson- conditions. In other words, the acquisition scheme,
ance (SCMR) endorsed by the European Association for field strength and processing approach should be
Cardiovascular Imaging (EACVI)” [63]. The following the same, and the results should be reported along
recommendations refer to this consensus statement. For with corresponding reference ranges for the given
more details regarding when and how to use T2 mapping, methodology.
refer to this original consensus statement as well as to the
SCMR protocol recommendations. Post-processing of T2* imaging
Visual analysis
Visual analysis T2* imaging always requires a quantitative analysis. Vis-
ual analysis is used to ensure adequate image quality,
a) The visual analysis of the series of differently T2- which is the most important factor for the accuracy of
weighted source images should aim for detecting data analysis.
and excluding artifacts and significant motion.
b) The visual analysis of the final T2 map should aim Quantitative analysis
for detecting and excluding artifacts.
c) Maps may be displayed in color if the color look up a) Evaluation of T2* always requires a quantitative
tables are set according to site-specific ranges of analysis using software with regulatory approval for
normal, or in gray scale in combination with appro- T2* evaluation in patients.
priate image processing, to highlight areas of b) Full thickness ROI located in the ventricular
abnormality. septum
i) Septal ROI is drawn on mid-LV short-axis
Quantitative analysis image.
ii) Take care to avoid blood pool and proximal
a) For global assessment and diffuse disease, a single blood vessels.
ROI should be drawn conservatively in the septum iii) A septal ROI avoids susceptibility artifact from
on mid-cavity short-axis maps to reduce the impact tissue interfaces.
of susceptibility artifacts from adjacent tissues. c) Mean myocardial SI from the ROI is plotted against
b) In case of artifacts or non-conclusive results on mid- TE (Fig. 7)
cavity ROIs, basal ROIs can be used for validation. i) SI falls with increasing TE.
c) For focal disease, additional ROIs might be drawn ii) Curve fitting should apply a validated algorithm.
in areas of abnormal appearance on visual iii) The time for the decay of SI falls (shorter T2*)
inspection. Very small ROIs (< 20 pixels) should be with increasing iron burden.
avoided. iv) In heavily iron overloaded patients, SI for higher
d) ROIs should be checked if generated automatically. TEs may fall below background noise causing
e) Drawing ROIs on greyscale instead of color maps the curve to plateau and underestimating T2*.
may avoid bias. v) This can be compensated for by:
f) Depending on the goal of the analysis, focal fibrosis – Truncating the curve by removing later echo
as assessed by LGE imaging may be excluded from times (Fig. 7e) [68, 69].
the ROI. – This issue is not significant when using the
g) There is currently no specific preferred analysis double inversion recovery (black blood)
software package. The image reader should be sequence [70].
trained with the local standards and with the d) Cut-off values at 1.5 Tesla:Schulz-Menger et al. Journal of Cardiovascular Magnetic Resonance (2020) 22:19 Page 15 of 22
i) Normal cardiac T2* is 40 ms [71] image location and orientation, especially in the
ii) T2* < 20 ms indicates cardiac iron overload [72] case of jet flow.
iii) T2* < 10 ms indicates increased risk of ii) Check for the appropriate velocity encoding. If
development of heart failure [73] the range of velocity encoding (VENC) is set too
e) CMR assessment of T2* at 3 T for assessment of high, visualization of the jet may not be obtained
iron overload cardiomyopathy cannot be and may be inaccurate as well as having poorer
recommended at this time. T2* shortens with SNR. If it is set too low, a mosaic pattern on the
increasing field strength making assessment of images will be visualized [77].
severe iron overload more problematic, and there is iii) If slice thickness is too large on in- or through-
a lack of clinical verification. plane velocity mapping, the higher velocities will
be “averaged out” with the lower velocities and
stationary tissue; jets and flow may not be visu-
Flow image interpretation and post-processing
alized correctly.
Background
iv) If the annulus of valves is very dynamic or the
CMR flow imaging provides information about blood flow
imaging plane is not set correctly, the valve
velocities and volumes, and enables the visualization of
morphology may not be visualized.
blood flow. Flow assessment in a 2D slice is in widespread
v) If imaging in the presence of metal containing
use. Recently, temporally resolved flow evaluation in a 3D
devices, signal loss may be present as artifact
volume (4D flow) has evolved enormously. It is currently
and interpretation must proceed with caution.
predominantly used for evaluating congenital heart dis-
vi) Check for appropriate spatial and temporal
ease. For further details regarding application, acquisition
resolution. For spatial resolution, 8 to 16 pixels
and postprocessing of 4D flow also refer to the corre-
should fill the vessel to obtain accurate results
sponding consensus document [74].
on through-plane velocity mapping. For tem-
poral resolution, there should be at least 11–16
Visual analysis frames per cardiac cycle [78].
a) Appropriately aligned acquisitions of cines and Quantitative analysis
stacks of cines can give valuable information on
flow in relation to adjacent structures, notably on a) Workflow:
the directions, time courses and approximate i) Through-plane measurements may be
dimensions of jets resulting from valve supplemented by in-plane measures if needed.
regurgitation, stenoses or shunts. Such information ii) Review phase and magnitude images side by
can be important in assessing the credibility of side. Window the magnitude and phase images
measurements of flow, which may be subject to to the appropriate brightness and contrast so
several possible sources of error. Gradient echo that the borders of the ROI are sharp.
cines differ somewhat from balanced steady state iii) Examine the images to ensure the quality is
free precession (bSSFP) in terms of degrees of signal sufficient and that the VENC was not exceeded, or
augmentation or reduction attributable to flow there is little contrast (i.e., the VENC was too high).
effects. Of note, bSSFP can provide clear delineation iv) Trace the borders of the vessel of interest on
between the relatively bright signal from voxels each phase and magnitude image so that only
aligned within the coherent core of a jet, and low the cavity of the vessel is included (Fig. 8); make
signal from the shear layer that bounds such a jet sure the noise outside the vessel is not included.
core. In- or through-plane phase contrast flow vel- Check that this is performed correctly on the
ocity acquisitions can also provide visual informa- magnitude images always keeping in mind that
tion on the directions, dimensions and time courses it is the phase images that contain the encoded
of flow; it can also image morphology, which can information.
yield a clue to the etiology of an abnormal jet [75, v) Baseline-correction may be considered. As the
76]. It is also often used in congenital heart disease. utility and exact methods are not yet
Color flow mapping in post-processing software established, the writing group chooses to refrain
may be useful in determining directionality of the from making a dedicated statement at this time
jet or morphology. regarding its use.
b) Pitfalls: vi) Directly calculated parameters include
i) Flow appearances on both cine and phase antegrade and retrograde volume, flow rate,
encoded acquisitions are highly dependent on peak and mean velocity.You can also read