STARBUCKS COFFEE ON OLIVE - SWC OLIVE AVE & 59TH AVE GLENDALE, AZ 85302 - LoopNet
←
→
Page content transcription
If your browser does not render page correctly, please read the page content below
STARBUCKS COFFEE
         ON OLIVE

SWC OLIVE AVE & 59TH AVE
  GLENDALE, AZ 85302

           OFFERING MEMORANDUM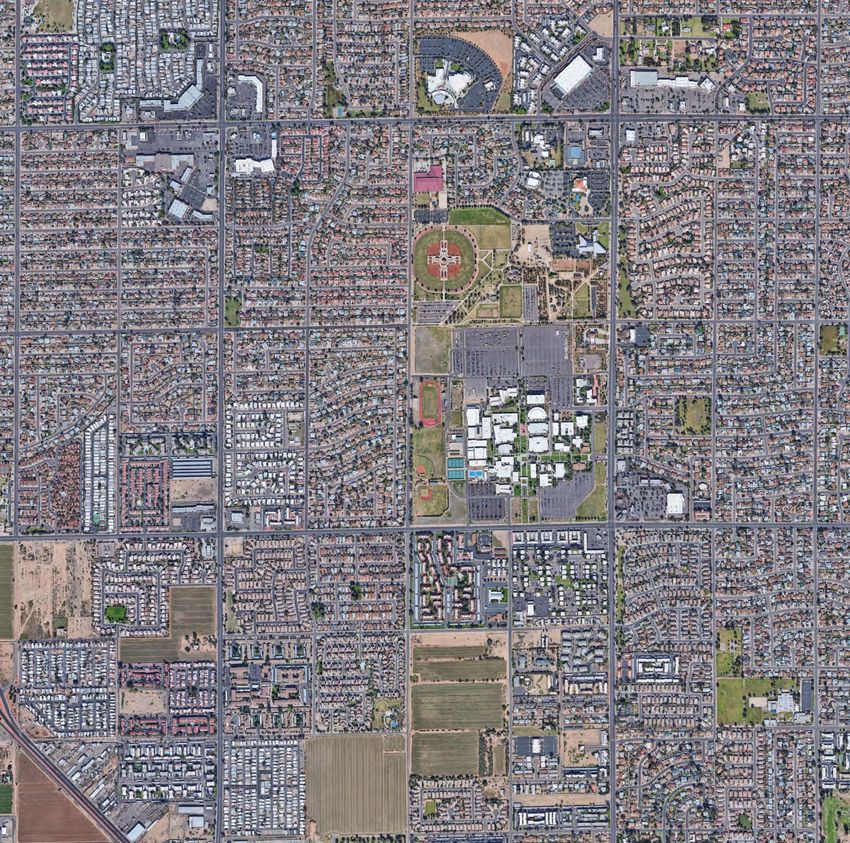
E X C L U S I V E LY M A R K E T E D B Y :

    ANDREW K. FOSBERG                      CHRIS ACKEL                            DYLAN A. BROWN
    Senior Vice President                  Senior Associate                       Capital Markets Analyst
    Investment Properties | Retail         CBRE | Office Properties               Investment Properties | Retail
    CBRE | Capital Markets                 +1 602 735 5254                        CBRE | Capital Markets
    +1 602 735 1723                        chris.ackel@cbre.com                   +1 602 735 1714
    andrew.fosberg@cbre.com                                                       dylan.brown@cbre.com
    www.cbre.us/invphxretail                                                      www.cbre.us/invphxretail

© 2019 CBRE, Inc. All Rights Reserved.

                                         © 2019 CBRE, Inc. All Rights Reserved.
AFFILIATED BUSINESS DISCLOSURE                            Property, (ii) you will hold it in the strictest   documents, including leases and other materials,
CBRE, Inc. operates within a global family of             confidence, (iii) you will not disclose it or      in summary form. These summaries may not be
companies with many subsidiaries and related              its contents to any third party without the        complete nor accurate descriptions of the full
entities (each an “Affiliate”) engaging in a broad        prior written authorization of the owner           agreements referenced. Additional information
range of commercial real estate businesses                of the Property (“Owner”) or CBRE, Inc.,           and an opportunity to inspect the Property
including, but not limited to, brokerage services,        and (iv) you will not use any part of this         may be made available to qualified prospective
property and facilities management, valuation,            Memorandum in any manner detrimental               purchasers. You are advised to independently
investment fund management and development.               to the Owner or CBRE, Inc.                         verify the accuracy and completeness of all
At times different Affiliates, including CBRE Global      If after reviewing this Memorandum, you            summaries and information contained herein,
Investors, Inc. or Trammell Crow Company, may             have no further interest in purchasing the         to consult with independent legal and financial
have or represent clients who have competing              Property, kindly return it to CBRE, Inc.           advisors, and carefully investigate the economics
interests in the same transaction. For example,                                                              of this transaction and Property’s suitability for
Affiliates or their clients may have or express                                                              your needs. ANY RELIANCE ON THE CONTENT OF
                                                          DISCLAIMER                                         THIS MEMORANDUM IS SOLELY AT YOUR OWN
an interest in the property described in this
Memorandum (the “Property”), and may be                   This Memorandum contains select                    RISK.
the successful bidder for the Property. Your              information pertaining to the Property             The Owner expressly reserves the right, at its
receipt of this Memorandum constitutes your               and the Owner, and does not purport to             sole discretion, to reject any or all expressions of
acknowledgement of that possibility and your              be all-inclusive or contain all or part of the     interest or offers to purchase the Property, and/
agreement that neither CBRE, Inc. nor any Affiliate       information which prospective investors            or to terminate discussions at any time with or
has an obligation to disclose to you such Affiliates’     may require to evaluate a purchase of the          without notice to you. All offers, counteroffers,
interest or involvement in the sale or purchase           Property. The information contained in this        and negotiations shall be non-binding and neither
of the Property. In all instances, however, CBRE,         Memorandum has been obtained from                  CBRE, Inc. nor the Owner shall have any legal
Inc. and its Affiliates will act in the best interest     sources believed to be reliable, but has not       commitment or obligation except as set forth
of their respective client(s), at arms’ length, not in    been verified for accuracy, completeness,          in a fully executed, definitive purchase and sale
concert, or in a manner detrimental to any third          or fitness for any particular purpose. All         agreement delivered by the Owner.
party. CBRE, Inc. and its Affiliates will conduct their   information is presented “as is” without           CBRE and the CBRE logo are service marks of
respective businesses in a manner consistent              representation or warranty of any kind.            CBRE, Inc. All other marks displayed on this
with the law and all fiduciary duties owed to their       Such information includes estimates                document are the property of their respective
respective client(s).                                     based on forward-looking assumptions               owners, and the use of such logos does not imply
                                                          relating to the general economy, market            any affiliation with or endorsement of CBRE.
                                                          conditions, competition and other factors
CONFIDENTIALITY AGREEMENT                                                                                    Photos herein are the property of their respective
                                                          which are subject to uncertainty and
Your receipt of this Memorandum constitutes               may not represent the current or future            owners. Use of these images without the express
your acknowledgement that (i) it is a confidential        performance of the Property. All references        written consent of the owner is prohibited.
Memorandum solely for your limited use and                to acreages, square footages, and other
benefit in determining whether you desire to              measurements are approximations.
express further interest in the acquisition of the        This Memorandum describes certain
INVESTMENT OPPORTUNITY
CBRE Retail Investment Properties has been retained as       credit rating and is publicly traded on NASDAQ under ticker
the exclusive representative to offer qualified investors    symbol “SBUX”. Starbuck’s investment-grade tenancy provides
the opportunity to purchase a brand-new, build-to-suit       substantial security to future cash flows, creating an exceptional
Starbucks Coffee (the “Property”) located on the southwest   opportunity for an investor seeking passive income from a well-
corner of Olive Avenue and 59th Avenue in Glendale,          located and high-quality asset.
Arizona. The offering consists of a ±2,400 square-foot,
freestanding, drive-thru Starbucks Coffee located directly   The Property presents an excellent opportunity for an investor
across the street from Glendale Community College (±20,506   to acquire a brand-new, build-to-suit Starbucks Coffee located
students enrolled), approximately 12 miles northwest from    across the street from Glendale Community College and in
Downtown Phoenix. Starbuck’s lease features 10% rental       the fast-growing and amenity-rich West Valley of metropolitan
increases every five (5) years during the initial 10-year    Phoenix.
lease term and throughout the tenant’s four (4), five-year
renewal option periods. This Starbucks is currently under-                    W OLIVE AVENUE
construction and and will open for business in Fall 2019.

Founded in 1971, Starbucks (NASDAQ: SBUX) is the largest
coffeehouse company in the world with 30,184 locations
and 290,000 employees worldwide. Over the past 5 years,
Starbucks has seen a doubling in market value and top-
line revenue growth. Most recently, Starbucks achieved
2018 revenues of $24.7 billion, marking a 10% year-over-
year increase, and significantly outperforming industry-
level revenue growth. Starbucks has an investment grade

                                                                                                                          N 59TH AVENUE
ACTUAL RENDERING

                                                                                                                   NOT TO SCALE
FINANCIAL SUMMARY                   RETURN SCHEDULE

       PRICE           $2,888,889                  ANNUAL     ANNUAL     RENTAL   CAP RATE
                                       YEAR
                                                   RENT PSF    RENT      GROWTH    RETURN
NET OPERATING INCOME    $130,000

                                    YEARS 1 - 5     $54.17    $130,000     -       4.50%
      CAP RATE           4.50%

                                    YEAR 6 - 10     $59.58    $143,000   10.00%    4.95%

                                    YEAR 11 - 15    $65.54    $157,300   10.00%    5.45%

                                    YEAR 16 - 20    $72.10    $173,030   10.00%    5.99%

                                    YEAR 21 - 25    $79.31    $190,333   10.00%    6.59%

                                    YEAR 26 - 30    $87.24    $209,366   10.00%    7.25%

                                    *Option to Renew Term is highlighted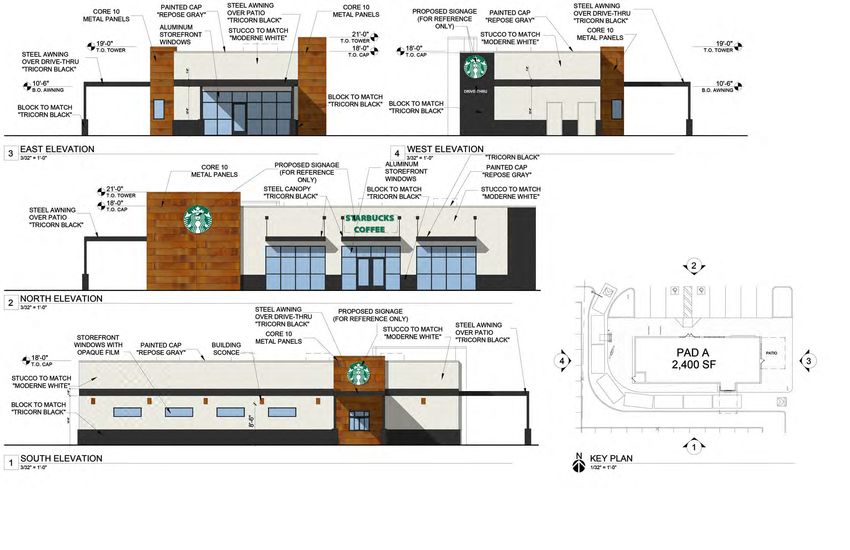
INVESTMENT HIGHLIGHTS
Brand-new, corporate 10-year lease with Starbucks Highly desirable location in the path of growth with over
Corporation (NASDAQ: SBUX). 450,000 residents living within a 5-mile radius (Source: Esri).
10% rental increases every five years in the initial 10-year National retailers located at the intersection include:
term and throughout the tenant’s four (4), five-year option McDonald’s, Panda Express, dd’s Discounts, Jimmy John’s,
periods. Circle K, Jack in the Box, Wing Stop, Cheba Hut, 7-Eleven and
Boost Mobile, among many others.
Brand-new 2019 construction featuring a patio and a drive-
thru. Excellent access and visibility at an intersection boasting
±55,400 vehicles per day (Source: City of Glendale 2015).
Premier hard corner location across the street from
Glendale Community College, one of the largest colleges in
the state of Arizona.
Glendale Community College achieves enrollment of ±20,506
students annually, creating a stable customer base for this
Starbucks once open.
The lease is guaranteed by Starbucks Corporation (S&P:
SI
BBB+) who achieved revenues in excess of $24.72 billion in TE
17
2018.
10
10
QUEEN CREEK RD.
ALMA SCHOOL RD.
NOT TO SCALE
ASSET PROFILE                                 DEMOGRAPHICS
                                                                                  I MILE                     3 MILES 5 MILES
NAME                  STARBUCKS COFFEE
                                              2019 POPULATION                    21,094                      166,144            453,996
                   SWC OLIVE AVE & 59TH AVE   2024 POPULATION                    22,344                      175,777            481,540
ADDRESS
                        GLENDALE, AZ
                                              GROWTH RATE 2019-2024              1.16%                       1.13%                1.18%
BUILDING SIZE              ±2,400 SF
                                              AVERAGE HH INCOME                  $57,769                     $63,486            $63,597
OCCUPANCY                    100%             2019 EMPLOYEES                     2,187                       40,757             121,507

                                              MEDIAN AGE                         34.80                       34.20                33.10
YEAR BUILT                   2019
                                                                                                                                Source: Esri

DESCRIPTION        FREESTANDING RESTAURANT

DRIVE-THRU                   YES

MONUMENT SIGNAGE             YES                                  SI
                                                                       TE
                                                                            17

PARCEL NUMBER            143-13-002W

PARCEL SIZE               ±30,712 SF
                                                             10

COUNTY                     Maricopa

ZONING               C-3, CITY OF GLENDALE
                                                                                     10
                                                                                                              QUEEN CREEK RD.

                                                                                           ALMA SCHOOL RD.
                                              NOT TO SCALE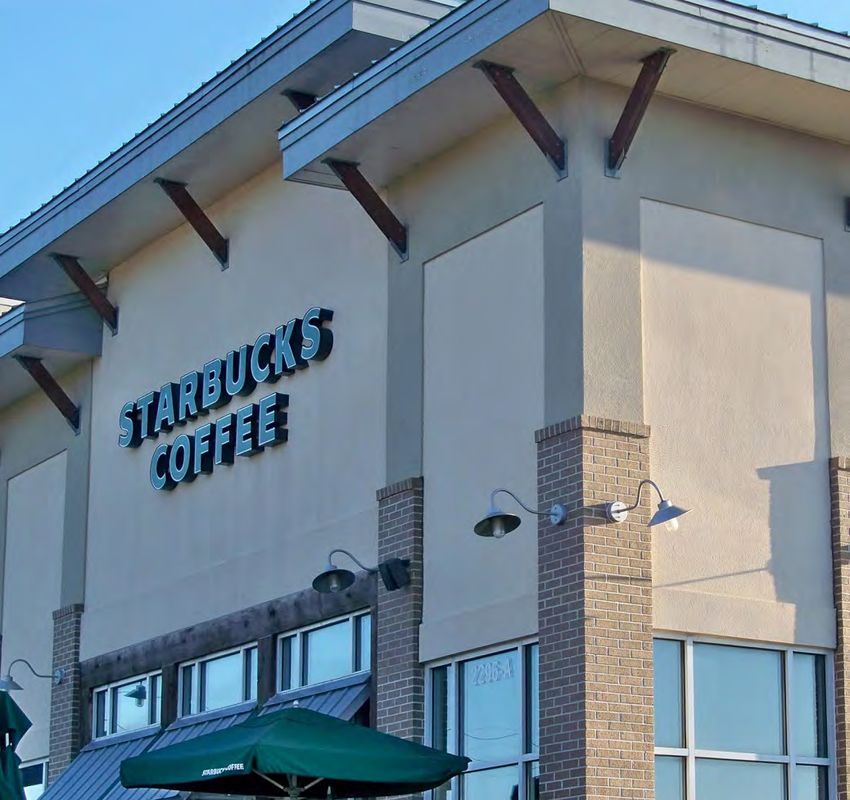
LEASE SUMMARY
TENANT NAME                              STARBUCKS COFFEE

COMPANY TYPE                            PUBLIC, CORPORATE

                                     STARBUCKS CORPORATION,
LEASE GUARANTOR
                                   A WASHINGTON CORPORATION

ASDAQ STOCK TICKER                              SBUX

TENANT S&P CREDIT RATING             BBB+ (INVESTMENT GRADE)

LEASE TYPE                               DOUBLE-NET (NN)

LEASE DATE                                   2/27/2019

COMMENCEMENT DATE                            1/31/2020

EXPIRATION DATE                              1/30/2030

BUILDING SF                                    ±2,400

LEASE TERM                                    10 YEARS

LEASE TERM REMAINING                          10 YEARS

RENTAL INCREASES                    10.00% EVERY FIVE (5) YEARS

OPTIONS TO RENEW                FOUR (4), FIVE-YEAR OPTION PERIODS

NOTE: The Landlord of the Starbucks is responsible for paying property
taxes, insurance and maintaining the common area of their parcel,
which is reimbursed by Starbucks. The Landlord is responsible for roof,
structure and parking lot replacement per the lease.
EXTERIOR ELEVATIONS

EAST ELEVATION        WEST ELEVATION

NORTH ELEVATION

SOUTH ELEVATION

                                       DESIGN REPRESENT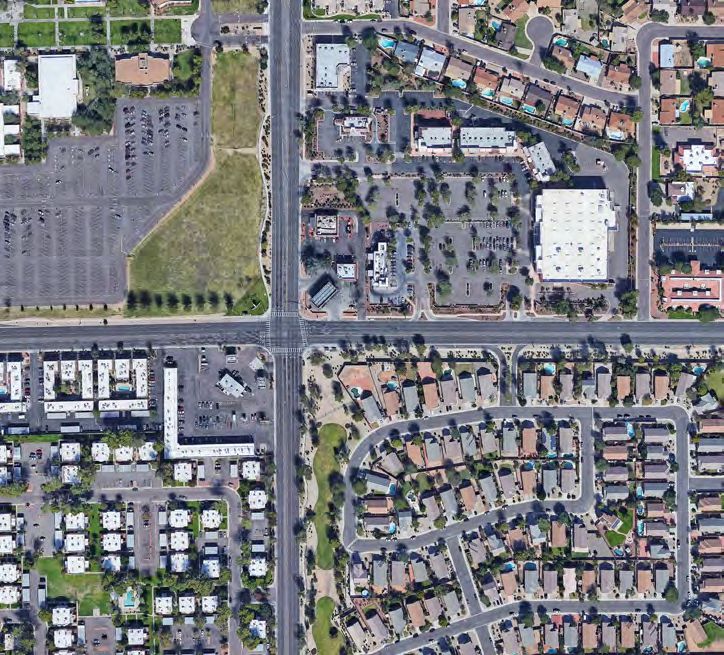
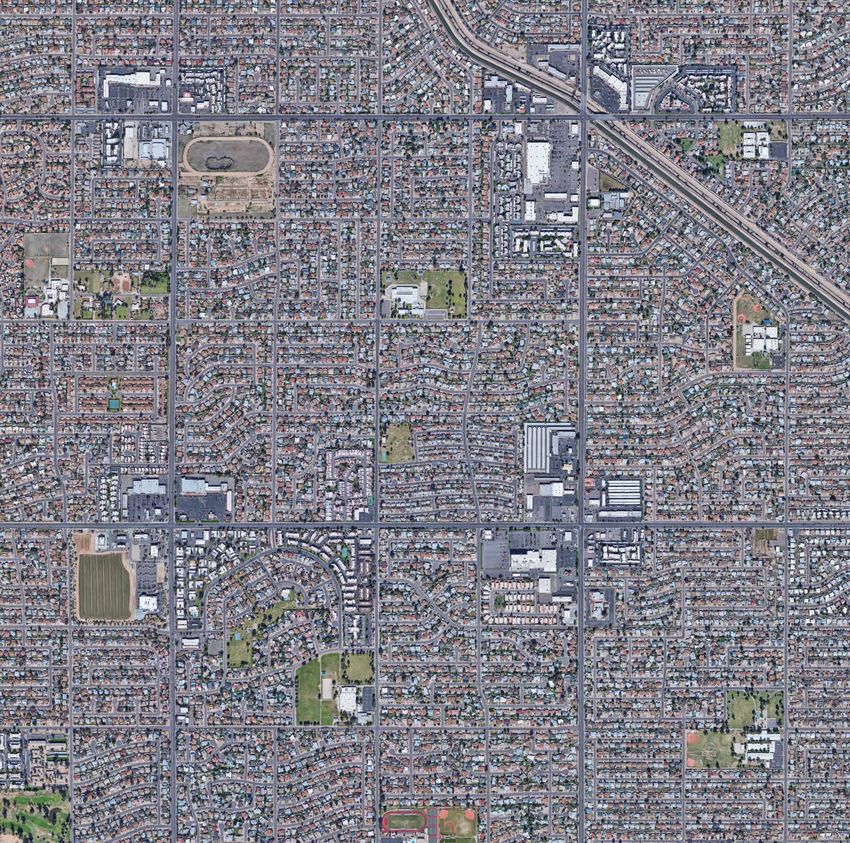
LOCATION OVERVIEW

The Property is located on the hard-southwest corner              on the northeast corner of the intersection, which features major
of Olive Avenue and 59th Avenue in Glendale, Arizona,             national retailers such as: McDonald’s, Panda Express, Jack in
approximately 12 miles northwest from downtown                    the Box, Jimmy John’s, Papa John’s, dd’s Discounts, Circle K, Wing
Phoenix and approximately 17 miles from Sky Harbor                Stop, Shako Mako Grill, Pizza Patron, Red Star Vapor and Boost
International airport. This brand-new Starbucks Coffee is         Mobile, among other local retailers. Due to a lack of developable
well-positioned directly across the street from Glendale          land in the trade area, there is very little retail competition
Community College, one of the largest community colleges          located nearby providing new ownership with income security
in Arizona, with over 20,500 students enrolled each year.         and downside protection.
The Property is also situated in a high-growth residential
and commercial corridor with 453,113 residents living
within a five-mile radius, a 1.07% annual growth rate since                                                                OLIVE PARK
                                                                                                                             RETAIL
2010. This population is expected to grow to 481,540 by the
end of 2024 (Source: Esri). Additionally, this Starbucks will
benefit from the thousands of workers commuting to the
trade area each day with over 121,000 daytime employees                  GLENDALE
working within five miles of the subject Property, on top               COMMUNITY
of the student traffic generated by Glendale Community                   COLLEGE
                                                                       ±30,000 STUDENTS
College. The Property benefits from easy access and
excellent visibility at the highly-trafficked, signalized
intersection of Olive Avenue and 59th Avenue which boasts
                                                                   OLIVE AVENUE ±30,600 VPD*
over 55,000 vehicles each day.

                                                                                          59TH AVENUE *±24,800 VPD
The Property is located on the hard corner just north of                          E
Starcrest Shopping Center which features a complementary                    SIT
collection of national and local service-oriented retailers,
including: 7-Eleven, Cheba Hut, Liberty Tax Services,
iphoenix, Dorsey B’s Fish & Fixins, Level 10 Barber Shop,
African Market & Beauty Supply, Alley Kat Tattoo, Watermill
Express and Trails Smoke Shop, among others. The only
retail competition at the intersection is Olive Village, a dd’s                                                      *CITY OF GLENDALE 2015
                                                                                                                      OUTLINE NOT TO SCALE
Discounts-anchored community shopping center located
TENANT OVERVIEW
Starbucks Corporation is an international coffee and coffeehouse chain based in Seattle,
Washington. Starbucks was founded in 1971 and is the largest coffeehouse company
in the world, with approximately 30,184 locations and 291,000 employees worldwide.
Starbucks sells drip brewed coffee, espresso-based hot drinks, snacks and retail items.
The famed coffeehouse has become a beacon for coffee lovers on a global scale,
providing genuine service, an inviting atmosphere and expertly roasted brewed coffee to
millions of customers every day. The company operates on a global scale with a presence
in the in the following destinations: The Americas, Europe, Middle East and Africa, and
in China/Asia Pacific. Its brand portfolio includes: Starbucks Coffee, Teavana, Seattle’s
Best Coffee, Evolution Fresh, La Boulange, Ethos, Starbucks Reserve and Princi. In 2018,
Starbucks continued its excellent financial performance announcing top-line revenues of
approximately $24.7 billion, a 10% increase over the prior year.
STARBUCKS CORPORATION REVENUE (FY 2018): $24.7B
NASDAQ STOCK SYMBOL: SBUX TOTAL EMPLOYEES: ±291,000
STANDARD & POOR’S CREDIT RATING: BBB+ (INVESTMENT GRADE) TOTAL NUMBER OF LOCATIONS: ±30,184
FORTUNE 500 RANKING: 121 (2019) COMPANY WEBSITE: WWW.STARBUCKS.COM
#5 “World’s Most Admired Company” - Fortune (2019)
#1 Most Valuable Restaurant in the World” - QSR Magazine (2018)
#30 “World’s Most Innovative Companies” - Forbes (2018)
#34 “World’s Most Valuable Brand” - Forbes (2018)CHOLLA STREET
WALMART
GLENDALE COMMUNITY
PEORIA AVENUE COLLEGE
±30,000 STUDENTS
LANDMARK ON 67TH
51ST AVENUE
56 UNITS PLANNED
OLIVE AVENUE ±30,600 VPD*
59TH AVENUE *±24,800 VPD
OLIVE TREE
APARTMENTS
762 UNITS
ALICE PARK
187 SINGLE-FAMILY
WESTPOINT VILLAGE HOMES PLANNED GLENDALE
89 SINGLE-FAMILY AMERICAN
HOMES PLANNED ELEMENTARYSARIVAL FARMS CHOLLA STREET
86 SINGLE-FAMILY
HOMES PLANNED
AR
51ST AVENUE
IZO
NA
CA
NA
43RD AVENUE
L
PEORIA AVENUE
WALMART
51ST AVENUE
43RD AVENUE
HORIZON
ELEMENTARY
*CITY OF GLENDALE 2015
SITE OUTLINE OVERLAYS NOT TO SCALEPHOENIX RETAIL MARKET VIEW IMPORTANT
RETAIL INDICATORS
VACANCY PHOENIX PHOENIX
8.3% UNEMPLOYMENT EMPLOYMENT GROWTH
LEASE RATES 4.20% 3.70%
$16.57 PER SF
NET ABSORPTION
280,186 SF SINGLE FAMILY HOUSING POPULATION
PERMIT GROWTH GROWTH
UNDER CONSTRUTION 2.30% 2.20%
737,803 SF
Phoenix retail metrics stabilized through Q1 2019. Big-box retailers, dominated by fitness, were especially active in 2018
and this trend continued into Q1 2019 with fitness leading the leasing activity across the Valley. Quarter over quarter,
the market-wide vacancy rate decreased 10 basis points (bps) to 8.3%. One year ago, the market-wide vacancy rate was
8.4%. Despite recent big-box move-outs in the last 12 months, which included Sears, K-Mart, Sam’s Club, and Toys “R”
Us, the Phoenix retail market outlook is positive.
Several positive economic indicators supported demand for retail space in the Phoenix metro. For the two noteworthy
retail-demand drivers of population and employment growth, Phoenix led the nation for both. In 2018, 68,080 jobs were
added in Phoenix, ranking it fourth among all metros. Additionally, Phoenix was the fourth fastest growing metro during
2017 with the addition of 88,772 residents. Further job growth and a tightening labor market boosted wages, which
supported retail spending and bodes well for local retailers through 2019.
Furthermore, the strengthening housing market helped generate demand for retail amid a changing retail landscape.
Housing starts particularly concentrated in suburban areas in the Southeast, Northwest, and Southwest and retailers
followed. The Trailhead, a Safeway-anchored shopping center development, was recently announced in Peoria, where
there’s been tremendous housing growth over the last several years.
Source: CBRE ResearchMARKET SUMMARY
The Phoenix metropolitan area has become an increasingly Efforts to diversify the Phoenix economy, market its strengths
vibrant community and economic hub over the last several and make the region a friendlier place to do business have paid
decades, attracting new residents and businesses alike. Today, dividends. Today, the Phoenix metro area is increasingly known
the Greater Phoenix region is home to more than 4.7 million for its high quality of talent, relatively low taxes and business
residents and continues to grow. The Phoenix MSA was the friendly regulatory climate. This combination, backed by
fourth fastest growing metro in the nation from mid-year 2016 numerous public-private partnerships between government,
to mid-year 2017 and it ranks 11th in total population. The industry and leading educational institutions, supports a
metro remains attractive not only because of a competitive dynamic entrepreneurial community. Furthermore, the Valley
advantage with regard to cost, but also because of an overall has become a preferred location for finance, technology and
value proposition, which includes its talent pool, quality of life advanced manufacturing. Companies also benefit from the
and infrastructure. metro’s inherent advantages; for example, its strategic location
provides access to major markets within one day’s drive.
G ROW I N G P O PU L ATI O N G ROW I N G A N D D I V E R-
AND LABOR POOL S I F Y I N G EC O N O M Y
M E T R O P O L I TA N
PHOENIX
B U S I N ES S
A F FO R DA B I LIT Y F R I E N D LY
A N D Q UA LIT Y E N V I RO N M E NT
O F LI F EWEST VALLEY OVERVIEW
Phoenix’s West Valley has achieved tremendous growth MAJOR ATTRACTIONS
over the last several decades. An influx of residents and
businesses are helping the region shed its image as a • Westgate Entertainment District • ISM Raceway (host to
bedroom community, earning its reputation as a great • State Farm Stadium (Arizona NASCAR)
place to live, work and play. Today, more than 1.6 million Cardinals) • Ak-Chin Pavilion
people call the West Valley home, and its population over • Gila River Arena (Phoenix Amphitheater
the next five years is projected to grow at twice the national Coyotes) • Wildlife World Zoo,
average rate of growth. The region’s mix of luxury and • Five MLB Spring Training Aquarium & Safari Park
affordable housing contributes to a diverse community that Stadiums: Goodyear Ballpark • Tanger Outlets
attracts both executives and first-time home buyers. West (Indians and Reds), Peoria Sports • Desert Diamond West
Valley amenities—including Westgate, P83 and Park West Complex (Mariners & Padres), Valley Casino
entertainment districts, State Farm Stadium (home of the Camelback Ranch (White Sox • Vee Quiva Casino
Arizona Cardinals), Gila River Arena (home of the Phoenix & Dodgers), Surprise Stadium • Wigwam Resort & Spa
Coyotes), five spring training stadiums, and continuously (Rangers & Royals), and Maryvale
expanding dining options—provide an exceptional quality of Baseball Park (Brewers)
life for its residents.
The West Valley’s large talent pool, affordable cost of living
and doing business, and availability of land has attracted
healthcare, distribution and advanced manufacturing
companies to the region over the last several years. Recent
business announcements in the West Valley include
Farmer’s Insurance, AKOS Medical Campus, Chewy.com,
Conair, Ball Corporation, SK Food Group and UPS are
bringing thousands of jobs to the area, and Microsoft is
also making a significant capital investment. Additionally,
Luke Air Force Base, headquartered in the West Valley, is
a major economic driver in the region, with an economic
impact of $2.2 billion in the state of Arizona. Each year,
450 professionals separate from military service and many
stay in the region, adding to the strong workforce. Lastly,
numerous educational institutions in the West Valley,
including Arizona State University West, Grand Canyon
University and Ottawa University, ensure employers that
their future labor needs are met. NOT TO SCALE
Source: CBRE ResearchECONOMIC PROFILE
KEY EMPLOYERS
KEY INDUSTRIES
Name Employees
Luke Air Force Base 7,840
Banner Health 7,090
Amazon 5,880 Healthcare Warehouse/Dist. Manufacturing Aerospace Finance
American Express 3,890
Grand Canyon University 2,800
Pinnacle West Capital Corp. 2,510 1,412 910 646 83 559
BUSINESSES BUSINESSES BUSINESSES BUSINESSES BUSINESSES
Abrazo Healthcare 2,070
Petsmart 2,000 46,300 42,140 31,320 5,230 22,070
JBS Packerland Tolleson 1,540 EMPLOYEES EMPLOYEES EMPLOYEES EMPLOYEES EMPLOYEES
Marshalls 1,480
Source: Maricopa Association of Governments, 2017
HonorHealth 1,400
Swift Transportation 1,390
Humana 1,340
Empereon Marketing 1,340
Macy’s 1,320
AAA Arizona 1,100 RETAILERS EXPANDING IN THE WEST VALLEY
UPS 1,040
JPMorgan Chase 930
Consumer Cellular 850
Shamrock Foods Company 840
Honeywell 830
Midwestern University 820
Kenyon Plastering 800
Triwest Healthcare Alliance 800
Wells Fargo 800
Fed. Reserve Bank of San Francisco 770
Western Regional Medical Center 770
UnitedHealth Group 720
Source: Maricopa Association of Governments, 2017WEST VALLEY COMMERCIAL REAL ESTATE (Q4 2018)
OFFICE
The West Valley’s office footprint accounts for less West Valley PHX Metro
than 13.0% of the metro’s total inventory with only
±10.7 MSF of office space. Despite the availability of Total Base 10.7M 88.9M
labor that attracts companies to the West Valley and
Vacancy 15.0% 15.2%
relatively low vacancy, office developers have remained
on the sidelines with only one build-to-suit underway Asking Rent (FSG/
$19.98 $26.55
in Q4 2018. Due to limited availability of Class A office Annual)
inventory in the region, the addition of new high-quality Under Construction 150,000 2,637,777
product could attract office tenants to the area.
INDUSTRIAL
The industrial sector has a strong presence in the West West Valley PHX Metro
Valley due to the large labor pool, strategic location and
Total Base 159.6M 318.2M
relative affordability compared to coastal markets. West
Valley industrial space accounts for half of metrowide Vacancy 7.2% 6.5%
inventory and an additional ±2.7 MSF of space is Asking Rent (NNN/
currently underway. Developers are trying to keep pace $0.50 $0.63
Monthly)
with growing demand from distribution and warehouse
users that has kept vacancy low. Under Construction 2,688,070 6,084,711
RETAIL
Household growth has attracted retailers to the West West Valley PHX Metro
Valley, particularly grocers and fitness users. The
West Valley’s retail base is ±52.6 MSF and new supply Total Base 52.6M 151.8M
is relatively limited with only ±136,900 SF underway. Vacancy 9.4% 8.4%
Vacancy is slightly above the metrowide average and
average rent is $15.72 per SF, which also sits below Asking Rent (NNN/
$15.72 $17.49
the market average. The continued increase in new Annual)
households and wage growth is expected to attract new Under Construction 136,900 737,950
retailers to the area.
Source: CBRE Research, Q4 2018STRATEGIC LOCATION
The Phoenix metro serves as
an optimal location due to its
proximity to major markets
which attracts firms that
export abroad to the Valley.
Companies that distribute HIGHWAY AND RAIL
throughout the western and LEGEND
SALT LAKE CITY
southwestern U.S. and Mexico RAILWAYS
benefit from the area’s location BAY AREA
DENVER 1-DAY HIGHWAY DELIVERY
and infrastructure that connects 2-DAY HIGHWAY DELIVERY
Arizona to 65 million people in 3-DAY HIGHWAY DELIVERY
LAS VEGAS
markets throughout California,
Colorado, Nevada, New Mexico, INLAND EMPIRE
Texas and Utah, which are
within a one-day truck haul. PHOENIX
ALBUQUERQUE
SAN DIEGO
DALLAS
TUCSON
HIGHWAY TRAVEL EL PASO
TIMES FROM PHOENIX SANTA ANA
City ±Miles ±Hours
Tucson 125 1.75 CHIHUAHUA HOUSTON
Las Vegas 285 5.25
Inland
310 4.10
Empire LOS MOCHE
San Diego 350 4.75 TORREON
MAZATLAN MONTERREY
El Paso 440 6.00
Albuquerque 475 6.25
Salt Lake CIUDAD VICTORIA
635 11.00
City
Bay Area 750 12.00
Dallas 1,120 15.00
Houston 1,185 17.50
Source: Greater Phoenix Economic CouncilPHOENIX DEMOGRAPHICS & ECONOMY
Robust population growth across the Valley is supported by Lastly, tourism remains an important economic driver in the
strong net migration. The metro’s population has grown from state and metro. In 2017, approximately 44 million people
375,000 people in 1950 to more than 4.7 million residents visited Arizona. The total economic impact totaled $22.7 billion
today. Between July 2016 and July 2017, the metro added and supported 128,000 jobs.
88,772 residents (an average of 243 people per day), making it
the fourth fastest growing metro in the nation. Over the same Source: CBRE Research
period, Maricopa County—where Phoenix is located—was
the fastest growing county in the U.S. Looking forward, the POPULATION BY AGE
Phoenix metro population is expected to grow at an average
annual rate of 1.8% over the next five years, more than double
the national rate of growth. 7.0%
Less than 5
While many know Phoenix as a retirement destination, the
metro boasts a relatively young population with a median
age of 35.9 years—approximately two years younger than the 20.1%
national median age. This young and growing labor pool offers 5-19
long-term stability to metro employers.
Metropolitan Phoenix is the economic engine of the state, 21.6%
accounting for two-thirds of Arizona residents and nearly 20-34
three-fourths of the state’s labor economy. The metro’s
unemployment rate of 4.5% in August 2018 is slightly below
the state’s (4.6%) and above the national unemployment rate 18.9%
(3.9%). The employment outlook for the metro is positive. 35-49
Notable growth is occurring in the construction, manufacturing,
professional and business services, and financial sectors. Rising
employment in these higher-paying industries, combined with 17.0%
a tightening labor market, is supporting wage increases. In 50-64
2017, the annual mean wage rose 4.1% to $49,500, just slightly
below the U.S. mean wage of $50,620.
15.2%
65+
Source: Esri, 2018HIGHLIGHTS
M E D I A N AG E U N E M P LOYM E N T
AZ US AZ US
35.9 38.3 4.5 3.9
Source: Esri; U.S. Bureau of Labor Statistics, August, 2018
RELATIVE COST INDEX
PHOENIX’S ROBUST POPULATION GROWTH DRIVEN BY NET MIGRATION
Cost of Living Cost of Business
Net Migration Natural Increase
160,000
San Francisco
140,000
Los Angeles
120,000
100,000 Denver
HISTORIC AVG: 89,990
80,000
Salt Lake City
60,000
40,000 Phoenix
20,000
Las Vegas
0
60 80 100 120 140 160 180
1990
1991
1992
1993
1994
1995
1996
1997
1998
1999
2000
2001
2002
2003
2004
2005
2006
2007
2008
2009
2010
2011
2012
2013
2014
2015
2016
2017
2018*
2019*
2020*
2021*
2022*
U.S. = 100
Source: Moody’s Analytics, Q2 2018 *Forecast Source: Moody’s Analytics, 2018MAJOR MILESTONES 2000
Kierland Commons
1998 opened in Scottsdale 2005
Chase Field Phoenix Biomedical 2008
opened in Phoenix Campus opened with
Metro Light Rail
TGen and IGC
opened in Phoenix
M E TRO PH OE N I X POPU L ATI ON G ROW TH 1990 2.2M
State Farm Stadium Loop 202
opened in Glendale completed in east
Tempe Town Lake
valley
completed Jobing.com Arena built
in Glendale
2006
1999 2008
20032010
Freeport-McMoRan
tower completed 2019
in Phoenix 2017 Completion of Block
2015
Intel announces 23
Marina Heights opens $7B investment in
Chandler, creating
3,000 jobs
2000 3.3M 2010 4.2M 2020 4.9M
Loop 303 connected to
I-10 freeway Thunderbird School of
State Farm Management Integrates
Campus completed with ASU and moves to
CityScape completed 2014 downtown Phoenix
in Phoenix
2017
2018
2010EDUCATION
The Phoenix metropolitan area is home to nationally ranked
schools and world-renowned universities that prepare RANKED #1
FOUR YEARS IN A ROW
the area’s workforce to meet current and future employer ASU IS COUNTRY’S MOST IN-
needs. An abundance of higher education programs NOVATIVE UNIVERSITY
and the talent exiting them help to maintain the metro’s
attractiveness to businesses. 103,530
STUDENTS ENROLLED
FALL 2017
ARIZONA STATE UNIVERSITY
World renowned and consistently ranked, ASU is one of the
largest public universities in the country. Total enrollment TOP10 UNIVERSITY FOR RESEARCH
between the four metropolitan campuses and SkySong was
#5 IN THE NATION FOR
103,530 students in fall 2017. BEST-QUALIFIED GRADUATES
Source: CBRE Research
AWARDED 6,257 STEM DEGREES
DURING 2016-2017 SCHOOL YEAR
EDUCATIONAL ATTAINMENT
HIGH SOME BAC H E LO R ’ S
SCHOOL C O L L EG E OR HIGHER
22.9% 33.3% 31.3%
Source: ESRI, 2018UNIVERSITY OF PHOENIX TOP 10 LARGEST
Wholly owned by the Apollo Education Group and EDUCATIONAL INSTITUTIONS
headquartered in Tempe, the University of Phoenix is one of FALL 2017 ENROLLMENT
the largest private universities in the nation. The university (STUDENTS)
focuses on providing access to education for working adults
and offers degree programs at the associate through doctoral
levels. 103,530
GRAND CANYON UNIVERSITY 20,424
Grand Canyon University (GCU) is a private university with
approximately 19,000 students enrolled at its main campus in 19,179
Phoenix in addition to 60,000 online students. GCU continues
to expand its footprint and currently offers over 200
bachelor’s, master’s and doctoral degree programs. 19,031
MARICOPA COMMUNITY COLLEGE 19,000
Maricopa Community College (MCC) is one of the
largest community college districts in the country, with
approximately 200,000 students. MCC consists of 10 colleges
14,906
throughout the greater Phoenix region, providing degrees
and workforce training programs.
11,428
UNIVERSITY OF ARIZONA 10,329
The University of Arizona opened the Phoenix College of
Medicine campus in 2007. The campus is part of the city-
owned Phoenix Biomedical campus, a ±30-acre urban medical 9,788
and bioscience center with more than 6 million square feet of
planned biomedical-related research, academic and clinical
facilities.
9,458
Source: CBRE Research, Phoenix Business Journal
Source: CBRE ResearchOFFERING MEMORANDUM
ANDREW K. FOSBERG CHRIS ACKEL DYLAN A. BROWN
Senior Vice President Senior Associate Capital Markets Analyst
Investment Properties | Retail CBRE | Office Properties Investment Properties | Retail
CBRE | Capital Markets +1 602 735 5254 CBRE | Capital Markets
+1 602 735 1723 chris.ackel@cbre.com +1 602 735 1714
andrew.fosberg@cbre.com dylan.brown@cbre.com
www.cbre.us/invphxretail www.cbre.us/invphxretail
SWC OLIVE AVE & 59TH AVE
GLENDALE, AZ 85302You can also read