STATE OF PLAY: RENEWABLE ENERGY LEADERS AND LOSERS - CLIMATECOUNCIL.ORG.AU - Climate ...
←
→
Page content transcription
If your browser does not render page correctly, please read the page content below
STATE OF PLAY:
RENEWABLE ENERGY
LEADERS AND LOSERS

CLIMATECOUNCIL.ORG.AU
Thank you for
supporting the
Climate Council.
The Climate Council is an independent, crowd-funded organisation
providing quality information on climate change to the Australian public.

    Published by the Climate Council of Australia Limited.
    ISBN:    978-0-6486793-7-0 (print)
             978-0-6486793-6-3 (digital)
    © Climate Council of Australia Ltd 2019
    This work is copyright the Climate Council of Australia Ltd. All material
    contained in this work is copyright the Climate Council of Australia Ltd except
    where a third party source is indicated.
    Climate Council of Australia Ltd copyright material is licensed under the
    Creative Commons Attribution 3.0 Australia License. To view a copy of this
    license visit http://creativecommons.org.au.
    You are free to copy, communicate and adapt the Climate Council of Australia
    Ltd copyright material so long as you attribute the Climate Council of Australia
    Ltd and the authors in the following manner: State of Play: Renewable Energy
    Leaders and Losers.
    Authors: Ella Weisbrot, Tim Baxter, Greg Bourne, Andrew Stock and Fiona Ivits.

    —
    Cover image: Image courtesy of Gullen Range Wind Farm.
    This report is printed on 100% recycled paper.

         facebook.com/climatecouncil                 info@climatecouncil.org.au

         twitter.com/climatecouncil                  climatecouncil.org.au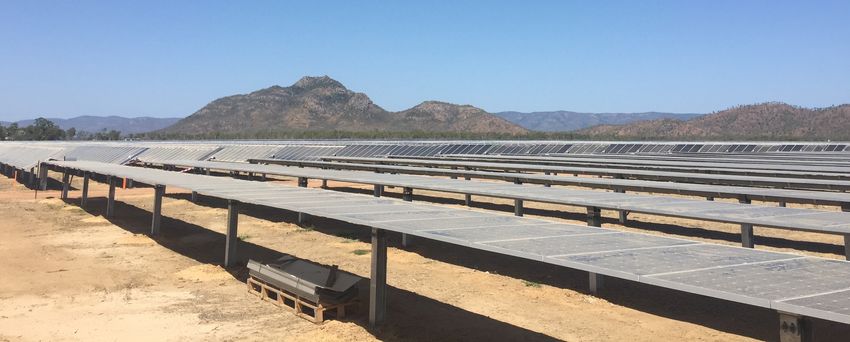
PREFACE   iv

Preface
States and territories are leading the transition to renewable
energy in Australia, as the Federal Government is not only
failing to lead but getting in the way of progress.

Every year the Climate Council tracks the relative progress of
Australian states and territories based on their performance across
a range of renewable energy metrics: share of electricity from
renewable energy; proportion of households with rooftop solar;
large-scale wind and solar capacity per capita; and targets or policies
in place to support the transition. We outline the progress made by
each state and territory government over the last twelve months in
the race to a renewable future. This report is the Climate Council’s
fifth scorecard evaluating state and territory progress on renewable
energy. This report follows on from previous state and territory
renewable energy updates in 2014, 2016, 2017, and 2018.

We appreciate the assistance of Huw Jones in the preparation of this
report. We would also like to thank the relevant state and territory
departments for reviewing and providing feedback on the state and
territory profiles.

Authors

Ella Weisbrot                         Tim Baxter
Researcher (Climate Solutions)        Senior Researcher (Climate Solutions)

Greg Bourne                           Andrew Stock
Climate Councillor                    Climate Councillor

Fiona Ivits
Cities Power Partnership
THE AUSTRALIAN
      RENEWABLE ENERGY RACE:
             2019 SCORE CARD
                                                                                                     SA
                                                                                 ACT
                                                                                                                       FRONT
                                                                                                                      RUNNERS

                                                                              TAS
                                              VIC                          CATCHING
                                                                              UP

                                          Q LD
                      NSW
                                               AT THE
                     WA                   STAR TI NG BLOCKS

             NT
                           Wind & solar
             Renewable     capacity per    % solar      Renewable      Net zero
State /      electricity   person (kW)     households   energy         emissions
Territory:   (2018)        (March 2019)    (Oct 2019)   targets        targets          Highlights

             51.2%         1.25            35.0%        Net 100% in    Net zero         Aiming for 100% renewables in the 2030s.
SA                                                      the 2030s      by 2050          Over 50% wind and solar energy in
                                                                                        the grid.

             54.1%         1.27            16.1%        100% by 2020   Net zero         On track to achieve 100% renewable
ACT                                                                    by 2045          energy from 1 January 2020.

             94.6%         0.60            15.1%        100% by 2022   Net zero         Aiming to support the National Electricity
TAS                                                                    by 2050          Market as the Battery of the Nation.

             17.3%         0.34            17.9%        25% by 2020;   Net zero         Legislated 50% renewable energy target
                                                        40% by 2025;   by 2050          by 2030.
VIC                                                     50% by 2030                     Greatest capacity of wind and solar
                                                                                        projects in the pipeline.

             8.8%          0.38            35.7%        50% by 2030    Net zero         Installed the most large-scale wind and
QLD                                                                    by 2050          solar per capita since last year’s report.

             17.3%         0.25            20.4%        -              Net zero         Shortlisting large-scale renewables and
NSW                                                                    by 2050          storage for funding and supporting
                                                                                        uptake of rooftop solar and batteries.

             8.2%          0.28            28.8%        -              Net zero         Introduced an aspirational target of net
WA                                                                     by 2050          zero emissions by 2050.

             4.0%          0.12            18.1%        50% by 2030    (Draft target)   Introduced a draft aspirational target of
NT                                                                     Net zero         net zero emissions by 2050.
                                                                       by 2050
CLIMATE COUNCIL                       i

Contents
Preface............................................................................................................................................................................................... iv

Key Findings..................................................................................................................................................................................... ii

1.     The year in review: Leaders and losers in the renewables race..................................................................................1

2.     States and territories step up as the Federal Government deserts the field........................................................... 3

3.     State and Territory Renewable Energy Scorecard 2019............................................................................................... 8
       3.1        Percentage renewable electricity                                                                                                                                                    9
       3.2        Wind and solar capacity per person                                                                                                                                                 12
       3.3        Proportion of households with rooftop solar                                                                                                                                        14
       3.4        Renewable energy and emissions reduction targets and policies                                                                                                                      18

4.     The leaderboard: State and territory by renewable energy progress......................................................................21
       4.1        Front runners                                                                                                                                                                     22
       4.2        Catching up                                                                                                                                                                        31
       4.3        At the starting blocks                                                                                                                                                            37

5.     Leadership at the local level: Councils step up in the renewable energy race.................................................... 45

6.     Afterword: Moving on without the Federal Government.......................................................................................... 49

References........................................................................................................................................................................................51

Image Credits................................................................................................................................................................................. 55
ii    STATE OF PLAY:
      RENEWABLE ENERGY LEADERS AND LOSERS

     Key Findings
     1            2
     South Australia has won this year’s state and           Victoria and Queensland are making good
     territory renewables race, with the ACT and             progress on the transition to renewable
     Tasmania hot on its heels.                              energy, but will need to work hard to catch
                                                             the front runners.
     › South Australia, the Australian Capital Territory
       (ACT) and Tasmania are way ahead of the other         › Victoria wins the ‘Rising Star’ Award for having
       states and territories across a range of renewable      the most substantial capacity of large-scale
       energy metrics. These include share of renewable        wind and solar projects in the pipeline of any
       energy, wind and solar capacity per capita, and         state or territory.
       policies in place to support the transition to
       renewable energy.                                     › Queensland wins the ‘Most Improved’ Award
                                                               for eclipsing the other states and territories in
     › South Australia is a global leader in transitioning     terms of increased large-scale wind and solar
       to a grid with a high share of wind and solar PV        capacity per person from last year’s report.
       energy. The state now generates over half of its        Nearly half of the large-scale renewable energy
       electricity from wind and solar, and is aiming for      projects completed across Australia in 2018
       net 100% renewable energy in the 2030s.                 were in Queensland.

     › The ACT is on track to achieve 100% renewable         › Despite progress, Queensland is not on track to
       energy from 1 January 2020. This is a remarkable        meet its target of 50% renewable energy by 2030.
       achievement and makes the ACT just the eighth
       jurisdiction in the world with a population above     › The Queensland Government continues to
       100,000 – and the only one outside of Europe –          support new fossil fuel developments in the
       to achieve 100% renewable electricity.                  state, which is fundamentally at odds with
                                                               action on climate change.
     › Tasmania’s Battery of the Nation plan could
       double Tasmania’s renewable energy capacity
       and generate local jobs and billions of dollars in
       investment.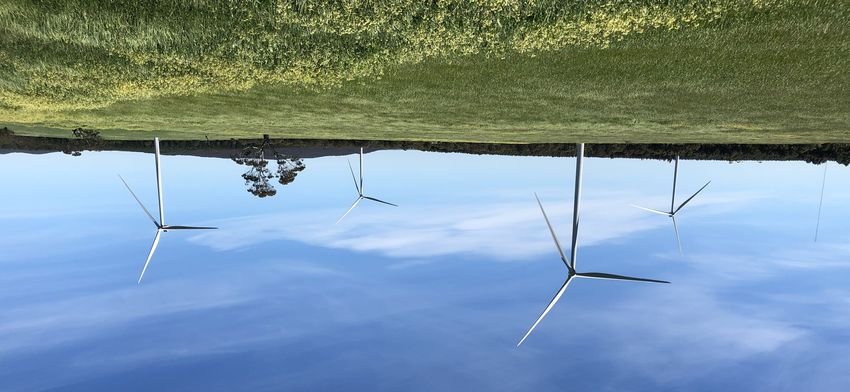
KEY FINDINGS     iii

3
New South Wales and Western Australia are the
                                                           4
                                                           States and territories are driving the transition
only states without a renewable energy target,             to a renewable future, in the face of the Federal
while the Northern Territory ranks last or near            Government’s lack of leadership.
the bottom on most other metrics.
                                                           › Increasing global temperatures – driven primarily
› The Northern Territory wins the ‘Wooden Spoon’             by greenhouse gas emissions from burning coal,
  for finishing last in this year’s renewables race, as      oil and gas – are exacerbating extreme weather
  it has in every scorecard to date. However, recent         events in Australia and globally. Australians are
  signals from the Northern Territory Government             enduring bushfire conditions, heatwaves and
  are encouraging.                                           flooding made worse by climate change.

› The Northern Territory recently announced a              › To tackle climate change effectively, we must
  draft aspirational target for net zero emissions by        rapidly reduce our greenhouse gas emissions by
  2050, making it the last state or territory to release     accelerating the uptake of renewable energy and
  a net zero target. While this is an important step         storage technologies. Emissions have been rising
  in the right direction, the draft plan supports            year-on-year for five years under the Federal
  expansion of the territory’s gas industry, which is        Government. This is why leadership from states
  incompatible with achieving net zero emissions.            and territories is so crucial.

› Like the Northern Territory, Western Australia’s         › If the Northern Territory’s draft target for net
  Government is supporting gas developments,                 zero emissions is adopted, it will mean that all
  while the New South Wales Government                       states and territories will have a target for net zero
  continues its vocal support for coal. There can            emissions by 2050 at the latest. Australia will have
  be no new coal or gas projects, whether for                a de facto target even in the absence of Federal
  export or domestic use, if Australia is to address         Government leadership or policy.
  intensifying climate change.
                                                           › The Federal Government is not only failing to
                                                             lead, it is getting in the way of state and territory
                                                             leadership on renewable energy. As a result, several
                                                             states and territories have declared the intention to
                                                             go it alone on renewable energy policy. It is time
                                                             for all states and territories to create their own
                                                             forums for coordination and move on without the
                                                             Federal Government.

                                                                                         climatecouncil.org.au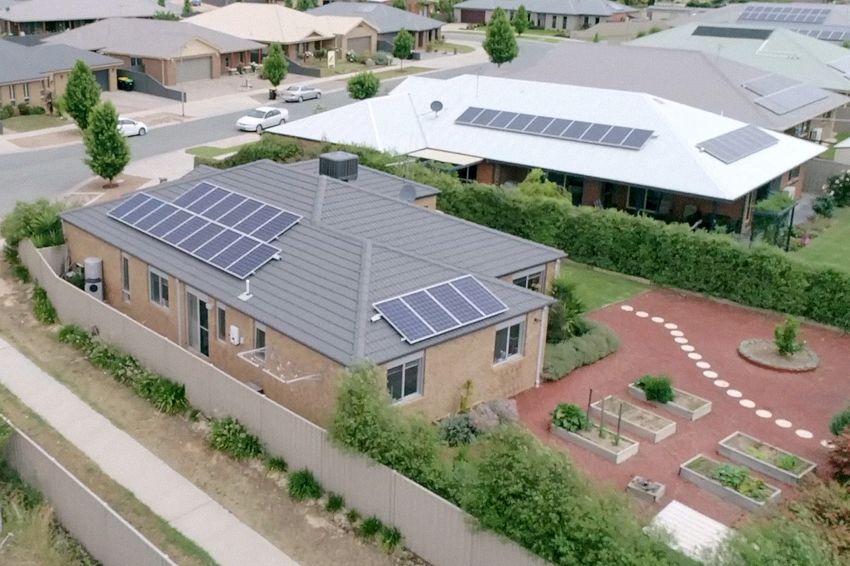
1 STATE OF PLAY:
RENEWABLE ENERGY LEADERS AND LOSERS
1. The year in review:
Leaders and losers in
the renewables race
Following the summary on the transition. Section Four profiles progress
next page, Section Two outlines the made by each state and territory since
broader context underpinning this last year’s report. Section Five highlights
report. Section Three dives into the leadership at the local government level.
scorecard criteria, including share of Lastly, the Afterword calls for states and
renewable energy, large-scale wind territories to create their own forums for
and solar capacity per person, share coordination and move on without the
of households with rooftop solar, and Federal Government.
policies and targets to support the
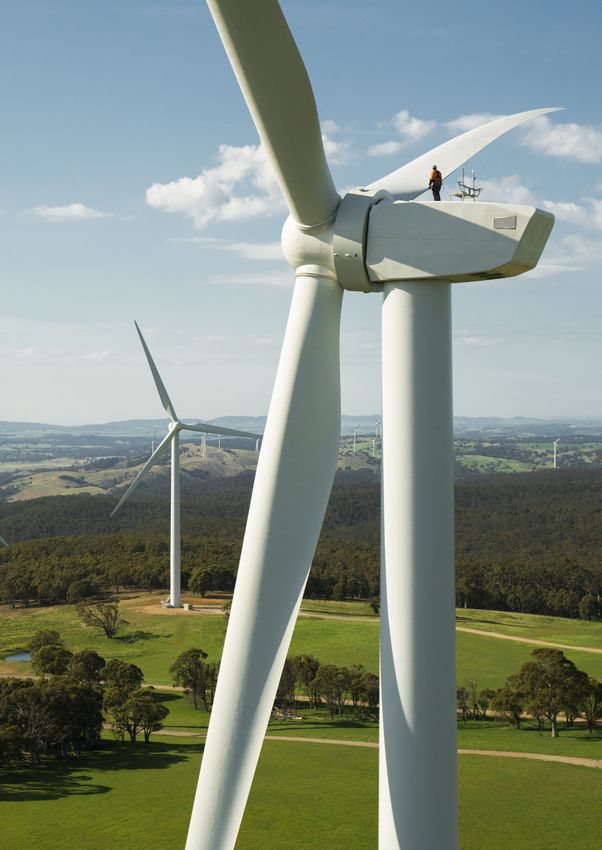
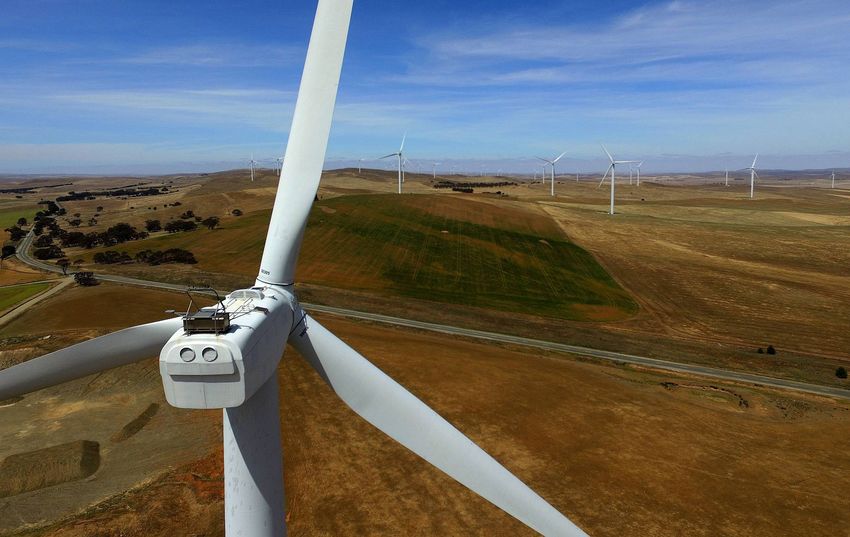
Figure 1: South Australia is in first place and is a global leader in transitioning to a grid with a high share of wind and solar
backed by storage, thanks to projects such as the Hornsdale Wind Farm and Power Reserve.
THE YEAR IN REVIEW

                                           LEADERS AND LOSERS
                                           IN THE
                                                  RENEWABLES RACE
Each year the Climate Council compares the                      State and territory governments are leading the way
progress of states and territories across a range of            in transitioning to renewables, as the Federal
renewable energy metrics: share of renewable                    Government abandons the field on credible climate
electricity; share of households with rooftop solar;            and energy policy. While all states and territories are
large-scale wind and solar capacity per capita; and             making progress, some are way ahead in the race
government targets or policies in place to support              towards a renewable future, while others are still
the transition. This report is the Climate Council’s            tying their shoes:
fifth scorecard.

1ST PLACE: SOUTH AUSTRALIA                                        2ND PLACE: ACT
          In first place, South Australia is now over 50%                   Winning an ‘Honourable Mention’, the ACT
          renewable and is aiming for 100% in the 2030s.                    is on track for 100% renewable energy from
          The state is a global leader in integrating a high                2020, and announced a new reverse auction
          share of wind and solar into the grid. The state                  to ‘future proof’ this achievement. Shifting
          government has released a Hydrogen Action                         focus to new sources of emissions, the ACT
          Plan, one of several states and territories                       released a strategy for net zero emissions by
          seeking to seize the opportunities provided by                    2045, focusing on emissions from transport
          renewable hydrogen.                                               and the built environment.

3RD PLACE: TASMANIA                                               4TH PLACE: VICTORIA
          Tasmania rounds out the front runners in                          Coming fourth, Victoria wins the ‘Rising
          third place this year. The state is on track to hit               Star’ Award for having the greatest capacity of
          100% renewable energy by 2022. Tasmania is                        large-scale wind and solar in the pipeline.

                                                                    4
          progressing in its ambition to be the ‘Battery                    The state recently legislated a Victorian
          of the Nation’, conducting feasibility studies of                 Renewable Energy Target of 50% by 2030, and
          three pumped hydro sites that could supply a                      has committed $1.3 billion to Solar Homes, a
          massive new interconnector to Victoria over                       program to increase rooftop solar and storage.
          the next 10-15 years.

5TH PLACE: QUEENSLAND                                             6TH PLACE: NEW SOUTH WALES
          Queensland is fifth and wins the ‘Most                            New South Wales is still coming off the starting
          Improved’ Award for the most substantial                          blocks in sixth place. The state is making some
          increase in per person large-scale wind and                       progress but does not have a renewable energy

  5                                                                 6
          solar capacity. However, the state is not on                      target, and the government continues its vocal
          track to meet its target of 50% renewables by                     support for coal. More positively, the New South
          2030, is late to release a policy plan for its net                Wales Government has announced it will set
          zero emissions by 2050 target, and continues                      interim targets to chart a course towards its
          to support new fossil fuel developments.                          target of net zero emissions by 2050.

7TH PLACE: WESTERN AUSTRALIA                                      8TH PLACE: NORTHERN TERRITORY
          Western Australia is second last. The state                       The Northern Territory wins the ‘Wooden
          announced an aspirational target of net zero                      Spoon’ for finishing in last place yet again.
          emissions by 2050 and is developing a                             The government released a draft target of

  7
          climate policy, but has signalled ongoing                         net zero emissions by 2050 and a draft
          support for the gas industry. Western                             roadmap to achieve it, although the plan
          Australia launched a Renewable Hydrogen                           supports the expansion of the gas
          Strategy but it includes a possible role for                      industry. The territory has solar projects in
          hydrogen produced from fossil fuel gas.                           the pipeline to hit 10% renewable energy.
3 STATE OF PLAY:
RENEWABLE ENERGY LEADERS AND LOSERS
2. States and territories
step up as the
Federal Government
deserts the field
Increasing global temperatures – driven This warming trend is already affecting
primarily by greenhouse gas emissions Australians. Nine of Australia’s warmest ten
from burning coal, oil and gas – are years on record have occurred since 2005
exacerbating extreme weather events (Bureau of Meteorology 2019a). In early 2019,
in Australia and globally. Worldwide, tropical Queensland experienced severe
the last five years (2014-2018) have been flooding (Bureau of Meteorology 2019d). In
the five warmest years ever recorded. spring 2019, New South Wales and Queensland
This record is part of a sharp, long-term experienced unprecedented and catastrophic
upswing in global temperatures, with bushfire conditions (Bureau of Meteorology
18 of the 19 hottest years on record all 2019b). Devastating drought conditions
occurring since 2000 (NOAA 2019). are ongoing in southeast Australia (Bureau
of Meteorology 2019c). Climate change is
increasing the frequency and severity of
extreme weather events and Australians are
suffering as a result (Climate Council 2019a).
To tackle the climate crisis effectively, we must
deeply and rapidly reduce our greenhouse
gas emissions from electricity by accelerating
the uptake of renewable energy and storage
technologies. There can be no new fossil
fuel projects. The window of opportunity is
closing, and failure to act on climate change
is placing Australian lives, our economy, andCHAPTER 02 4
STATES AND TERRITORIES STEP UP AS THE FEDERAL GOVERNMENT DESERTS THE FIELD
To tackle climate change we need to
deeply and rapidly reduce our greenhouse
gas emissions by accelerating the uptake
of renewables and storage.
our natural environment at risk. Solutions is largely due to an increase in renewable
are readily available, but we lack political energy and closure of coal-fired power
will at the federal level. State and territory stations. Nationally, renewable energy
governments have stepped in to drive the generation hit 19% in 2018 (Department of the
renewable transition, although some are Environment and Energy 2019b). However,
doing much more than others. the transition to renewables is not occurring
rapidly enough to counter rising emissions
Australia’s greenhouse gas emissions in most other sectors of the Australian
have been rising year-on-year for the economy. Australia’s electricity emissions
past five years according to the Federal must come down much faster, and other
Government’s own data. Electricity is by sectors of the economy must take action too,
far the highest emitting sector in Australia, if Australia is to meet even its weak Paris
contributing roughly 33% of Australia’s total target of 26-28% below 2005 levels by 2030.
emissions (Department of the Environment
and Energy 2019a). Electricity is also the In 2015, the Climate Change Authority (CCA)
sector where the solutions – transitioning recommended an economy-wide emissions
to renewable energy and storage – are most reduction target of 45-65% below 2005 levels
readily available and cost-effective. by 2030. This target was developed based on
scientific evidence, Australia’s national interest,
Emissions from the electricity sector and action pledged by comparable countries
have been decreasing in recent years (CCA 2015). The government rejected this
in Australia, especially in the National target and instead adopted the dismal target
Electricity Market (NEM), which includes of 26-28% by 2030. The Federal Government
the eastern states and South Australia. This does not have a target beyond 2030.Figure 2: Australia generated 19% of electricity from renewables in 2018 but must increase renewable energy much
faster if we are meet even our weak Paris target.
Since then, Australia’s emissions have ruled out extending the RET or enacting new
continued to rise. In addition, the Paris policy to accelerate the renewable transition
Agreement ramped up international ambition (The Guardian 2018), leaving Australia with a
by enshrining a goal of limiting temperature policy vacuum at the federal level.
increase to 1.5°C. As a result, an economy-
wide emissions reduction of 65% by 2030 With the exception of projects driven by
– the upper end of the CCA’s recommended state and territory renewable purchases,
target – should now be the minimum this federal policy vacuum is causing the
target. This requires deep, rapid cuts to our investment pipeline for new large-scale
emissions from electricity. renewable projects to decline sharply. In
2019, new investment has fallen to levels
Despite the need for increased ambition, the last seen four years ago when former Prime
Federal Government is getting in the way of Minister Abbott was trying to abolish the RET
progress on renewable energy. The Coalition (Clean Energy Council 2019b).
won the May 2019 federal election with no
credible climate or renewable energy policy. Organisations as diverse as the Energy Users
Until recently, the Renewable Energy Target Association of Australia (EUAA 2017), the Clean
(RET) supported uptake of renewables across Energy Council (SMH 2019c) and the states
the country, despite repeated efforts by the and territories themselves (AFR 2018) have
Coalition to dismantle it (Climate Council called on the Federal Government to settle on
2019b). In 2015, the RET was slashed to an integrated climate and energy policy.
33,000GWh of new renewable generation1 by
2020, and this target was met in September Taken together these calls suggest that the
2019 with the Cattle Hill Wind Farm in Federal Government’s failure to lead has
Tasmania (RenewEconomy 2019c). While this undermined investor confidence, driven up
is a notable milestone, the Government has prices, and most importantly, meant that the
1
Roughly 23% of total electricity demand.Figure 3: The Renewable Energy Target (RET) helped drive an increase in renewables, such as the Bald Hills wind farm
in Victoria, but the Federal Government has ruled out extending the target or enacting new policy.
electricity networks of Australia are failing Other states and territories, such as New South
to reduce emissions at their full potential. Wales, Western Australia, and the Northern
Territory, are making slow progress but could
In the absence of credible national climate be doing much more. In the face of Federal
and renewable energy policy, some state and Government inaction, state and territory
territory governments have stepped up to fill leadership is vital if Australia is to take strong
the void. States and territories such as South action on climate change.
Australia and the ACT are showing national
and even international leadership in the
transition to a renewable energy future.
The ACT is on track to hit 100% renewable States and territories
energy from 1 January 2020. This makes
it just the eighth jurisdiction in the world are driving much
with a population above 100,000 – and the
only one outside Europe – to achieve 100%
renewable electricity (The Australia Institute
needed progress in
2019b). South Australia is pioneering the
transition to a grid with majority renewable
the absence of federal
generation backed by storage, and now has
one of the highest penetrations of wind and
leadership, but some
solar PV in the world (IEA 2019). Recently,
there have been several days where South
states and territories
Australia’s demand has been entirely met
with wind and solar (OpenNEM 2019). need to do much more.7 STATE OF PLAY:
RENEWABLE ENERGY LEADERS AND LOSERS
Despite international progress in
the transition to renewable energy,
global emissions are still rising.
Globally, renewable energy now accounts Despite this progress, global emissions
for over 26% of all electricity produced, or from energy still rose in 2018 (REN21 2019).
12.9% excluding large-scale hydro (Frankfurt Countries must act much faster to accelerate
School-UNEP 2019). the transition to renewable energy and
storage if we are to limit global temperature
2018 was a strong year for renewable energy rise to 1.5°C or well below 2°C, as globally
globally, although it appears that installation agreed in the Paris Agreement.
of new renewable energy capacity may be
starting to level off after a boom in recent At least nine countries produced over 20%
years (REN21 2019). In the decade 2010-19, of their electricity from wind and solar PV
more solar capacity was installed worldwide in 2018 (REN21 2019) (see Table 1). Australia,
than any other power source, including fossil despite being the sunniest and one of the
fuels (REN21 2019). windiest countries in the world, generated
only 11% of electricity from wind and solar
in 2018 (Department of the Environment
and Energy 2019b). Although Australia was
among the top countries for new renewable
Table 1: At least nine countries produced over 20% of their capacity installed per person in 2018 (ARENA
electricity from wind and solar in 2018. Australia trails behind 2019a), we continue to trail behind the front
with 11%.
runners in renewable generation and must
transition much faster.
% wind and solar
Country electricity generation
Australia must step up and lead the transition
Denmark Over 50% to a renewable energy future. Australia’s
per person greenhouse gas emissions are
Uruguay Over 30%
among the highest in the world, behind only
Ireland Over 25%
smaller petro-states such as Qatar. Including
fossil fuel exports, Australia is the fifth
Germany Over 25% largest polluter in the world, equal to the total
emissions of Russia (Climate Analytics 2019).
Portugal Over 20%
Australia is also the third-largest fossil fuel
Spain Over 20%
exporter in the world behind only Russia
and Saudi Arabia (The Australia Institute
Greece Over 20%
2019a). Australian states and territories such
United Kingdom Over 20% as South Australia and the ACT are leading
the way in rapidly transitioning to renewable
Honduras Over 20% energy, but other states and territories need
to do much more.
Australia 11%
Source: REN21 2019.CHAPTER 03 8
STATE AND TERRITORY RENEWABLE ENERGY SCORECARD 2019
3. State and Territory
Renewable Energy
Scorecard 2019
Each year, the Climate Council tracks South Australia, the ACT and Tasmania
the relative progress of Australian continue to lead in this year’s renewable
states and territories in the transition to energy race, with South Australia in
renewable energy. States and territories first place. Victoria and Queensland are
are compared on their performance catching up, while New South Wales,
across a range of criteria: share of Western Australia and the Northern
electricity from renewable energy, Territory are lagging at the back of the
proportion of households with rooftop pack. The Northern Territory is once
solar, large-scale wind and solar again in last place, despite improving on
capacity per capita, and targets and some metrics this year.
policies to support the transition.
Figure 4: Lal Lal Wind Farm in Victoria. States and territories are scored on share of renewable energy, households with
rooftop solar, large-scale wind and solar capacity per capita, and targets or policies to support the transition.9 STATE OF PLAY:
RENEWABLE ENERGY LEADERS AND LOSERS
3.1 Percentage renewable
electricity
Tasmania, the ACT, and South Australia The proportion of electricity generated from
continue their strong lead over the other renewable energy increased in all states
states and territories on share of renewable and territories in 2018. The proportion of
energy. All three now source over 50% of wind and solar energy increased in all states
their electricity from renewable energy and territories except Tasmania, where
(Table 2). the increase in renewables was due to an
increase in hydro generation.
Over 50% of electricity used in Tasmania,
the ACT, and South Australia is generated
from renewable energy.
Table 2: State and territory share of renewable electricity generation. Tasmania continues to lead with 94.6%, while the
Northern Territory is once again in last place with just 4%.
% of electricity generated
from renewables in 2018 (inc. % wind and solar electricity Change in wind and solar
State/Territory hydro) generation in 2018 generation from 2017
TAS 94.6 10.2 1.0
ACT 54.1 1 51.0 7.9
SA 51.2 50.5 7.8
VIC 17.3 13.5 3.2
NSW 17.3 8.9 3.3
QLD 8.8 5.6 1.9
WA 8.2 7.3 0.8
NT 4.0 3.8 0.8
Source: Department of the Environment and Energy 2019b.
Figure supplied by the ACT Government.
1
Note: Federal Government energy statistics are used here to provide a consistent means of comparing the states and
territories. Individual states and territories may publish different figures based on different assumptions and data sources. For
example, Victoria reports a higher figure for their state (20.5%) than Federal Government figures, as the Victorian Government
includes the Murray hydroelectric station (located in NSW, but in Victoria’s National Electricity Market region) in Victoria’s
total. The ACT is an exception, as the Federal Government does not report separately on the ACT and the ACT sources
renewable energy from outside its geography to meet its target.CHAPTER 03 10
STATE AND TERRITORY RENEWABLE ENERGY SCORECARD 2019
Figure 5: Some states and territories are leading the way in the transition to renewable energy, such as the ACT, Tasmania
and South Australia, while others have a long way to catch up.
TASMANIA, ACT AND SOUTH AUSTRALIA
LEADING THE CHARGE
ON RENEWABLE ENERGY
State / Territory % of electricity generated from renewables in 2018 (inc. hydro)
TAS 10.2% 94.6%
ACT 51.0% 54.1%
SA 50.5% 51.2%
VIC 13.5% 17.3% % of electricity generated from renewables in 2018
(inc. hydro)
% of electricity generated from wind and solar in 2018
NSW 8.9% 17.3%
QLD 5.6% 8.8%
ACT
On track for 100% renewable energy by 2020
WA 7.3% 8.2%
TAS
NT 3.8% 4% On track for 100% renewable energy by 2022
Overall, Australia generated 19% of electricity from renewables in 2018. 11% was from wind and solar.11 STATE OF PLAY:
RENEWABLE ENERGY LEADERS AND LOSERS
BOX 1: MANY ROUTES TO A RENEWABLE FUTURE
While three front runners – Tasmania, the ACT the New South Wales section of the NEM. The
and South Australia – have now achieved over ACT will hit 100% renewables thanks to contracts
50% renewables (see Figure 5), they have all taken with projects located across the NEM. The ACT
a different approach to reaching this milestone. used reverse auctions to buy 640MW of renewable
energy – enough to meet 100% of its annual
Tasmania tops the list with nearly 95% demand – at the lowest price, to be supplied into
renewable energy because of its high the grid wherever it is generated.
penetration of hydro-electric dams. Most of
these dams were built before 1980, but Tasmania South Australia achieved 51% renewable energy
has made some renewable progress recently in 2018 by building significant large-scale wind
with the installation of new wind farms. While and solar resources. South Australia has one of the
hydro is a form of renewable energy, it can be highest grid penetrations of wind and solar PV in
unreliable, as it is highly vulnerable to changes the world (IEA 2019). The state is now leading the
in rainfall and water availability. The state is way in solving the physical supply and demand
on track for 100% renewables by 2022 and has challenges of a grid with a high share of wind
ambitions to become the Battery of the Nation. and solar, including storage, dispatchability, and
Tasmania exports energy to Victoria via the frequency control. For example, South Australia is
Basslink cable and is reliant on imports during building and integrating storage projects such as
the warmer months. the world’s largest grid scale battery, synchronous
condensers, and a new interconnector to New
The ACT achieved 54% renewable energy in South Wales. It is also building a renewable
2018, but is on track for 100% from 2020 using hydrogen industry to turn surplus renewable
an innovative approach. The ACT has minimal power into stored hydrogen for transport fuels
generation infrastructure within its small and to help balance the grid.
physical geography and sources electricity fromCHAPTER 03 12
STATE AND TERRITORY RENEWABLE ENERGY SCORECARD 2019
3.2 Wind and solar
capacity per person
2018 saw a boom in large-scale wind and uptake of renewables and storage, in the
solar projects in Australia, eclipsing previous progress reflected here and into the future.
records for investment and installed capacity.
Investment in large-scale renewables hit The ACT and South Australia are way
$20 billion in 2018, with 14,500MW (or ahead of the other states and territories on
14.5GW) of new renewable generation under installed large-scale wind and solar capacity
construction or financially committed by the per capita, with Tasmania coming in third
end of the year (Clean Energy Council 2019). (see Table 3). Western Australia, New South
Wales and the Northern Territory are once
This is important progress, but follows again bringing up the rear.
a major drop in investment in 2014 and
2015 due to policy uncertainty from the Victoria has now overtaken South Australia
Federal Government (Climate Council 2018). as the state with the largest total capacity
Federally, we are again entering a policy of installed large-scale wind and solar
void, as the government has ruled out (2,223MW), although South Australia
extending the RET or enacting new policy (2,190MW) and New South Wales (2,014MW)
to drive the transition to renewables. As a are not too far behind (see Table 3). The
result, investment in new renewables has Northern Territory continues to rank last in
started to decline sharply in 2019 (Clean terms of both per capita and total installed
Energy Council 2019b). State and territory wind and solar capacity.
governments play a critical role in driving
Table 3: State and territory large-scale solar and wind capacity per capita in March 2019 (small-scale solar excluded).
Wind and solar Wind and solar
installed capacity Population capacity per person Change (kW) from
State/Territory (MW)1 (in millions)2 (kW) last year’s report
ACT 5423 0.426 1.27 0.17
SA 2,190 1.749 1.25 0.19
TAS 319 0.533 0.60 0.11
QLD 1,938 5.077 0.38 0.31
VIC 2,223 6.566 0.34 0.08
WA 720 2.616 0.28 0.09
NSW 2,014 8.071 0.25 0.03
NT 29 0.246 0.12 0.06
Source: 1CER 2019a; CER 2019b. 2ABS 2019. 3Figure supplied by the ACT Government.
Note: This is the latest data, including January to March of 2019, whereas the renewable electricity generation data in the
previous section is from 2018 (the most recent data for that metric).Figure 6: Ross River Solar Farm in Townsville. Queensland wins the ‘Most Improved’ Award for the most substantial increase
in per capita wind and solar capacity from last year’s report.
Queensland wins the ‘Most Improved’ territories have not (CER 2019b). Victoria has
Award, eclipsing the other states and installed the most (604MW) in total capacity
territories in its increase in per capita wind terms, but on a per capita basis, Tasmania
and solar capacity from last year’s report (148MW or 0.28kW per capita) and South
(see Table 3). Nearly half, or 17 of the 38, Australia (237MW or 0.14kW per capita) top
large-scale renewable energy projects the list.
completed across Australia in 2018 were in
Queensland (Clean Energy Council 2019a). Victoria, Western Australia, Tasmania,
This moves Queensland up three rankings to New South Wales and Queensland all have
fourth place this year on the wind and solar substantial large-scale wind and solar
capacity criteria. projects at the ‘committed’ stage, so should
increase their capacity in the near future2 .
Wind and solar capacity figures should This includes 2,098MW in Victoria, the most
continue to rise over 2019 for all states of any state and territory in both total and per
and territories, and the ACT will hit person terms. The Northern Territory and
100% renewable energy from 2020 (ACT South Australia both have large-scale wind
Government 2019b). All states have installed and solar projects of significant per capita
further large-scale wind and solar capacity capacity at the ‘probable’ phase3.
between April and September 2019, while the
All states and territories have substantial
wind and solar projects in the pipeline
– except the ACT, which will hit 100%
renewable energy from 2020.
2
Committed projects are defined by the Clean Energy Regulator (CER) as ‘projects that have received all development approvals
and reached a final investment decision according to the commercial understanding of the term’.
3
Probable projects are defined by the CER as projects that ‘have a high degree of confidence that they will proceed following a
public announcement of a power purchase agreement with a strong counter party or other evidence of funding’.CHAPTER 03 14
STATE AND TERRITORY RENEWABLE ENERGY SCORECARD 2019
3.3 Proportion of households
with rooftop solar
The rapid rise of rooftop solar has continued roughly one in five - with rooftop solar
since last year’s report, with Australian (Clean Energy Council 2019a). The average
households and businesses continuing to size of installed rooftop solar systems
break records for rooftop solar installation. also continues to increase, as does the
The share of households with rooftop solar rate of battery storage installation, as the
has increased in all states and territories over technology improves and costs decrease
the last year. In 2018, 1.55GW of rooftop solar (Australian Energy Council 2019).
was installed across Australia, a significant
increase from the previous year (Clean Queensland continues to lead on rooftop
Energy Council 2019a). 2019 looks set to once solar. Over one-third of all households
again surpass these records, driven in part in both Queensland (35.7%) and South
by favourable policies from state and territory Australia (35.0%) now have rooftop solar (see
governments. Table 4). The Northern Territory improved
the most over the past year, hitting 18.1% in
Australia leads the world in the proportion October 2019, up from 13.8% of households
of households with rooftop solar (APVI with rooftop solar in last year’s report. This
2018). As at June 2019, total installed moves the Northern Territory up from last
capacity of rooftop solar was close to 9.0GW, place to fifth this year.
representing over 2 million households -
Over one-third of households in both
Queensland and South Australia now
have rooftop solar.15 STATE OF PLAY:
RENEWABLE ENERGY LEADERS AND LOSERS
Table 4: Share of households with rooftop solar by state and territory. Queensland and South Australia continue to lead.
Number of postcodes where
over 50% of households have
% of households with rooftop solar (excluding
rooftop solar by state and postcodes with under 1,000
State territory (October 2019) Increase from last year’s report households)
QLD 35.7 2.8 33
SA 35.0 2.7 11
WA 28.8 2.1 -
NSW 20.4 2.8 3
NT 18.1 4.3 -
VIC 17.9 2.0 -
ACT 16.1 1.9 -
TAS 15.1 1.3 -
Source: APVI 2019.
Note: APVI statistics are used here to provide a consistent means of comparing the states and territories. Individual states and
territories may publish different figures based on different assumptions and data sources.
Figure 7: Australia leads
the world in rooftop solar.
Roughly one in five Australian
households have rooftop solar.CHAPTER 03 16
STATE AND TERRITORY RENEWABLE ENERGY SCORECARD 2019
There are now 47 Australian suburbs where
over 50% of households have installed
There are now 47
rooftop solar, a significant increase from 26
in last year’s report (APVI 2019). Queensland
Australian suburbs
continues to dominate, with an impressive
33 of these solar suburbs. Of the remaining where over half
suburbs, 11 are in South Australia and 3 in
New South Wales (see Table 4). Table 5 lists of all homes have
the top postcode in each state or territory for
rooftop solar installation. rooftop solar.
Table 5: The top postcode in each state or territory for rooftop solar installation. Only suburbs with more than 1,000 dwellings
are included.
Rooftop solar installations % of households with
State Postcode Suburbs (October 2019) rooftop solar
Queensland 4516 Elimbah 974 74.2%
South 5117 Angle Vale 721 66.8%
Australia
New South 2390 Narrabri 2175 59.1%
Wales
Western 6083 Gidgegannup, Morangup 684 49.5%
Australia
Victoria 3678 Wangaratta 1150 41.2%
NT 836 Girraween, Herbert, 842 29.2%
Humpty Doo
Tasmania 7277 Bridgenorth, Grindelwald, 616 25.4%
Legana, Rosevears
ACT 2904 Fadden, Gowrie, Monash 1121 22.4%
Source: APVI 201917 STATE OF PLAY:
RENEWABLE ENERGY LEADERS AND LOSERS
POSTCODES WITH
50% OR HIGHER
ROOFTOP SOLAR
47 suburbs in total
33 in Queensland
11 in South Australia
3 in New South Wales
Postcodes with over 50% Rooftop Solar
4516 QLD 4125 QLD 4518 QLD 5351 SA 5600 SA
5117 SA 4512 QLD 4555 QLD 4275 QLD 4519 QLD
4553 QLD 4563 QLD 2400 NSW 5153 SA 5212 SA
4280 QLD 4228 QLD 4514 QLD 4568 QLD 5330 SA
4270 QLD 4156 QLD 4306 QLD 5501 SA 4035 QLD
4561 QLD 5157 SA 4562 QLD 4521 QLD 2388 NSW
4520 QLD 4312 QLD 4505 QLD 4552 QLD 4159 QLD
4124 QLD 5171 SA 4037 QLD 4022 QLD
5172 SA 5254 SA 4341 QLD 4165 QLD
2390 NSW 4511 QLD 4504 QLD 4164 QLD
Figure 9: There are now 47 Australian suburbs where over 50% of households have installed rooftop solar. 33 of these suburbs are in
Queensland.CHAPTER 03 18
STATE AND TERRITORY RENEWABLE ENERGY SCORECARD 2019
3.4 Renewable energy and
emissions reduction
targets and policies
State and territory governments are stepping (Government of Western Australia 2019b)
up to fill the void created by the Federal and the Northern Territory announced
Government’s lack of credible climate and a draft net zero emissions by 2050 target
renewable energy policy. All states and in September 2019 (Northern Territory
territories now have net zero emissions Government 2019b). If the Northern
targets by 2050 at the latest, at least in draft Territory’s target is officially adopted
form (see Table 6 and Figure 10). Western following public consultation, Australia will
Australia committed to an aspirational target have a de facto target of net zero emissions
of net zero emissions by 2050 in August 2019 by 2050 even in the absence of federal
leadership and ambition.
All states and territories now have a
target of net zero emissions by 2050
at the latest, although the Northern
Territory’s target is still in draft form.
Table 6: State and territory renewable energy targets and net zero emissions targets. All states and territories now have net
zero emissions targets, at least in draft form.
ACT1 VIC2 QLD3 TAS4 NT5 SA6 NSW 7 WA8
Renewable 100% by 25% by 50% by 100% by 50% by 100% in None None
electricity 2020 2020; 2030 2022 2030 the 2030s
target 40% by
2025;
50% by
2030
Net zero By 2045 By 2050 By 2050 By 2050 By 2050 By 2050 By 2050 By 2050
emissions (Draft)
target
Source: 1ACT Government 2019a; ACT Government 2019b. 2Premier of Victoria 2019; Victorian Government 2019a.
3
Queensland Government 2017. 4Tasmanian Government 2017a; Tasmanian Government 2017b. 5Northern Territory
Government 2019b; Northern Territory Government 2019c. 6Government of South Australia 2019d; Government of South
Australia 2019b. 7SMH 2019b. 8Government of Western Australia 2019f.19 STATE OF PLAY:
RENEWABLE ENERGY LEADERS AND LOSERS
Victoria and the ACT have legislated With the exception of New South Wales and
net zero emissions targets, while South Western Australia, all states and territories
Australia and Tasmania have committed also have renewable energy targets. These
to net zero targets but legislated less targets range in ambition from 100%
ambitious targets. New South Wales, renewable electricity by 2020 in the ACT to
Queensland, Western Australia and the 50% by 2030 in Victoria, Queensland, and the
Northern Territory all have aspirational Northern Territory (see Table 6 and Figure
net zero emissions targets. ACT is the 10). Some states and territories, such as the
most ambitious, committing to net zero ACT and Tasmania, are already on track to
emissions by 2045, whereas all other states achieve these targets, while others, such as
and territories have committed to 2050. Queensland and the Northern Territory, still
have to put policies and projects in place to
achieve their targets.
All states and territories
except New South Wales
and Western Australia have
a renewable energy target.CHAPTER 03 20
STATE AND TERRITORY RENEWABLE ENERGY SCORECARD 2019
STATES & TERRITORIES
CO2
RENEWABLE ENERGY &
NET ZERO EMISSIONS TARGETS
NT QLD
Renewable Electricity Target Renewable Electricity Target
50% by 2030 50% by 2030
Net Zero Emissions Target Net Zero Emissions Target
By 2050 By 2050
(Draft target released Sept 2019)
WA
Renewable Electricity Target NSW
None
Renewable Electricity Target
Net Zero Emissions Target None
By 2050
(Aspiration declared Aug 2019) Net Zero Emissions Target
By 2050
FEDERAL GOVERNMENT
Renewable Electricity Target
None
Net Zero Emissions Target
None
ACT
SA Renewable Electricity Target
100% by 2020
Renewable Electricity Target
100% by 2030 Net Zero Emissions Target
VIC By 2045
Net Zero Emissions Target
By 2050 Renewable Electricity Target
50% by 2030
TAS
Net Zero Emissions Target Renewable Electricity Target
By 2050 100% by 2022
Net Zero Emissions Target
By 2050
Figure 10: All states and territories now have a net zero emissions target, and all except New South Wales and Western Australia have a
renewable energy target. The Federal Government now has neither.21 STATE OF PLAY:
RENEWABLE ENERGY LEADERS AND LOSERS
4. The leaderboard:
State and territory
by renewable
energy progress
1ST PLACE: SOUTH AUSTRALIA
2ND PLACE: ACT
3RD PLACE: TASMANIA
4TH PLACE: VICTORIA
4
5TH PLACE: QUEENSLAND
5
6TH PLACE: NEW SOUTH WALES
6
7TH PLACE: WESTERN AUSTRALIA
7
8TH PLACE: NORTHERN TERRITORY
8CHAPTER 04 22
THE LEADERBOARD: STATE AND TERRITORY BY RENEWABLE ENERGY PROGRESS
4.1 Front runners
SOUTH AUSTRALIA FAST FACTS: SA
South Australia has taken the lead
in this year’s state and territory Percentage renewable power:
renewables race, after consistently South Australia generated 51.2% of its
placing as a front runner in every electricity from renewable energy in 2018, a
Climate Council scorecard. South substantial jump from 43.4% in 20171.
Australia ranks in the top three for
every metric, coming second for Households:
both proportion of households with South Australia now has over one-
rooftop solar and large-scale wind third of households with rooftop solar
and solar capacity per person. On the (35.0%), putting it in second place behind
latter metric, South Australia and the Queensland2 .
ACT (in first place) are way ahead of
the other states and territories. South Policy
Australia has more than double the per › South Australia has committed to a target
person capacity of Tasmania, which of net zero emissions by 2050. The state
comes in third. also has a legislated target to reduce
greenhouse gas emissions by at least 60%
Although South Australia comes third below 1990 levels by 20503.
for share of electricity generated from
renewables, the state is a global leader › South Australia’s Liberal state government
in transitioning to a grid with high has an aspirational target for net 100%
variable renewable energy. South renewable energy in the 2030s4.
Australia on average sources over 50%
of its electricity from wind and solar › In September 2019, South Australia
backed by storage, one of the highest launched its Hydrogen Action Plan, to
shares of grid-integrated wind and identify optimal locations for renewable
solar in the world (IEA 2019). There hydrogen production and scale up
have been several days recently where production5.
South Australia’s demand has been
entirely met with wind and solar › The South Australian Government
(OpenNEM 2019). is seeking to expedite Project
EnergyConnect, a new SA-NSW
In contrast, Tasmania (in first place) interconnector. Several large-scale
has a high percentage of hydro, while renewable projects rely on this
the ACT uses contracts with renewable interconnector to go ahead6.
generators located across the NEM
to hit its renewable targets. Box 1
in Section 3 gives a more detailed Source: 1Department of the Environment and Energy
2019b. 2APVI 2019. 3Government of South Australia 2019a;
description of the different approach Government of South Australia 2019b. 4Government of
taken by each. South Australia 2019d. 5Government of South Australia
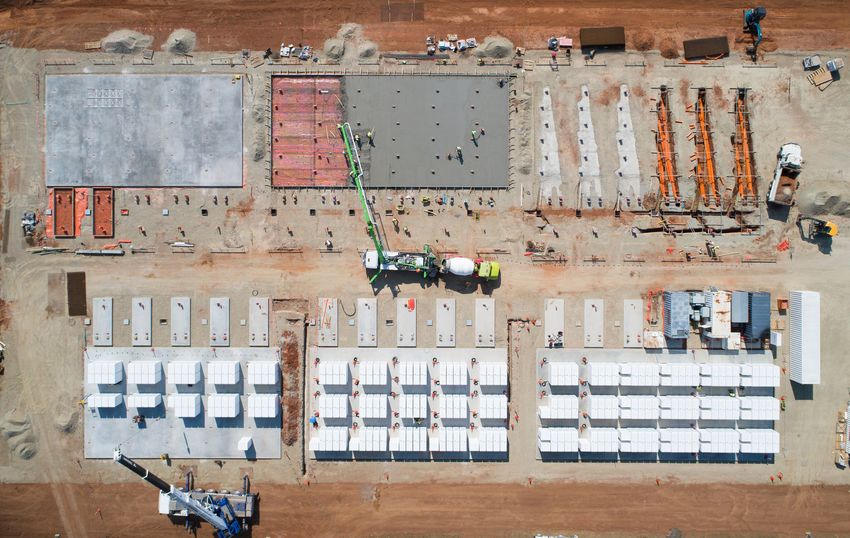
2019c. 6Clean Energy Council 2019a.Figure 11: South Australia is balancing the complexities of a grid with high wind and solar penetration with storage projects,
including the Tesla big battery at the Hornsdale Power Reserve.
South Australia has committed to achieving South Australia’s current Liberal state
net zero emissions by 2050. However, this government refused to commit to the
was announced as part of the previous previous government’s renewable energy
Labor state government’s Climate Change target during the March 2018 state election.
Strategy and the current Liberal state Since then, however, South Australia has
government has requested the Premier’s continued its renewable energy boom and
Climate Change Council develop a new the government has recently announced
climate change strategy (Government of it is aiming for net 100% renewables in
South Australia 2019b). The state also has the 2030s (Government of South Australia
a legislated emissions reduction target to 2019d). Although vague, this is one of the
reduce greenhouse gas emissions by at least most ambitious renewable energy targets
60% below 1990 levels by 2050 (Government amongst the states and territories.
of South Australia 2019a).
South Australia now generates
more than half its electricity
from wind and solar.Figure 12: South Australia generated 51.2% of electricity from renewable energy in 2018, including from projects such as the
132MW North Brown Hill Wind Farm.
South Australia has been investing heavily Several large-scale renewable projects –
in household battery storage and is now including the later stages of Neoen’s Burra
home to Australia’s largest ‘virtual power project – rely on the proposed new SA-NSW
plant’, coordinating 1,000 batteries in a interconnector, Project EnergyConnect, going
5MW scheme (One Step Off the Grid 2019b). ahead. The South Australian Government is
In a virtual power plant, the operation of a seeking to expedite the interconnector and
large number of solar and battery storage has committed $200 million to the project
systems is controlled through software (Clean Energy Council 2019a). Project
by an electricity retailer. This enables the EnergyConnect has also been granted Major
generation, charge and discharge of the Project Status, which recognises national
solar panels and batteries to be coordinated strategic significance.
so that, together, the systems effectively
operate as a power plant. The state government recently released its
Hydrogen Action Plan, which outlines its
South Australia has significant large-scale vision to make South Australia a leader in
wind, solar, and storage projects under renewable hydrogen. The plan includes
construction or in the planning phase. For identifying locations for production and
example, Neoen recently announced plans to export infrastructure, as well as action needed
build a record-breaking project in Burra that in areas such as investment, regulation
would involve 1,200MW of wind, 600MW of and trade to scale-up production for export
solar and 900MW of battery storage at full and domestic consumption (Government
capacity. This would make it the largest wind of South Australia 2019c). While many state
farm in Australia and nine times the power and territory governments have indicated an
rating of South Australia’s first big battery at interest in renewable hydrogen, this is one of
Hornsdale Wind Farm (The Advertiser 2019). the most detailed plans released so far.25 STATE OF PLAY:
RENEWABLE ENERGY LEADERS AND LOSERS
BOX 2: HYDROGEN ENERGY
Hydrogen can be produced using either Hydrogen is emerging as a global market.
renewable energy or fossil fuels. Renewable Australia has the opportunity to become a leading
hydrogen uses renewable electricity to produce hydrogen exporter, creating jobs and local
hydrogen by splitting water molecules into investment. While Australia has boundless space
hydrogen and oxygen, with no resulting and remarkable wind and solar reserves, many of
greenhouse gas emissions. our neighbours in the region do not. Hydrogen
exports would allow these countries to meet their
Hydrogen offers considerable advantages. own energy needs with Australian wind and sun.
Once produced, hydrogen can be stored and
transported easily, creating a wide array of Renewable Hydrogen production and export
potential applications, including in sectors could significantly reduce greenhouse gas
where decarbonisation is otherwise difficult. emissions both domestically and overseas and
This includes replacing metallurgical coal in the boost Australia’s economy. Australia’s massive
production of steel, as well providing a lightweight renewable energy resources mean Australia could
fuel source for large aircraft. Hydrogen can also become a superpower of the zero-carbon world,
be used as temporary storage for the electricity all while shoring up our own grid.
network, helping the grid ride the peaks and
troughs of wind and solar generation.CHAPTER 04 26
THE LEADERBOARD: STATE AND TERRITORY BY RENEWABLE ENERGY PROGRESS
AUSTRALIAN CAPITAL FAST FACTS: ACT
TERRITORY
The ACT is in second place in this Percentage renewable power:
year’s state and territory renewables The ACT consumed 54.1% renewable
race, falling from the top spot in last electricity in 2018, up from 46.2% in 2017.
year’s report. The ACT ranks in the top The ACT will hit 100% renewable energy
two for all scorecard metrics except from 1 January 20201.
rooftop solar, where it is second last.
Households:
The ACT is currently second for 16.1% of ACT households have rooftop solar,
renewable energy behind Tasmania, putting the ACT second last2 .
but wins an ‘Honourable Mention’
for being on track to source 100% Policy
of its electricity from renewable › On track to hit 100% renewable energy
energy from 1 January 2020. target from 2020, with the last of its major
The ACT’s final major renewable projects starting to deliver on its contract
generator, the Hornsdale 3 wind from 1 October 20193.
farm in South Australia, began
delivering on its contract from 1 › The ACT is now shifting focus to other
October 2019. The territory now has sources of emissions, including transport
all necessary infrastructure in place and phasing out household gas use4.
for 100% renewable electricity (ACT
Government 2019b). › Released the ACT Climate Change
Strategy 2019-2025, which lays out a plan
This is a remarkable achievement to reach net zero emissions by 20454.
and makes the ACT just the eighth
jurisdiction in the world with a › The ACT Government has announced
population above 100,000 – and a new reverse auction for up to 250MW
the only one outside of Europe – to of new renewable energy generation
achieve 100% renewable electricity with 20MW/40MWh of battery storage
(The Australia Institute 2019b). to ‘future proof’ its 100% renewables
Box 1 in Section 3 provides more achievement5.
information on the ACT’s approach
to achieving this milestone, compared
to the other front runners (Tasmania Source: 1Figure supplied by the ACT Government. 2APVI
2019. 3ACT Government 2019b. 4ACT Government 2019a.
and South Australia). 5
RenewEconomy 2019f.27 STATE OF PLAY:
RENEWABLE ENERGY LEADERS AND LOSERS
The ACT wins an ‘Honourable Mention’
for being on track to hit 100% renewable
energy from 1 January 2020.
Now that it is on track for 100% renewable battery storage. The battery storage will be
energy, the ACT Government has announced located within the ACT to support the local
a new reverse auction to ‘future proof’ electricity grid (RenewEconomy 2019d).
this achievement. This is important as the
population grows and the economy shifts The ACT recently released its Climate
towards electric vehicles and phasing out Change Strategy 2019-2025, which lays out a
household gas use. The new reverse auction vision for achieving its legislated target of net
will run from November 2019 to February zero emissions by 2045. Within the net zero
2020 and will contract up to 200MW of target, the government has committed to
new wind-equivalent renewable energy interim targets of 50-60% below 1990 levels
generation (or 250MW of solar), which by 2025, 65-75% by 2030 and 90-95% by 2040
must be delivered with 20MW/40MWh of (ACT Government 2019a).
Figure 13: The ACT is on track to achieve 100% renewable energy from 2020, with the third stage of the Hornsdale wind farm
in South Australia (pictured) delivering on its contract from 1 October 2019.CHAPTER 04 28
THE LEADERBOARD: STATE AND TERRITORY BY RENEWABLE ENERGY PROGRESS
The ACT is set to become the first jurisdiction
outside of Europe, and only the eighth in the
world, to achieve 100% renewable electricity.
The ACT is one of the only states and BOX 3: THE NEXT STEP: 100%+ RENEWABLES
territories with a truly science-based
emissions reduction target. The ACT
used a ‘carbon budget’ approach4, When considering the transition to a renewable future,
setting its targets in line with action state and territory governments should plan not only
required to keep warming below 2°C for meeting 100% of today’s electricity demand, but
(ACT Government 2019a). While the ACT also for meeting future demand.
should increase this ambition over time –
the Paris Agreement commits Australia to Electricity generation from the grid is responsible for
pursuing efforts to keep warming below half of Australia’s greenhouse gas emissions from
1.5°C – this science-based approach energy and one third of Australia’s total emissions
to climate policy formation is a step in (Department of Environment and Energy 2019b). To
the right direction. The strategy largely deal with climate change adequately, all fossil fuel use
focuses on transport and gas, which will must reach zero as soon as possible.
be the two largest sources of emissions
from 2020 when the territory achieves Non-electricity uses of fossil fuels are diverse. Most,
100% renewable electricity. however, can be electrified and powered by renewables
either directly (such as installing solar to replace
industrial-scale fuel oil or diesel generators), or through
storage (such as conventional batteries or hydrogen
fuel cells for road transport).
Batteries and hydrogen fuel cells will drastically
increase demand on the electricity network. State and
territory governments must plan for these increases in
order to achieve and sustain 100% renewable electricity
in the long term.
4
The carbon budget is a scientifically robust approach to considering the amount of greenhouse gas emissions that can be
‘spent’ without causing the Earth to exceed a given temperature target. The budget is based on the relatively linear relationship
between carbon dioxide concentrations and temperature rise.You can also read