Statistical Data on Switzerland 2021 - Admin.ch
←
→
Page content transcription
If your browser does not render page correctly, please read the page content below
00
Statistical base and overviews

025-2100

Statistical Data
on Switzerland 2021
Federal Statistical Office                              Contents
Espace de l’Europe 10
CH-2010 Neuchâtel                                       Foreword                         3

                                                        Population                       4
Information:
Telephone +41 58 463 60 11
info@bfs.admin.ch
                                                        Territory and Environment        9

Ordering of publications:                               Employment and Income           11
Telephone +41 58 463 60 60
www.statistics.admin.ch
                                                        National Economy                14
Legend:
Three dots (...) instead of a figure means that the     Prices                          16
data has not (yet) been gathered or calculated.
A dash (–) instead of a figure is used for the value
absolute zero.                                          Industry and Services           17
A figure indicated with a superior “p” means that
this figure is provisional.                             Agriculture and Forestry        20
A number between square brackets “[ ]” represents
a coefficient of variation greater than 5% (statisti-
cally unreliable numeric value).                        Energy                          21

Abbreviations for names of cantons:                     Construction and Housing        22
These are explained in the table on page 4.

Rounded figures:                                        Tourism                         23
In general, figures are rounded up or down, which
may cause the sum of rounded figures to differ          Mobility and Transport          24
from the end total.

Sources:                                                Switzerland and Europe          26
Statistical results are usually presented here
without reference to sources. Such information          Banks, Insurance                28
is extensively presented in our portal “Statistics
Switzerland”
www.statistics.admin.ch                                 Social Security                 29

Published by:                                           Health                          32
Federal Statistical Office
Section Dissemination and Publications
March 2021. Published in German, French, Italian,       Education and Science           34
Romansh and English.
                                                        Culture, Media and              37
Editing:
Etienne Burnier
                                                        Information Society
Graphics, Layout:
Daniel von Burg, Etienne Burnier                        Politics                        39
Maps:
ThemaKart (FSO)
Translation:
                                                        Public Administration           41
By the FSO Linguistic Services                          and Finance
Cover:
Netthoevel & Gaberthüel, Biel;                          Crime and Criminal Justice      43
Photography: © prasit – Stock.adobe.com
Design concept:
Roland Hirter, Berne                                    Economic and Social Situation   45
Order number:                                           of the Population
025-2100
ISBN:
978-3-303-00665-8
                                                        Sustainable Development         49

                                                        Regional Disparities            50

                                                        Switzerland and its Cantons     51
Dear readers,
Foreword
This new edition of Statistical Data on Switzerland, the FSO’s flagship
publication available in five languages (French, German, Italian, Ro-
mansh and English) pursues its mission to inform a wide audience on the
latest trends and data concerning the main topics of federal statistics.
Notable changes for the current edition include transport infrastructure
in the mobility and transport chapter, which now presents data on
roads and motorways instead of on national and cantonal roads as it
did previously.
The culture, media and information society chapter continues to evolve
with a text on cultural behaviour and another on the cultural economy.
Furthermore, it is also interesting to note that film and cinema in Swit-
zerland changed significantly between the very start of the millennium
and 2019. Swiss cinema continues to grow in importance. The share
of Swiss films screened in our country has risen from 5 to 15% in the
last fifteen years.
In addition to its core mission to produce and disseminate high quality
statistical information while focusing on the multiple use of existing
data to ease the burden on data providers, the FSO is also facing new
challenges. The first involves the actual data that need to become more
visible and accessible. The second entails exploring the potential of data
by complementing statistical methods with innovative methods in data
science using artificial intelligence principles.
2020 has been a difficult year throughout the world due to the pan-
demic. The FSO has adapted to the situation by ensuring the production
of central statistics for our country while responding to a particularly
intense demand for statistical information from the media and various
audiences. Meanwhile, the next steps have been defined in the multi-
year programme for federal statistics for 2020–2023 and in the new
operational strategy.
You can also visit our website www.statistique.admin.ch to find all
information across the areas of federal statistics.
I hope you find the results an interesting read.
Georges-Simon Ulrich
Director General
Federal Statistical Office (FSO)
Neuchâtel, March 2021
FSO, Statistical Data on Switzerland 2021 3Population Permanent resident population by canton, 2019
At year-end Total Foreigners Urban Density Population growth
in ’000 in % in % km2 2010 – 2019 in %
Switzerland 8 606.0 25.3 84.8 215.2 9.4
Zurich (ZH) 1 539.3 27.1 99.3 926.8 12.1
Bern (BE) 1 039.5 16.6 74.7 178.0 6.1
Lucerne (LU) 413.1 18.8 63.9 289.1 9.4
Uri (UR) 36.7 12.6 88.6 34.7 3.6
Schwyz (SZ) 160.5 21.9 82.1 188.5 9.4
Obwalden (OW) 37.9 14.7 27.6 78.9 6.6
Nidwalden (NW) 43.1 14.8 50.5 178.5 5.0
Glarus (GL) 40.6 24.2 76.7 59.6 5.1
Zug (ZG) 127.6 28.3 100.0 616.2 12.9
Fribourg (FR) 321.8 22.8 74.8 202.0 15.5
Solothurn (SO) 275.2 22.9 85.9 348.2 7.8
Basel-Stadt (BS) 195.8 36.6 100.0 5 300.2 5.9
Basel-Landschaft (BL) 289.5 23.1 97.6 559.2 5.5
Schaffhausen (SH) 82.3 26.1 89.7 276.2 7.8
Appenzell A. Rh. (AR) 55.4 16.5 76.6 228.3 4.6
Appenzell I. Rh. (AI) 16.1 11.3 0.0 93.5 2.8
St. Gallen (SG) 510.7 24.4 82.4 261.8 6.6
Graubünden (GR) 199.0 18.8 44.9 28.0 3.3
Aargau (AG) 685.8 25.3 85.0 491.6 12.2
Thurgau (TG) 279.5 25.2 67.0 323.9 12.5
Ticino (TI) 351.5 27.6 92.8 128.2 5.3
Vaud (VD) 805.1 33.0 89.6 285.4 12.9
Valais (VS) 345.5 22.6 78.9 66.3 10.5
Neuchâtel (NE) 176.5 25.3 87.8 246.3 2.6
Geneva (GE) 504.1 40.0 100.0 2 050.8 10.1
Jura (JU) 73.6 14.7 53.7 87.8 5.1
Permanent resident population in the largest cities, 2019
City Urban agglomeration
in ’000 Population growth in ’000 Population growth
2010 – 2019 in % 2010 – 2019 in %
Zurich 420.2 12.7 1 401.8 12.2
Geneva 204.0 8.8 603.2 10.7
Basel 173.2 6.1 552.9 6.1
Lausanne 139.4 9.1 427.9 12.8
Bern 134.6 8.2 422.1 7.6
Winterthur 113.2 11.7 145.1 11.2
Lucerne 82.3 6.2 233.5 8.2
St. Gallen 76.1 4.3 167.6 4.4
Lugano 62.6 3.9 150.2 6.3
Biel 55.6 8.6 107.8 8.4
The population is mostly urban
Today (2019) 84.8% of the population live in areas with an urban
character (urban cores and areas under the influence of urban centres).
Nearly half of the population live in one of Switzerland›s five largest
agglomerations (Zurich. Basel. Geneva. Bern and Lausanne).
In 2019 population growth in areas with an urban character was
more marked than that in areas beyond the influence of urban centres
(2019: +0.8% compared with +0.5%).
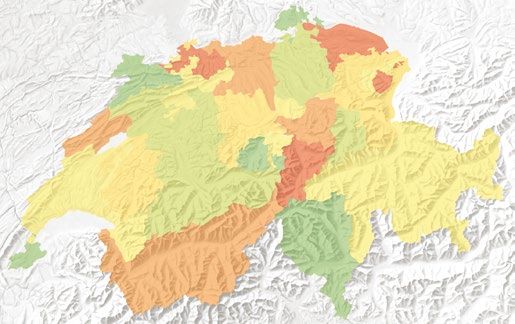
4 FSO, Statistical Data on Switzerland 2021Population Population growth, 2010 – 2019
by district SH
BS
TG
BL ZH
JU AG AR
SO SG AI
ZG
LU
SZ GL
NE
NW
BE
OW UR
FR
GR
VD
TI
GE VS
Changes of the permanent resident population, in % CH: +9.4
≤ -2.5 -2.4 – -0.1 0.0 – 4.9 5.0 – 9.9 10.0 – 14.9 ≥ 15.0
Age structure of the population Number of persons in ’000
Age
100
Men Women
1900 90 1900
2019 80 2019
70
60
50
40
30
20
10
0
60 50 40 30 20 10 0 0 10 20 30 40 50 60
Ageing society
During the course of the 20th century. the proportion of elderly people
(aged 65 and over) increased. while that of young people (under age
20) and people of working age (aged 20-64) declined. As a result of
this process. the shape of the «age pyramid» has been transformed
into one of a fir tree (2019). in which the baby boom generation
(born between 1940 and 1971) predominates. Younger generations.
in contrast. are smaller. The proportion of persons aged 65 and over
is expected to rise from 18.7% (2019) to 25.6% in 2050.
FSO, Statistical Data on Switzerland 2021 5Population Chidren born alive, 2019
Total 86 172
Multiple births 4, 2019
Total 1 448
Boys for every 100 girls 104.9 of which twin births 1 426
Proportion of children out of 26.5 4 Incl. children born alive and stillborn children
wedlock in %
Children per woman 1 1.5
1 Average number of children that would be born
to a woman over her lifetime given the age-
specific fertility rates in the year of observation
Total fertility rate5
3.0
Deaths, 2019 Foreigners
2.5
Total 67 780
Age at death (years) 2.0
0 – 19 459 1.5
20 – 39 784 1.0
40 – 64 7 146 0.5 Swiss
65 – 79 17 245
0.0
≥ 80 42 146
1971 1980 1990 2000 2010 2019
5 Average number of children per woman, see note 1
International migration, 2019
Immigration 169 573 Net migration and natural change
in ’000
of which foreigners 145 608
Emigration 126 221 100
of which foreigners 94 859 80 Net migration6
Net migration 43 352 60
Swiss −7 397 40
Foreigners 50 749 20
0
–20
–40 Natural change7
Internal migration 2, 2019 –60
Total movements 517 734 1971 1980 1990 2000 2010 2019
2 Movements between communes. excl. move-
ments within a given commune 6 Until 2010, change of status included, since 2011
incl. conversions from non permanent residence status
7 Live births minus deaths
Marriages, 2019
Total 38 974 Marriages and divorces
Swiss/Swiss 18 769
Swiss husband/Foreign wife 7 831 100% Total first marriage rate
Foreign husband/Swiss wife 6 160 80% women8
Foreign/Foreign 6 214
Average age at first marriage (years) 60%
Single men 32.3 40% men8
Single women 30.1
20%
0% Total divorce rate 9
Divorces, 2019 1950 1980 2000 2019
Total 16 885 8 Probability of first marriage for a person under
with minors involved in % 46.6 the age of 50 based on the age-specific first
marriage rates of the year of observation
Duration of marriage 9 See note 3. Since 2011, divorces between two
0 – 4 years 1 973 foreigners are not always recorded
5 – 9 years 3 924
10 – 14 years 3 291
15 or more years 7 697
Total divorce rate 3 41.1
3 Proportion of marriages. ending in divorce sooner
or later. based on the divorce rates of the year of
observation
6 FSO, Statistical Data on Switzerland 2021Share of foreign permanent Foreign permanent resident
Population resident population population by nationality,
2019 in %
30%
25%
20% Italy 14.8
15%
Germany 14.1
10%
5% Portugal 12.0
0%
France 6.4
1900 1930 1960 1990 2019
Kosovo 5.2
Foreign permanent and non Spain 3.9
permanent resident population
by residence permit, 2019 in ’000 Turkey 3.1
Total 2 251.3
Resident – B permit 710.9 North 3.1
Permanent resident – C permit 1 356.7 Macedonia
International officials and 30.2 Serbia 2.9
diplomats
Temporary resident 81.6 Austria 2.0
(L permit)
United
Asylum seekers – N permit 11.7 1.9
Kingdom
Provisionally accepted – F permit 48.0 Other Europ.
Non-attributable 12.1 13.6
countries
Other
17.1
continents
Acquisition of Swiss citizenship
50 000 5%
40 000 Crude naturalisation rate 1
4%
(right-hand scale)
30 000 3%
20 000 2%
10 000 1%
0 Total acquisitions 0%
1970 1975 1980 1985 1990 1995 2000 2005 2010 2015 2019
1 Number of citizenship acquisitions per 100 holders of annual and permanent residence permits at the
beginning of the year
Foreign population: more than half were born in Switzerland
or have been resident for more than 10 years
Foreigners account for 25.3% of the permanent resident population.
More than half of the residents without a Swiss passport (56.47%)
have been living in Switzerland for more than 10 years or were born
here. In 2019, 41 127 people (2.0% of the foreign permanent resi-
dent population) obtained Swiss citizenship. The foreign population
is young: for every 100 foreigners of working age (aged 20-64) there
are only 11 aged 65 and over (compared with 38 among the Swiss).
29.4% of children born in Switzerland in 2019 had foreign citizenship.
In 2019 the number of immigrations fell by 0.3% compared with the
previous year. 59.5% of immigrants came from EU/EFTA countries.
FSO, Statistical Data on Switzerland 2021 7Diversity of household types
Population In 2019 only 25% of private households belonged to the household
type «Couple with child(ren) under age of 25. 16% of households with
at least one child under the age of 25 were one-parent families. and
6% patchwork families. These high figures are the result of a great
number of divorces (16 885 in 2019). Furthermore. the proportion
of non-marital births more than doubled between 2000 and 2019.
from 11% to 26%.
The decision to get married and start a family is being made increa-
singly late in life: The age at first marriage among women rose from
24.1 (1970) to 30.1 (2019) and among men from 26.5 to 32.3 years.
The average age of mothers at first birth rose from 27.8 to 32.1 years
(2019).
In 2019 roughly eight in ten mothers were working - however mostly
only part-time. Fathers still mainly work full-time.
Private households, 2019 in ’000 Family households with children,
Total 3 804.8 2019 Children under 25
One person household 1 371.3
3.9%
Couples without children 1 034.5
Couples without child(ren) 932.6 with with 4 children
12.2% and more
under 25 years 3 children
Lone parents with child(ren) 180.4 41.3%
under 25 years with 1 child
42.6%
Other households with several 285.9 with 2 children
persons
Main languages, 2019 1 in % Religious affiliation, 2019 2 in %
German 62.7 Protestant 22.5
French 22.8 Roman Catholic 34.4
Italian 8.3 Other Christian communities 5.7
Romansh 0.5 Jewish religious community 0.2
English 6.5 Islamic religious communities 5.5
Portuguese 3.5 Other churches and religious 1.3
Albanian 2.8 communities
Serbo-Croatian 2.3 No religious affiliation 29.5
Spanish 2.4 Unknown 0.8
Turkish 1.1 2 Resident permanent population aged 15 or more
Other languages 6.3 and living in a private household
1 Resident permanent population aged 15 or
more and living in a private household. Several
languages possible
Coexistence presents challenges
In 2018, 34% of the permanent resident population in Switzerland
said that they felt disturbed by the presence of persons they perceived
to be different on the basis of their nationality, religion, language
or skin colour. Nevertheless, the population remained largely open-
minded. A majority were in favour of more rights for foreign nationals;
particularly with regard to the right to family reunification (2018:
61% were in favour of this). 59% perceived racism as a very serious
social problem and 55% believed that the integration of migrants in
Switzerland worked well.
▶ www.statistics.admin.ch → Look for statistics → Population
8 FSO, Statistical Data on Switzerland 2021Use of resources and emissions Index 1990 =100
Territory and Environment 160
150 GDP (adjusted for inflation)
140 Resident population
Municipal waste
130
Gross energy consumption
120
Greenhouse gas emissions
110 Material consumption (DMC)
100 Consumption of drinking water
90
80
70
1990 1995 2000 2005 2010 2019
A growing population and economy are usually accompanied by
a rise in the consumption of natural resources and an increase in
emissions – unless behaviours change or technological advances lead
to improved efficiency. The volume of municipal waste, for example,
tends to grow at roughly the same rate as the gross domestic product
(GDP). Greenhouse gas emissions, on the other hand, have remained
relatively constant since 1990. Drinking water consumption has even
decreased despite the needs of a growing population and economy.
Land use Change in land use
Period of survey 2004 – 2009 in square metre per second
km 2 %
1979/85 – 1992/97 1992/97– 2004/09
Total surface area 41 290 100
Forest and woods 12 930 31.3 Settlement and 0.86
Agricultural areas 9 678 23.4 urban areas 0.69
Alpine farmland 5 139 12.4 0.83
Forest
Settlement and urban 3 079 7.5 0.43
areas –0.10
Woods
Lakes and watercourses 1 774 4.3 –0.13
Other natural space 8 690 21.0 –0.86
Agricultural areas
–0.61
Within 24 years, settlement –0.51
and urban areas have grown by Alpine farmland
–0.27
23%, mainly at the expense of –0.21
Other natural space
agricultural areas. According to –0.11
the latest figures, settlement and –1.0 –0.5 0.0 0.5 1.0
urban areas constitute 7.5% of
Switzerland’s surface area and 4.7% of the surface is sealed.
Temperature fluctuations The air temperature varies from
Deviations from long-term mean value year to year and is characterised
1961–1990, in °C
by colder and warmer periods.The
2 six warmest years in Switzerland
since records began in 1864 have
1
been measured after the year
0 2010 and 2018 was the warmest
year so far.
–1
–2
1900 1940 1980 2020
FSO, Statistical Data on Switzerland 2021 9Endangered animals and plants (red lists)
Territory and Environment Status 1994 – 2018, depending on the species group
Mammals (95% of the 85 species)¹
Breeding birds (100%, 199)
Reptiles (100%, 19)
Amphibians (90%, 20)
Fish and cyclostomes (75%, 73)
Molluscs (92%, 270)
Crustaceans: crayfishes (100%, 3)
Insects (98%, 2843)
Vascular plants (96%, 2712)
Mosses (91%, 1093)
Macro-algae (92%, 25)
Lichens (91%, 786)
Higher fungi (60%, 4959)
0% 20% 40% 60% 80% 100%
Lost or extinct Endangered Potentially endangered Not endangered
1 Reading aid: The endangerment status was assessed for 95% of the 85 mammal species.
Data are deficient for the remaining species.
There are around 46 000 known species of flora, fauna and fungi in
Switzerland. Of the species examined, 35% are on the red list, i.e.
they are considered endangered, missing or extinct.
Perception of environmental conditions in the place of residence, 2019
Share of population
Traffic noise at home when windows opened
Air pollution surrounding the place of domicile
Radiation from mobile phone antennae/high-voltage
power lines surrounding the place of domicile
0% 20% 40% 60% 80% 100%
Very disturbing Rather disturbing Not very disturbing Not at all disturbing
In 2019, 31% of the population found traffic noise at home with
open windows to be very or rather disturbing. 34% were of this
opinion with regard to air pollution surrounding the house and 23%
with regard to radiation from power lines or mobile phone antennas.
Environmentally related Environmentally related taxes
taxes revenue make environmentally damaging
CHF billion, at current prices goods and services more expen-
12 Taxes on: sive and encourage consumers
10 Pollution and producers to think about the
consequences of their decisions.
8 Transport In 2019, environmentally related
6 Energy taxes revenue corresponded to
(stationary) 5.1% of total revenue from taxes
4
and social contributions.
2 Energy
(transport)
0 ▶ www.statistics.admin.ch →
1990 2000 2010 2019 Look for statistics → Territory and
Environment
10 FSO, Statistical Data on Switzerland 2021Labour force as % of the People in part-time employment
Employment and Income permanent resident population (15+) as % of the employed persons
100% 70%
Men 60% Women
80%
50%
60% Total
40%
1
40% 30% Total
Women 20%
20%
10% Men
0% 0%
1971 1980 1990 2000 2010 2020 1991 2000 2010 2020
1 New calculation method from 1991
resp. 2010 onwards
People employed1 by economic Employed persons according to
sector in millions employment status 1
Permanent resident population, in ‘000
4.0
2nd Qtr 2019 2020
Services Total 4 723 4 637
3.0
Self-employed 603 586
2.0 Industry, Family workers 87 84
business Employees 3 836 3 777
1.0 Apprentices 197 190
Agriculture 1 Sociological definition
0.0
1975 1990 2000 2010 2020
1 New calculation method from 1991 resp.
2010 onwards
Persons in employment by type of authorisation and gender in ’000
2nd Qtr 1991 2000 2005 2010 2015 2020
Total 4 042 4 014 4 126 4 480 4 890 5 023
Swiss 3 014 3 069 3 094 3 268 3 398 3 401
Foreigners 1 028 944 1 032 1 211 1 492 1 622
Permanent residents 534 569 557 584 687 771
Temporary residents 172 175 228 337 433 441
Seasonal workers 1 85 25 − − − −
Cross-border workers 183 140 176 230 299 340
Temporary visitors 21 20 53 42 46 37
Other foreigners 34 15 18 17 26 34
Men 2 370 2 265 2 284 2 473 2 662 2 733
Women 1 672 1 749 1 842 2 007 2 228 2 291
1 As of 1.6.2002 seasonal work permits are no longer issued
Considerable increase in women’s participation in labour market
Between 2015 and 2020 the number of women in employment rose
at a slightly greater rate than that of employed men (+2.9% to 2.291
million compared with +2.5% to 2.726 million). Three out of five women
worked part-time (2015: 60.0%, 2020: 59.7%). Just under 20% of men
worked part-time, although the proportion of men working part-time
has risen slightly (+1.9 percentage points to 18.3%). The increase in
women’s labour force participation can be attributed to the tertiarisation
of the economy. 87.2% of women in employment in 2020 worked in
the tertiary sector (men: 67.4%). Part-time employment is mainly found
in the service sector (9 out of 10 part-time jobs).
FSO, Statistical Data on Switzerland 2021 11Foreign workers
Employment and Income Foreign workers are an important factor in the Swiss labour market.
Since the 1960s, their share of the labour force has always exceeded
20%; in 2019, it was 31.7%. Foreign labour is particularly important
in the industrial sector (2019: 39.2%, service sector: 30.3%).
In 2019, 78.3% of foreigners in employment were citizens from an
EU or EFTA country. Just under two thirds of the permanent resident
population from the EU came from Germany (23.0%), Italy (20.7%)
and Portugal (19.4%).
Unemployment rate 1 by major region and other criteria
2nd quarter 2005 2010 2015 2019 2020
Switzerland 4.4 4.6 4.4 4.2 4.6
Lake Geneva region 6.5 7.0 6.7 7.4 7.3
Espace Mittelland 4.0 4.6 3.7 3.6 4.1
Northwest Switzerland 4.1 4.7 3.8 3.0 4.6
Zurich 4.2 4.0 4.3 4.3 3.8
Eastern Switzerland 3.8 3.7 3.7 3.0 4.2
Central Switzerland 2.9 3.1 3.4 (2.1) (2.2)
Ticino 6.1 (5.2) 6.5 5.5 6.5
Men 3.9 4.3 4.3 3.9 4.8
Women 5.1 5.1 4.6 4.4 4.4
Swiss 3.2 3.5 3.1 3.0 3.4
Foreigners 8.9 8.5 8.2 7.3 7.6
15–24 years 8.8 7.5 6.9 6.2 8.4
25–39 years 4.4 5.2 4.8 4.2 4.5
40–54 years 3.3 3.8 3.9 3.9 4.2
55–64 years 3.7 3.4 3.5 3.9 3.8
1 Unemployment rate based on ILO
(Figure): The result is based on fewer than 50 observations in the sample and should therefore be
interepreted with great caution
Time spent on paid work, on domestic and family workload and on
voluntary work, 2016
Persons aged 15 to 64 by family situation: hours on average per week
21.3 29.6 Women Total Men 18.1 33.0
1.8
1.4
26.6 18.1 Persons living alone 14.6 33.9
2.0
1.6
Partners in
25.1 21.7 15.7 34.9
2.4
1.7
two-person household
Mothers, fathers with partner and
15.4 52.8 29.2 38.3
1.4
1.3
child(ren), youngest aged 0–14
Lone mothers, fathers with
(1.2)
19.7 46.8 (42.0) (34.0)
1.6
child(ren), youngest aged 0–14
Sons, daughters (15–24)
12.1
17.8 15.0 20.2
1.0
1.0
still living with their parents
80 60 40 20 0 0 20 40 60 80
Domestic and family workload Voluntary work Paid work
(Figure): The result is based on fewer than 50 observations in the sample and should therefore be
interepreted with great caution.
Involvement in voluntary work, 2016
as a percentage of permanent resident population age 15 and older
Total Informal Organised
Total 42.7 31.7 19.5
Men 41.4 28.4 21.7
Women 44.0 34.9 17.4
12 FSO, Statistical Data on Switzerland 2021Employment and Income Wage level 1 per main region, economy as a whole, 2018
Median, in Swiss francs
Professional position
Total a b c d
Switzerland 6 538 10 317 8 480 7 114 5 963
Lake Geneva region (VD, VS, GE) 6 600 11 178 9 114 7 320 5 999
Espace Mittelland (BE, FR, SO, NE, JU) 6 511 9 848 8 099 6 962 6 085
North-western Switzerland (BS, BL, AG) 6 714 10 643 8 453 7 480 6 118
Zurich (ZH) 6 965 11 133 9 479 7 717 6 086
Eastern Switzerland (GL, SH, AR, AI, SG, 6 118 8 852 7 535 6 539 5 704
GR, TG)
Central Switzerland (LU, UR, SZ, OW, 6 438 9 666 7 904 6 823 5 933
NW, ZG)
Ticino (TI) 5 363 8 254 [6 338] 5 813 4 852
1 Standardised monthly wage: full-time equivalent based on 40 hours a week and 4 1/3 weeks a month.
Wage components: gross wage including 1/12 of 13th month salary and 1/12 of special annual payments
a = top, upper and middle management; b = lower management level;
c = lowest management level; d = no management function
Low wages
The number of low wage jobs (full-time jobs with a gross monthly
wage below CHF 4359) rose slightly in 2018 to 353 000 (2016:
329 000). Economic sectors characterised by a high rate of low wage
jobs include retail trade (24.4%), the restaurant sector (44.7%),
the manufacture of wearing apparel (56%), and personal services
(57.3%). More than 480 000 persons or 12.1% of all employees held
a low wage job in 2018. 64.4% of them were women (2016: 66.4%).
The wage gap between women and men
In 2018, the wage gap between women and men in the economy
as a whole was 11.5%. In 2016 it was 12.0% and in 2014 12.5%.
Women earned 14.4% less than men in the private sector, and 11.4%
less than men in the public sector. The gender wage gap can partly
be explained by structural characteristics and varying occupations (in
particular the level of responsibility at work or the economic sector).
It illustrates the unequal occupational integration of the female and
male personnel in the labor market.
Evolution of nominal wages, consumer prices
and real wages Change compared with the previous year in %
7%
6% Nominal wages
5%
4%
3% Consumer price index
2% Real wages
1%
0%
–1%
–2%
1990 1990 2000 2005 2010 2015 2019
▶ www.statistics.admin.ch → Look for statistics → Employment and
Income
FSO, Statistical Data on Switzerland 2021 13Moderate growth of the Swiss economy in 2019
National Economy Economic activity in Switzerland in 2019 measured by gross domestic
product (GDP) recorded growth of 1.1% at previous year’s prices,
almost 2 percentage points less than real growth in 2018.
This moderate growth took place in an unfavourable environment with
declining commercial activity, a lack of international sporting events
and a slightly negative contribution from foreign trade. Excluding
non-monetary gold, the balance of goods and services fell by 0.7%
in 2019. This decline was due to a strong decrease in the balance of
services (–34.7%). The balance of goods (excluding non-monetary
gold) rose (+7.7%). The drop in the balance of services was due in
part to a decline in the export of services (–3.0%) and to an increase
in imported services (+2.0%). The rise in the balance of goods (exclu-
ding non-monetary gold) can be explained by comparatively stronger
growth in exports than in imports (+3.9% and +2.5% respectively),
in particular in the chemical and pharmaceutical industries.
After four years of strong growth between 2014 and 2017, inves-
tments in equipment and construction rose again slightly (+1.2%).
Without the downturn in construction investments (–0.5%), growth
would have been stronger.
With regard to the production approach, the value added in the ma-
nufacturing industry continued to expand (+2.6%). Overall, the other
economic branches also grew. The only notable exceptions were com-
merce (–1.2%) and the “Art, entertainment and recreation” branch
(–10.2%). The sharp decline in the latter is because no large interna-
tional football tournaments or Olympic Games took place in 2019.
Gross domestic product (GDP) and its components
Percentage change over previous year at prices of preceding year
2011 2012 2013 2014 2015 2016 2017 2018 2019
GDP 1.9 1.2 1.8 2.4 1.7 2.0 1.6 3.0 1.1
Final consumption expenditure 1.4 1.8 2.2 1.2 2.1 1.4 1.1 0.8 1.3
Gross capital formation 13.1 −7.0 −7.0 7.3 0.7 −0.9 2.6 1.8 1.5
Exports of goods and services 4.0 1.0 13.8 −6.2 4.1 6.5 −0.3 3.4 −0.2
Imports of goods and services 9.0 −2.4 12.5 −7.3 4.8 5.3 −0.9 0.4 −0.1
GDP in CHF billion at current 641 649 661 673 676 685 694 720 727
prices
Importance of relations with the rest of the world
From 1997, foreign trade played a leading role in the growth of the
GDP. The periods of strong economic expansion coincided with boo-
ming foreign trade. During the boom years (1997 to 2000 and 2004
to 2007), exports were the biggest contributor to GDP. One of the
consequences of the dynamism of exports was an increase in the share
of the foreign contribution (balance between exports and imports) to
the GDP, showing the growing significance of the rest of the world to
the Swiss economy. This was why Switzerland felt the full impact of
the slowdown in the world economy in 2009, leading to a negative
contribution to growth by foreign trade.
Since the financial crisis of 2008, foreign trade’s contribution to
14 FSO, Statistical Data on Switzerland 2021growth in GDP has become more erratic. In 2019, this contribution
National Economy was a negative one. Nevertheless, gross national income rose by 3.8%
(2018: 3.5%). This increase was due to a larger decline in property
income paid abroad (–24.2%) compared with the decline in property
income from abroad (–10.7%). The decrease in property income paid
and received from abroad can be attributed in both cases to a marked
decline in income from direct investment.
Share of the external sector in GDP GDP and GNI at current prices
at current prices in CHF billion
14% 800
12% Gross National Income
700
10%
8% 600
6% 500
4% Gross Domestic Product
400
2%
0%
1995 2000 2005 2010 2015 2019 1995 2000 2005 2010 2015 2019
Annual growth rate
Once economic activity measu- 4% GDP at prices of the preceding year
red by GDP is known, one can 3%
investigate the efficiency with 2%
which productive resources (la- 1%
bour and capital) are utilised. 0%
Labour efficiency is measured by –1%
hourly labour productivity, i.e. the –2% Hourly labour productivity
value added created in one hour –3%
of work. 1992 2000 2010 2019
Gross domestic product per inhabitant, 2018
by canton SH
BS
TG
BL ZH
JU AG AR
SO SG AI
ZG
LU
SZ GL
NE
NW
BE
OW UR
FR
GR
VD
TI
GE VS
Gross domestic product per inhabitant at current prices, in thousands Swiss francs
< 60.0 60.0 – 69.9 70.0 – 79.9 80.0 – 89.9 ≥ 90.0 CH: 84.5
▶ www.statistics.admin.ch → Look for statistics → National Economy
FSO, Statistical Data on Switzerland 2021 15Prices Changes in consumer price index
2016
changes in yearly average in %
2017 2018 2019 2020
Total −0.4 0.5 0.9 0.4 −0.7
Food and non-alcoholic beverages 0.4 0.4 1.3 0.1 0.1
Alcoholic beverages and tobacco −0.5 0.5 0.7 0.8 1.0
Clothing and footwear 1.3 2.8 1.6 1.9 0.3
Housing and energy −0.1 1.2 1.3 0.4 −0.2
Household goods and services −2.2 −1.8 −0.5 1.7 −0.4
Health −0.4 −0.5 −1.0 −0.2 −0.8
Transport −2.4 1.5 2.7 0.4 −3.4
Communications −1.5 −1.6 0.4 0.8 −0.2
Recreation and culture 0.8 1.0 1.7 −0.3 −2.7
Education 0.8 0.9 1.1 0.7 0.8
Restaurants and hotels −0.2 0.4 0.5 0.6 0.4
Other goods and services −1.8 −0.4 0.5 0.6 −0.3
Consumer price index by origin Producer and import price index
115 Index, May 2000=100 115 Index, Mai 2000 = 100
110 110 Producer price
Domestic
105 105
100 Total 100
95 95
90 Foreign Total supply
90
85 85 Import price
80 80
2000 2004 2008 2012 2016 2020 2000 2004 2008 2012 2016 2020
International comparison of price indices, 2019 EU-27 = 100
Switzerland Germany France Italy
Gross domestic product 155 111 109 100
Actual individual consumption 174 108 110 103
Food and non-alcoholic beverages 163 101 115 109
Alcoholic beverages, tobacco and narcotics 128 101 126 100
Clothing and footwear 126 99 108 99
Housing, water, electricity, gas 194 118 121 99
and other fuels
Household furnishings, equipment and 131 105 106 101
maintenance
Health 218 108 100 126
Transport 122 107 107 99
Communication 151 120 94 88
Recreation and culture 153 107 106 100
Education 271 124 101 99
Restaurants and hotels 166 103 123 104
Miscellaneous goods and services 173 102 105 101
Actual collective consumption 180 124 124 108
Gross fixed capital formation 137 121 102 88
Machinery and equipment 112 97 104 98
Construction 175 144 101 82
Software 108 97 100 101
▶ www.statistics.admin.ch → Look for statistics → Prices
16 FSO, Statistical Data on Switzerland 2021More than 99% of enterprises are SMEs
Industry and Services More than 99% of all enterprises in Switzerland are small and me-
dium-sized enterprises (SME) i.e. enterprises with fewer than 250
employees. The proportion of micro-enterprises (with fewer than 10
employees) in 2018 is larger in the service sector than in the secondary
sector (90.6% compared with 80.1%). The average size of enterpri-
ses also differs accordingly (service sector: 7.2 employees; secondary
sector: 12,2 employees). Over two thirds of employees work in SMEs;
around one third in large enterprises (with fewer than 250 employees).
Slightly more than a fourth of jobs (25.7%) are accounted for by
micro-enterprises and over a fifth (21.4%) by enterprises with 10 to 49
employees. In 2018 the share of total employment represented by the
tertiary sector in the case of private enterprises was 72.2%. Overall in
private enterprises 157 003 employees worked in the primary sector,
1 100 708 in the secondary and 3 263 308. in the tertiary. The healthcare
and retail sectors counted the most employees in private enterprises
(415 513 and 341 628 employees respectively).
Company size1, 2018
Companies by size category Employees by size category of companies
1.6% 0.3%
8.5% 89.7% 32.8% 25.7%
20.1% 21.4%
0– 9 10– 49 50– 249 250 +
1 Only market-oriented companies. The size of a company is determined by the number of employees
Market-oriented companies and employees by economic activity
2018
according to NOGA 2008, in ’000 Companies Employees
Total 592.7 4 521.0
Sector 1 52.3 157.0
Sector 2 90.3 1 100.7
of which:
Manufacture of food, beverage and tobacco products 4.5 98.6
Manufacture of textiles, apparel and leather goods 2.5 14.7
Manufacture of wood and paper products, and printing 9.5 65.9
Manufacture of pharmaceutical products 0.7 30.1
Manufacture of metal products 7.3 86.9
Manufacture of computer, electronic and optical products; 2.0 113.0
watches and clocks
Manufacture of electrical equipment 0.8 31.5
Electricity, gas and steam supply 0.8 31.1
Construction of buildings and Civil engineering 9.3 110.5
Sector 3 450.2 3 263.3
of which:
Wholesale trade 22.7 226.9
Retail trade 34.4 341.6
Accommodation 5.3 74.2
Food and beverage service activities 23.0 171.0
IT and other information services 16.9 100.2
Financial service activities and insurance 6.5 180.2
Architectural and engineering activities 24.7 130.8
Administrative and support service activities 3.4 19.9
Human health and social assistance 66.2 465.7
FSO, Statistical Data on Switzerland 2021 17Industry and Services Business demography, 2018
Economic activity (NOGA 2008) New companies Jobs created by High-growth
new companies companies
Total 39 608 54 052 4 440
Sector 2 5 048 8 196 1 026
Industry and Energy 1 861 2 793 570
Construction 3 187 5 403 456
Sector 3 34 560 45 856 3 414
Trade and repair sector 4 332 5 987 516
Transport and warehousing 1 099 1 440 204
Accommodation, food and beverage 1 310 2 785 281
service activities
Information and communication 2 424 3 397 310
Banking and insurance 1 365 2 052 192
Real estate activities and services 3 555 5 298 516
Professional and scientific activities 8 561 10 543 621
Education 1 975 2 261 148
Health and social services 4 530 5 385 418
Arts and recreation 2 108 2 941 139
Other service activities 3 301 3 767 69
Production in the secondary sector Overall production in the se-
condary sector (industry and
Indexed change in the quarterly results
Annual average 2015=100 construction) grew by 35.2%
130 between 2004 and 2019. The
120 trend is highly cyclical. Furthermo-
re, the Swiss economy was hit by
110 the financial crisis in 2007 and at
100 the start of 2015 by the Swiss
National Bank’s decision to aban-
90 don the minimum euro exchange
80 rate. This decision meant that
Swiss products became more ex-
70 pensive for foreign purchasers
2004 2008 2012 2016 2019 and led to a decline in turnover
for the mainly export-oriented
industry. Whereas in 2015 nearly
all sectors made losses compared
with the previous year, in 2016
the situation improved. In 2018, almost all sectors had recovered.
Although secondary sector production continued to rise in 2019
(+3.5%), only just under half of the economic activities showed po-
sitive figures.
Jobs
Between 2010 and 2019, the number of jobs in industry fell by 1.6%.
Between the 1st quarter and the 2nd quarter 2012 they rose slightly. In
2013, however, the situation took a slight turn for the worse. With the
abolition of the Swiss franc-euro cap at the start of 2015, the number
of jobs in industry declined sharply until the first quarter 2017. After
three years with declining employment (2015-2017), employment
increased for the first time again in 2018. Growth also continued in
2019. From 2010 to 2019 employment in construction rose by 8.7%.
During the same period the number of tertiary sector jobs rose by 15%.
18 FSO, Statistical Data on Switzerland 2021Industry and Services Retail sales variation from the previous year in %
2015 2016 2017 2018 2019
Total Nominal −3.2 −1.8 −0.5 0.3 0.2
Real −1.4 −1.2 −0.5 −0.1 0.3
of which:
Food and beverages, tobacco Nominal −1.4 0.2 −0.2 1.5 0.3
products Real −0.7 0.0 −0.6 −0.2 0.0
Non food (excl. fuel) Nominal −3.3 −3.3 −1.2 −1.4 0.7
Real −0.8 −1.6 −0.1 −0.9 1.0
Fuel Nominal −14.5 −5.3 3.7 3.9 −2.9
Real −1.1 0.4 −3.5 −4.3 −1.3
Total excluding fuel Nominal −2.4 −1.6 −0.7 0.1 0.5
Real −0.8 −1.0 −0.6 −0.2 0.5
Retail trade
After years of strong turnover (2002-2008), in 2009 in the wake of the
global financial crisis, Swiss retail trade suffered from a slight decline.
The following years registered ever-smaller increases in turnover and
in 2015, the period of growth came to an abrupt end. The reason was
the revaluation of the Swiss franc against the euro and the subsequent
price increases of Swiss products, which amongst other things led to
greater numbers of Swiss consumers making their purchases abroad.
After a sharp decline in turnover in the following years, nominal
turnover rose again slightly in 2018 and 2019.
Foreign trade: our key partners, 2019 in CHF billion
Imports Exports
Germany 57.2 Germany 47.7
Italy 22.2 USA 44.2
France 18.9 UK 28.1
USA 18.9 China (PRD) 21.4
UK 16.4 France 19.2
China (PRD) 15.1 India 17.9
UAE 14.9 Italy 16.1
Austria 8.5 Hong Kong 9.9
0 10 20 30 40 50 60 0 10 20 30 40 50
Total: CHF 276.1 billion other Total: CHF 312.0 billion
Distribution North America
7% 16%
by continent
Europe
Europe
24% Asia 52%
60% 28%
Foreign trade: the key goods in CHF million
Imports Exports
2000 2018 2019 2000 2018 2019
Total 139 402 273 389 276 058 136 015 303 886 311 977
of which:
Food, beverages and tobacco 7 197 10 862 10 784 3 239 8 980 9 056
Textiles, clothing, footwear 8 905 11 662 11 975 3 891 4 863 4 984
Chemicals 21 899 50 159 52 705 35 892 104 372 114 575
Metals 10 735 15 907 14 942 10 892 14 402 13 585
Machinery, electronics 31 583 32 079 32 002 37 137 33 520 32 064
14 903 19 299 19 503 3 054 5 020 5 652
Vehicles 1 622 4 007 3 789 10 297 21 180 21 718
Watches 1 622 3 545 4 007 10 297 19 921 21 180
▶ www.statistics.admin.ch → Look for statistics → Industry and Services
FSO, Statistical Data on Switzerland 2021 19The agricultural and alpine agricultural areas together make up 36%
Agriculture and Forestry of the total area of Switzerland. The number of farms is generally
decreasing although the actual farms are getting bigger and the
organically farmed area is increasing. Animal production is the pre-
dominant branch of farming. Forest and woodland account for 31%
of Switzerland’s territory. The forest area has notably increased in the
Alps. Two thirds of trees are coniferous. In 2019, 4.6 million m3 of
timber was harvested. The landscape is therefore largely shaped by
agriculture and forestry. In 2019, the share of agriculture and forestry
in the gross value added of the Swiss economy was 0.7%.
A few key indicators in agriculture Index 1996=100
160
Agricultural area per holding
(2019: 21 ha per agricultural holding)
140 Subsidies
(2019: CHF 3.0 billion)
120 Factor income
(2019: CHF 4.9 billion)
100 Number of cattle
(2019: 1.5 million)
Number of jobs
80
(2019: 74 000 annual work units /
2800 working hours)
60 Number of agricultural holdings
1996 2000 2005 2010 2015 2019 (2019: 50 000)
Agricultural area used, 2019 Excl. summer pastures
1.5%
Other arable agricultural land Cereals
2.3% 13.6% 2.8% Potatoes, beets
Perennial crops
2.9% Oil seeds
6.8%
Other open arable land
70.2%
Grassland and meadow
Total area = 1 043 729 ha of which 16.3% is used for organic farming
Output of agriculture , 2019 1
in % Logging in million m³
Crop output 39.0
10
Cereals 3.3
Forage plants 10.6 8
Vegetables and horticultural 12.1 Lothar storm
6
products
Fruits and grapes 4.9 4
Wine 4.2 2
Other crop outputs 3.9
Animal output 48.3 0
Cattle 12.4 1996 2000 2005 2010 2015 2019
Pigs 8.5 Fuelwood Sawlogs
Milk 21.4 Industrial roundwood
Other animals and animal products 6.0
Agricultural services output 6.4
Non-agricultural secondary activities 6.3
1 Total value = CHF 11.4 billion
▶ www.statistics.admin.ch → Look for statistics → Agriculture and Forestry
20 FSO, Statistical Data on Switzerland 2021Total energy use and final Electricity generation by power
Energy consumption, 2019 plant type, 2019
8.4%
Rest 13.4% Losses Conventional Hydropower
thermal 24.6% (run-of-river
Gas 10.9% power power
plants1 35.2% plants)
Hydro- 13.0% 12.8% Rest
power Nuclear 31.8% Hydropower
13.8% Gas power plants (storage
Nuclear 24.5% power plants)
combustibles 24.7% Electricity Total: 71.9 billion kWh
1 Incl. district heating power stations and various
renewable energies
Crude oil 38.2% 35.3% Motor fuels
and
petroleum Renewable energy, 2019
products 13.5% Heating
fuels Share of final consumption in %
Energy use1 Final energy
Total consumption Total Total 24.1
Hydropower 12.7
1 125 550 TJ 834 210 TJ
Biomass (wood and biogas) 5.2
1 Incl. export surplus of electricity (2.0%)
Ambient heat 2.2
Renewable energy from waste 1.6
Solar power 1.2
Final energy consumption is clo- Biogenic fuels 1.1
sely linked to economic develop- Energy from sewage treatment 0.2
ment and population growth. plants
Increasing numbers of inhab- Wind power 0.06
itants, larger dwellings, growing
production, rising consumerism,
heavier motor vehicles etc. lead Final energy consumption in ’000 TJ
to increased energy consumption 1000
unless this is compensated for by
800
greater energy efficiency. In 2019,
transport was the largest consu- 600
mer group with around 38% of 400
the final energy consumption. 200
63% of the final consumption
0
were covered by fossil fuels and
1910 1930 1950 1970 1990 2019
24.1% came from renewable
energies, mainly hydropower.
Final energy consumption by consumer groups
120 Index 1990 = 100 2019
Transport Statistical
Households Transport difference
110 37.7% incl.
Services 16.1% agriculture
1.0%
100
18.0% 27.2%
Industry Households
Industry, services
90 incl. statistical difference
1990 2000 2010 2019
▶ www.statistics.admin.ch → Look for statistics → Energy
▶ www.bfe.admin.ch (Federal Office of Energy) → Supply → Statistics and
Geodata
FSO, Statistical Data on Switzerland 2021 21Construction and Housing Construction expenditure
1980 1990
inCHF million, prices of 2000
2000 2010 2018
Total 34 198 47 588 43 708 49 250 56 986
Public expenditure 11 389 14 507 15 983 15 962 19 162
Civil engineering 6 791 7 740 10 060 9 651 11 047
of which roads … … 5 219 4 740 4 866
Building construction 4 599 6 767 5 923 6 310 8 116
Private expenditure 22 809 33 081 27 725 33 288 37 824
of which housing … … 17 147 22 999 25 605
Housing construction
1980 1990 2000 2010 2018
New residential buildings with 20 806 16 162 16 962 14 736 12 190
appartments
of which single-family dwellings 16 963 11 200 13 768 9 387 6 403
New dwellings 40 876 39 984 32 214 43 632 53 199
with 1 room 2 122 2 010 528 725 2 498
2 rooms 4 598 5 248 1 779 3 913 10 873
3 rooms 7 094 8 937 4 630 10 608 16 541
4 rooms 11 557 12 487 10 783 15 438 14 802
5 rooms or more 15 505 11 302 14 494 12 948 8 485
Housing supply
1980 1990 2000 2010 2019
as of year-end 2 702 656 3 140 353 3 574 988 4 079 060 2 4 582 272
of which remained 0.74 0.55 1 1.26 1 0.94 1 1,72 1
empty in %
1
As of 1 June following year
2
As of 2009 the housing stock is calculated on the basis of the Buildings and Dwellings
Statistic (BDS)
The single-family house remains the most important building
category
Single-family houses as a percentage of total building stock rose from
40% to 57% between 1970 and 2019. In contrast, the number of
newly built single-family houses in 2018 fell by 2.5% compared with
the previous year.
Continuous increase in the home ownership rate since 1970
At the end of 2019, 36.4% of households in Switzerland lived in their
own dwelling. This corresponds to 1 384 241 households. Since 1970
the home ownership rate has risen continuously (1970: 28.5%, 1980:
30.1%, 1990: 31.3%, 2000: 34.6%). The number of dwellings in
condominium ownership has shown the greatest increase. Their num-
ber rose from 237 716 to 446 373 between 2000 and 2019 (+88%).
However, the majority of privately owned dwellings continue to be
composed of households who own the house in which their dwelling
is located (2000: 809 731, 2019: 937 868).
Type of occupant of occupied dwellings 2019
3.3%
Tenant or sub-tenant
Member of cooperative
24.6%
Condominium owner
11.7% 57.4% House owner
Other situation: Dwelling is provided free of charge by relatives
or employer, live-in accommodation (e.g. caretaker), tenancy
2.9%
▶ www.statistics.admin.ch → Look for statistics → Construction and
housing
22 FSO, Statistical Data on Switzerland 2021Tourism Main tourism indicators
2017 2018 2019
Supply (beds) 1
Hotels and health establishments 275 203 274 792 273 849
Holiday homes 159 063 154 149 147 666
Collective accomodation 116 640 115 680 115 414
Campsites 123 096 120 042 118 828
Demand: overnight stays in ’000
Hotels and health establishments 37 393 38 807 39 562
Holiday homes 7 319 7 530 7 257
Collective accomodation 5 398 5 440 5 658
Campsites 3 174 3 580 3 757
Duration of stay nights
Hotels and health establishments 2,0 2,0 2,0
Holiday homes 6,8 6,6 6,5
Collective accomodation 2,6 2,5 2,4
Campsites 2,9 2,9 3,2
Gross occupancy rate: hotels and health establish.
as percentage of beds surveyed 1 37,2 38,7 39,6
Tourism balance of payment CHF million
Revenue from foreign visitors to Switzerland 16 958 17 591 17 837
Expenditure made by Swiss tourists abroad 18 774 18 650 18 635
Balance −1 817 −1 059 −798
1 Annual average number of beds surveyed in open and temporarily closed establishments
Foreign travel destinations of Overnight stays
Swiss tourists1, 2019 in tourist accommodation
in thousands by visitors' country of residence, 2019
Germany 2816 1.4% Switzerland
Austria 940 6.3% Europe (without
2594 10.6% Switzerland)
Italy
52.2% Asia
France2 1885 29.5%
3
1155 America
South East Europe
4 Oceania
South West Europe 1765
and Africa
Rest of Europe 1583
Rest of world 1886
1 Permanent resident population aged 6 and over,
trips abroad with overnight stays;
Total: 14.6 million
2 including overseas departments, Monaco
3 Greece, Turkey, Croatia, Bosnia-Herzegovina,
Serbia, Albania, Slovenia, Montenegro, Kosovo,
Romania, Bulgaria, Macedonia
4 Spain, Portugal, Andorra, Gibraltar
Travel behaviour
In 2019, 88.2% of people over 6 years old living in Switzerland under-
took at least one private trip with overnight stays. To be more precise,
each person undertook on average 2.9 trips with overnight stays and
10.0 day trips. More than half (58%) of all trips with overnight stays
were long trips (minimum 4 overnight stays). Trips abroad represented
65% of trips with overnight stays and 9% of day trips.
▶ www.statistics.admin.ch → Look for statistics → Tourism
FSO, Statistical Data on Switzerland 2020
2021 23Infrastructure
Mobility and Transport Switzerland’s transport infrastructure is well developed in international
comparison. It covers 2% of Switzerland’s territory and about a third
of its settlement and urban areas (according to the Land use statistics
2004/09). Amongst other infrastructure, there are 5196 km of railway
lines (situation in 2015) and 83 274 km of roads (2020) of which
1544 km are motorways across the country.
Stock of road motor vehicles in millions
6
Mopeds (211)1
5 Motorcycles (745)1
4 Industrial vehicles (74)1
Agricultural vehicles (194)1
3 Goods vehicles (441)1
2 Passenger vehicles (83)1
Passenger cars (4624)1
1
0
1980 1990 2000 2010 2019
1 In brackets: stock in 2019, in thousands
Passenger transport performance in billion person-km travelled per year
120
100 Human-powered mobility
80 … … (on foot, by bike)
60 Public road transport
40 Private motorised road
20 transport
0 Rail and cable cars
1970 1980 1990 2000 2010 2019
Daily mobility, 2015 Average per person1 per day, in Switzerland
Travel Travel
Distance time in Distance time in
in km min. 2 in km min. 2
Total 36.8 82.2 Means of transport
On foot 1.9 29.8
Trip purposes Bicycle 0.8 4.0
Work and education 10.8 20.2 E-bike 0.1 0.3
Shopping 4.8 11.5 Motorcycle (incl. 0.5 1.0
moped)
Leisure 16.3 42.2 Car 23.8 33.9
Business travel 2.6 3.8 Bus (incl. postal bus) 1.1 3.4
Tramway 0.4 1.5
Giving people lifts 1.8 3.4 Train 7.5 6.7
Other 0.7 1.1 Other 0.7 1.8
1 Permanent resident population of Switzerland aged 6 years and over
2 Excluding waiting and transfer times
Commuter traffic
Some eight out of ten employed persons in Switzerland were com-
muters in 2019, i.e. people who leave the building in which they live
to get to their place of work. Of this number, 71% worked outside
the commune in which they live.
24 FSO, Statistical Data on Switzerland 2021Number of air passengers
Mobility and Transport In 2019, Swiss airports recor-
Air passengers1
60 in million
ded 59 million individual arrivals
and departures on scheduled 50
and charter flights. This was 40
24 million or 70% more than in 30
2000. 20
10
0
1995 2000 2005 2010 2015 2019
1 Only scheduled and charter flights; local and
transfer passengers arriving and departing
Goods transport performance
All transport, Transalpine goods transport,
in billion tonne-kilometres per year in million tonnes per year
30 40
25 35
30
20 Road
25
15 Road 20
10 15
10
5 Rail 1
5 Rail1
0 0
1980 1990 2000 2010 2019 1980 1990 2000 2010 2019
1 Net tonnes/tonne-kilometres not including the proper weight of goods vehicles (incl. trailers), containers
and swap bodies in intermodal transport
Accident victims by mode of Victims of road accidents
transport 2019
140 Index 1970 =100
Road traffic
120 Slightly injured
Persons killed 187
Persons seriously injured 3 639 100
Persons slightly injured 17 641 80
Rail traffic 60 Seriously injured
Persons killed 17 40
Air traffic (civil aviation only) 20 Killed
Persons killed 11 0
1970 1980 1990 2000 2010 2019
Transport costs and funding Costs and funding of transport
In 2017, transport in Switzerland 2017
Total User
generated total costs of CHF 92.7 costs, finan-
billion (excluding waterways). In in CHF cing,
addition to expenditure on me- bn in %
Road 1 74.3 86
ans of transport (59%) and infra-
Rail 11.7 45
structure (16%), this also included
Air 2 6.7 80
the cost of accidents (12%) and Waterways 3 0.3 64
costs for transport-related dama-
1 Excl. human-powered mobility
ge to the environment and health 2 Excl. general aviation
(13%). 3 Status in 2015
▶ www.statistics.admin.ch → Look for statistics → Mobility and Transport
FSO, Statistical Data on Switzerland 2021 25Switzerland and Europe
Year Switzerland Germany Greece
Inhabitants in ’000 2019 4) 8 545 83 019 10 725
Inhabitants per km2 2018 4) 214 235 83
People under 20 in % 2019 4) 20.1 18.5 19.4
People over 64 in % 2019 4) 18.6 21.6 22.0
Share of foreign nationals 2019 4) 25.3 12.2 7.7
Live births per 1000 inhabitants 2018 10.3 9.5 8.1
Births outside of marriage in % 2018 25.7 33.9 11.1
Female life expectancy at birth (in years) 2018 85.7 83.3 84.4
Male life expectancy at birth (in years) 2018 81.9 78.6 79.3
Total area in km2 2009 5) 41 285 357 108 131 957
Share of agricultural areas 2009 5) 36.9 52.2 40.1
Share of forest and woodland 2009 5) 30.8 32.3 30.7
Greenhouse gas emissions in CO2 equivalents 2018 5) 5.4 10.3 8.6
(t per inhabitant)
Employment rate 2019 84.3 79.2 68.4
Women 2019 80.2 74.9 60.4
Men 2019 88.3 83.5 76.7
Unemployment rate (15 – 74) ILO-based 2019 4.4 3.1 17.3
Women 2019 4.7 2.7 21.5
Men 2019 4.1 3.5 14.0
15 – 24 year-olds 2019 8.0 5.8 35.2
Long-term unemployed based on ILO-definiti- 2019 34.2 37.8 70.1
on (15 – 74) in % of the enemployed
Gross domestic product (GDP) per inhabitant, 2019 50 200 38 300 21 200
in purchasing power standard (PPS)
Harmonized Index of Consumer Prices (HICP) 2019 0.4 1.4 0.5
Gross energy consumption, TOE 1 per 2018 3.1 3.8 2.2
inhabitant
Share of renewable energies in gross energy 2018 21.5 13.7 13.4
consumption in %
Beds in hotels and health establishments per 2019 32.3 22.8 78.3
1000 inhabitants
Cars per 1000 inhabitants 2018 5)
543 560 493
Road accidents: fatalities per 1 million 2018 5) 27 40 65
inhabitants
Expenditure on social security in a % of GDP 2018 26.3 29.6 25.3
Cost of the healthcare system in % of GDP 2018 7.6 9.7 –
Infant deaths 2 2018 3.3 3.2 3.5
Young people (18 – 24) without post-compul- 2019 25.9 35.2 11.5
sory education in %
Persons (25 – 64) with highest educational 2019 44.4 29.9 31.9
attainment at tertiary level in %
Education expenditure in % of GDP 2017 5.1 4.5 3.4
At-risk-of-poverty rate 3 2019 7.7 7.9 10.1
Median of the equivalised disposable net 2018 27 066 21 980 9 245
income, in purchasing power standard (PPS)
Housing costs as % of the disposable household 2019 25.6 25.9 38.9
income
Status January 2021
1 Tonnes of crude oil equivalent
2 Children who died in their first year of life per 1000 live births
3 As % of all employed persons
4 On January 1st
5 On December 31st
26 FSO, Statistical Data on Switzerland 2021Spain France Italy Netherlands Austria Sweden U.K. EU-27
46 937 67 013 60 360 17 282 8 859 10 230 66 647 446 825
93 106 203 504 107 25 274 109
19.9 24.2 18.0 22.1 19.5 23.5 23.5 –
19.5 20.1 22.8 19.3 18.9 20.1 18.5 –
10.4 7.3 8.7 6.2 16.2 9.1 9.3 –
7.9 11.3 7.3 9.8 9.7 11.3 11.0 9.5
47.3 60.4 34.0 51.9 41.3 54.5 – –
86.3 85.9 85.6 83.4 84.1 84.3 83.1 83.7
80.7 79.7 81.2 80.3 79.4 80.9 79.5 78.2
505 991 632 834 301 336 41 543 83 879 441 370 248 528 –
50.8 46.5 48.7 50.8 34.0 8.5 64.1 –
25.2 25.9 31.0 10.7 40.6 63.3 13.1 –
7.1 6.6 7.1 10.9 8.9 5.1 6.9 8.3
73.8 71.7 65.7 80.9 77.1 82.9 78.1 73.4
69.0 68.2 56.5 76.7 72.3 81.2 73.8 67.9
78.5 75.3 75.0 85.1 81.8 84.6 82.5 79.0
14.1 8.5 10.0 3.4 4.5 6.8 3.8 6.7
16.0 8.4 11.1 3.4 4.4 7.0 3.5 7.0
12.5 8.5 9.1 3.4 4.6 6.7 3.9 6.4
32.5 19.6 29.2 6.7 8.5 20.1 11.2 15.0
37.8 40.2 56.0 30.3 25.1 13.7 25.0 41.4
29 000 33 800 30 400 40 800 40 300 37 800 33 300 31 800
0.8 1.3 0.6 2.7 1.5 1.7 1.8 1.4
2.8 3.8 2.6 4.5 3.8 4.8 2.8 3.2
14.4 11.1 19.0 6.0 29.6 41.6 10.9 14.7
41.9 19.6 37.4 17.7 68.8 25.7 – –
513 491 646 494 562 476 478 –
39 49 55 39 46 32 28 –
23.5 33.7 28.8 28.9 29.1 28.3 25.7 27.9
6.3 9.4 6.4 8.2 7.7 9.3 – –
2.7 3.8 2.8 3.5 2.7 2.0 3.9 –
30.9 15.2 30.7 27.6 20.1 30.5 15.3 26.8
38.6 37.9 19.6 40.4 33.8 44.0 44.7 31.6
4.1 5.5 4.0 5.2 5.3 7.1 5.4 4.6
12.8 7.4 11.8 5.4 7.7 7.7 – 9.0
16 030 20 223 16 715 21 528 23 204 20 414 18 423 16 938
17.1 17.6 16.6 23.4 18.2 22.2 – 20.0
FSO, Statistical Data on Switzerland 2021 27Banks and Insurance Total assets and profits of banks, 2019
Bank categories No. institutions Total assets Profit/ Number of staff in
2000 2019 CHF million Loss full-time equivalents
Total 375 246 3 317 617 613 106 085
Big banks 3 4 1 540 711 −5 581 35 549
Cantonal banks 24 24 626 727 3 196 17 585
Stock exchange banks 57 42 223 690 1 070 15 571
Foreign-controlled banks 127 71 224 176 380 14 562
“Raiffeisen” banks 1 1 248 345 835 9 295
Other banks 7 16 223 743 34 7 866
Regional and savings 103 60 126 317 439 3 978
banks
Branches of foreign banks 23 23 98 154 173 1 145
Private bankers 17 5 5 753 66 534
Balance-sheet structure of the
banks, 2019 Interest rates
Assets in %
8% New mortgages1
Total 100 (with variable
of which foreign 39.0 interest rates)
Mortage claims 32.1 6%
Claims against customers 18.7
Liquid assets 16.4 4%
Claims against banks 7.6
Claims from securities transactions 5.9
2% Savings
Participations 3.6 deposits1
Other 15.8 Medium-term
Liabilities 0% bank-issued notes1, 2
Total 100 1977 1990 2000 2010 2020
of which foreign 40.7 1 Up until 2007, average of all cantonal banks,
Customer deposits issued 54.7 2008 average of 60 institutions (including all
Loans and debenture bonds 12.6 cantonal banks)
2 Up until 2007 for 3 – 8 year term, from 2008 for
Liabilities towards banks 13.1 5 year term
Liabilities from securities transactions 4.1
Other 15.5
Exchange rates in Switzerland 1
2018 2019 2020
$1 0.978 0.994 0.938
Insurance benefits, 2019 ¥ 100 0.886 0.912 0.879
In direct Swiss business
€1 1.155 1.113 1.071
Insurance type CHF In %
million £1 1.306 1.268 1.204
Total 32 529 100 1 Bank purchase rate, annual average
Life 13 837 42.5
Health 8 423 25.9
Road vehicle 3 701 11.4 Private insurance, 2019
Accident 2 211 6.8 in CHF million
Personal liability 818 2.5 Insurance type Premiums 1 Benefits 1
Fire 519 1.6 Total 125 684 110 880
Other 3 020 9.3 Life insurance 32 067 53 810
Insurance against 45 554 31 259
accident and loss
Reinsurance 48 063 25 811
1 At home and abroad
▶ www.statistics.admin.ch → Look for statistics → Money, banks and
insurance
▶ www.snb.ch/en (Swiss National Bank)
▶ www.finma.ch (Swiss Financial Market Supervisory Authority) → Private Insurance
28 FSO, Statistical Data on Switzerland 2021You can also read