STOCK STATUS UPDATE FOR AMERICAN LOBSTER (HOMARUS AMERICANUS) IN LOBSTER FISHING AREA 34 FOR 2020
←
→
Page content transcription
If your browser does not render page correctly, please read the page content below

Canadian Science Advisory Secretariat
Maritimes Region                                                 Science Response 2021/018

      STOCK STATUS UPDATE FOR AMERICAN LOBSTER
               (HOMARUS AMERICANUS) IN
           LOBSTER FISHING AREA 34 FOR 2020

                                           Context
Advice on the stock status of American Lobster (Homarus americanus) in Lobster Fishing Area
(LFA) 34 is requested annually by Fisheries Management. The last assessment of this stock
occurred in October 2019 (DFO 2020). This document is the first update since that assessment.
LFA 34 assessment methodology was reviewed and accepted during a stock assessment
framework in September 2019 (Cook et al. In prep 1). This Science Response updates the
primary stock status indicator, the primary fishing pressure indicator, as well as secondary
indicators to the end of the 2019–2020 fishing season.
This Science Response Report results from the Science Response Process of September 28,
2020, on the Stock Status Update of American Lobster in Lobster Fishing Area (LFA) 34.

                                        Background
Description of the fishery
In LFA 34, the inshore commercial fishery for American Lobster has been active for over 150
years. This area covers 20,000 km2 from southwestern Nova Scotia, north to the Bay of Fundy
(Figure 1). The fishery is prosecuted throughout the LFA, with both inshore and offshore
components (inside of 50 nautical miles).
LFA 34 Lobster landings account for 20% of Canadian and 10% of North American totals,
removing an average of 24,000 t annually over the past 5 years. This fishery is effort controlled
by season length, number of licences, number of traps per licence, minimum legal size, and
non-retention of berried females. Other management measures include the requirement for
escape vents to allow sublegal-sized Lobster to leave the trap and biodegradable trap
mechanisms to mitigate ghost fishing of lost traps.

1Cook, A.M., Hubley B., Howse V., and Denton C. (In prep.). 2019 Framework Assessment of the
American Lobster (Homarus americanus) in LFA 34–38. DFO Can. Sci. Advis. Sec. Res. Doc. Presented
and reviewed in September 2019 at the Framework Assessment meeting.

May 2021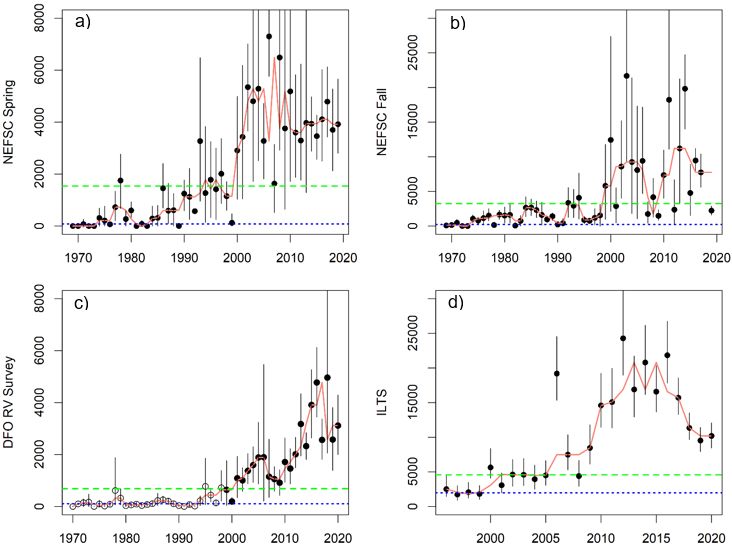
Science Response: Stock Status Update
 Maritimes Region                                                 of American Lobster in LFA 34

Figure 1. Map of Lobster Fishing Area (LFA) 34 with logbook reporting grids outlined in grey.

                                   Analysis and Response
Indicators of Stock Status
The stock status of Lobster in LFA 34 is assessed using primary, secondary, and contextual
indicators. This update includes the primary indicators, which are used to define stock status in
relation to reference points, and secondary indicators, which display time-series trends without
defined reference points (Cook et al. In prep). The data for the indicators for LFA 34 come from
both fishery-dependent and -independent data sources. Fishery-dependent data consist of
commercial logbooks that report information on date, location (grid), effort, and estimated catch.
The fishery-independent data sources are from the Inshore Lobster Trawl Survey (ILTS), DFO
Maritimes Region Summer Trawl Survey (herein RV survey), and spring and fall autumn
surveys conducted by the Northeast Fisheries Science Center (NEFSC). The NEFSC surveys
were not conducted in 2020 due to concerns with the COVID-19 global pandemic and will,
therefore, not be updated, but information is provided using the 2019 data.

Primary Indicators
The primary indicator of LFA 34 stock status, comparing the time-series trends relative to
reference points, is the commercial biomass indices from the four fishery-independent surveys.
From each survey, an exploitation indicator (relative F; fishing mortality) was derived from the
resulting commercial biomass index and landings.

                                                    2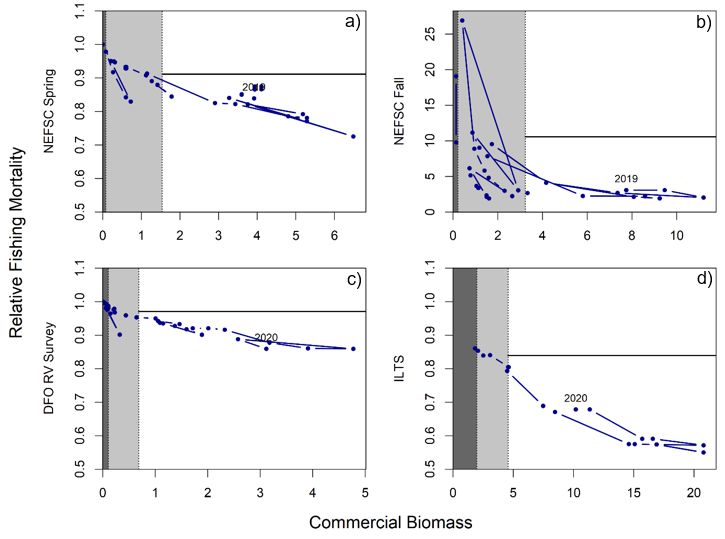
Science Response: Stock Status Update
 Maritimes Region                                               of American Lobster in LFA 34

As multiple surveys are available, the methods employed in Cook et al. (2017) are used to
define reference indicators and reference points (Table 1). Stock status is a combined result
across survey indices, relative to the respective Limit Reference Indicators (LRIs) and Upper
Stock Indicators (USIs). For each index, the USI is defined by using the median commercial
biomass during the high-productivity period as a proxy for carrying capacity K and setting it
equal to 40% of K. LRI is defined as the median of the 5 lowest non-zero biomasses from which
the stock has rebuilt. The Removal Indicator (RI) is defined as the median exploitation rate
during the low-productivity period. The agreed transition from the healthy zone to the cautious
zone (i.e., below the Upper Stock Reference [USR]) requires 3 of 4 survey biomasses to fall
below the respective USIs. Entering the critical zone (i.e., below the Limit Reference Point
[LRP]) requires 2 of 4 survey biomasses to fall below the respective LRIs. Overfishing will be
considered to have occurred when 3 or more of the Removal Indicators (RI) have been
exceeded for their respective stock status zone.

Table 1. Description of the Upper Stock Reference (USR) and Limit Reference Point (LRP) for LFA 34.
USI = Upper Stock Indicator, LRI = Lower Stock Indicator.
 Zone                    Reference Points
 Healthy                 USR     2 or more survey biomasses are above their respective USIs

                                 3 or more survey biomasses are below their respective USI and
                                 above their respective LRI; OR

                                 2 survey biomasses are above their respective USIs and 2 survey
 Cautious                -       biomasses are below their respective LRIs; OR

                                 1 survey biomass above its respective USI, 1 survey biomass below
                                 its respective LRI, and 2 survey biomasses between their respective
                                 USIs and LRIs
 Critical                LRP     2 or more survey biomasses are below their respective LRIs

   Survey Commercial Biomass
Commercial biomass was defined as those individuals available to the fishable component, that
is, ≥ 82.5 mm carapace length with berried females excluded. The commercial biomass from
spring and summer surveys represents the individuals remaining after the commercial fishery.
The commercial biomass from the fall survey was considered post-moult (i.e., just moulted into
their current size class) and would be part of the commercial biomass during the upcoming
season.
The ILTS survey shows that commercial biomass in LFA 34 increased to a high level between
2010 and 2016. The last three years have shown a decline in commercial biomass, though it still
remains high relative to the full time series (Figure 2). The DFO RV survey indicates a similar
pattern but has been more variable in recent years (Figure 2).
The NEFSC spring survey commercial biomass index was relatively stable up until 2000, when
it underwent a rapid increase and has remained fairly high (Figure 2). The NEFSC fall survey
commercial biomass index was similar to the NEFSC spring index but with more variability in
the recent period (Figure 2).
All the commercial biomass indices are above their respective USIs.

                                                  3
Science Response: Stock Status Update
Maritimes Region of American Lobster in LFA 34
Figure 2. Commercial biomass estimates (t) from the a) NEFSC Spring, b) NEFSC Fall), c) DFO RV
Survey, and d) ILTS survey in LFA 34. Red line is the 3-year running median. Green line represents the
USI, and blue line represents the LRI within each figure.
Relative Fishing Mortality
Relative fishing mortality (relF) uses the survey commercial biomass estimates and landings to
show the changes in removals (Ct) relative to the j survey indices (Ijt).
Since the DFO RV survey, the ILTS, and the NEFSC spring survey occur after the fishery is
complete, the estimation of relF was adjusted by the landings as:
Assuming that survey catchabilities were constant, and the index of commercial biomass was
proportional to true commercial biomass, relF represented an index F. By using the time series
of relF, the level of fishing pressure the stock has experienced can be examined (Figure 3).
There were substantial increases in the biomass of commercial Lobster throughout the time
series. The survey indices of commercial biomass increased at a rate faster than the landings,
4Science Response: Stock Status Update
Maritimes Region of American Lobster in LFA 34
resulting in a decrease in relative fishing mortality in recent years. Relative fishing mortality
remains well below the respective RI (blue lines) for each index (Figure 4).
Figure 3. Relative fishing mortality from the trawl survey commercial biomass estimates and the landings.
a) NEFSC Spring, b) NEFSC Fall, c) DFO RV Survey, and d) ILTS survey in LFA 34. Red line is the
3-year running median. The blue line represents the Removal Reference Indicator for each respective
survey.
Secondary Indicators
Secondary indicators represent time-series trends that are tracked individually without defined
reference points. The secondary indicators for LFA 34 are total landings, total effort, and
commercial catch rates from logbook data.
Landings and Effort
Levels of commercial landings are related to population biomass, as fishery controls are input-
(effort controls) rather than output-based (e.g., total allowable catch). There are many factors
that can affect this relationship, including changes in levels of fishing effort, catchability
(including the effects of environment, gear efficiency, etc.), Lobster size distribution, and the
spatial overlap between distribution of Lobster and effort.
5Science Response: Stock Status Update
Maritimes Region of American Lobster in LFA 34
Fishing effort, represented by the number of Trap Hauls (THs), in the Lobster fishery is
controlled by fishing season length, trap limits, and number of fishing licences. Total fishing
effort is calculated from mandatory logbooks.
Over the past 4 seasons, both total landings and total effort have decreased from the record
high landings in 2016 (Figure 4). In 2020, the COVID-19 global pandemic limited the fishing
effort in many LFAs, including LFA 34. LFA 34 landings decreased less than total THs, as the
impacts of COVID-19 were not prevalent until the second half of the fishery (March 2020),
traditionally a period of lower landings. This pattern is evident in the 2020 estimates of
commercial catch rates, with Catch Per Unit Effort (CPUE) in 2020 being among the highest on
record (Figure 5). CPUE increased from 2009–2014 and remains high.
Figure 4. Time series of landings (bars) and effort (sold line with points) by fishing season. Year refers to
end year of season. Data (in orange) for the 2019–20 fishing season are incomplete due to outstanding
fishing logs 2.
2Outstanding fishing logs refer to logs not yet accessible in the Maritimes Fishery Information System
(MARFIS) database. This can include logs not yet submitted by fishermen, or not yet entered into the
database through dockside monitoring companies.
6Science Response: Stock Status Update
Maritimes Region of American Lobster in LFA 34
Figure 5. Time series of commercial catch rates (CPUE - symbols) and their three-year running median
for LFA 34. The data for 2019–2020 fishing season are incomplete due to outstanding logs (triangle).
Conclusions
The primary indicators increased from 2010 through 2016 to the highest levels on record. Since
then, biomass indicators have stabilized or decreased. Similarly, the fishing-pressure indicators
have stabilized or increased over the past several years. Phase plots (Figure 6) compare the
running medians of the survey and associated relative F trends to proposed reference
indicators. Determination of the stock status can be made through the examination of these
plots. Current estimates for commercial survey biomass are well above their respective USIs for
all 4 of the surveys (2 of 4 required) and, therefore, the stock is considered to be in the healthy
zone. Relative F is below the removal indicator for all four survey indices, so overfishing is not
occurring. Secondary indicators (landings, effort, and commercial catch rates) all support the
primary indicators that the stock remains high relative to historic levels.
7Science Response: Stock Status Update
Maritimes Region of American Lobster in LFA 34
Figure 6. Phase plots of the running median of commercial biomass and relative fishing mortalities:
a) NEFSC Spring, b) NEFSC Fall, c) DFO RV, and d) ILTS. Within each plot, the last year’s data point is
labelled and the RI (horizontal black line), LRI (vertical line between dark and light grey zones), and USI
(vertical line between light grey and white zones) are shown.
Contributors
Name Affiliation
Adam Cook (lead) DFO Science, Maritimes Region
Cheryl Denton DFO Science, Maritimes Region
David Hardie DFO Science, Maritimes Region
Rabindra Singh DFO Science, Maritimes Region
Ben Zisserson DFO Science, Maritimes Region
Jeremy Broome DFO Science, Maritimes Region
Verna Docherty DFO Resource Management, Maritimes Region
Brady Stevenson DFO Resource Management, Maritimes Region
8Science Response: Stock Status Update
Maritimes Region of American Lobster in LFA 34
Approved by
Alain Vézina
Regional Director of Science
DFO Maritimes Region
Dartmouth, Nova Scotia
Ph. 902-426-3490
Date: October 23, 2020
Sources of Information
DFO. 2021. Assessment of Lobster (Homarus americanus) in Lobster Fishing Area 34. DFO
Can. Sci. Advis. Sec. Sci. Advis. Rep. 2021/015.
This Report is Available from the:
Center for Science Advice (CSA)
Maritimes Region
Fisheries and Oceans Canada
PO Box 1006, 1 Challenger Drive
Dartmouth, Nova Scotia
Canada B2Y 4A2
Telephone: 902-426-7070
Fax: 902-426-5435
E-Mail: MaritimesRAP.XMAR@dfo-mpo.gc.ca
Internet address: www.dfo-mpo.gc.ca/csas-sccs/
ISSN 1919-3769
ISBN 978-0-660-38730-7 N° cat. Fs70-7/2021-018E-PDF
© Her Majesty the Queen in Right of Canada, 2021
Correct Citation for this Publication:
DFO. 2021. Stock Status Update for American Lobster (Homarus americanus) in Lobster
Fishing Area 34 for 2020. DFO Can. Sci. Advis. Sec. Sci. Resp. 2021/018.
Aussi disponible en français :
MPO. 2021. Mise à jour sur l’état du stock de homard d’Amérique (Homarus americanus) dans
la zone de pêche du homard 34 en 2020. Secr. can. de consult. sci. du MPO. Rép. des Sci.
2021/018.
9You can also read