Study of Mass Transfer Behaviour in a PDMS-FTBA Mixed Oxygen Selective Membrane for Li-air Batteries
←
→
Page content transcription
If your browser does not render page correctly, please read the page content below
Int. J. Electrochem. Sci., 16 (2021) Article ID: 210749, doi: 10.20964/2021.07.03

                                                                          International Journal of
                                                                           ELECTROCHEMICAL
                                                                                   SCIENCE
                                                                                 www.electrochemsci.org

Study of Mass Transfer Behaviour in a PDMS-FTBA Mixed
Oxygen Selective Membrane for Li-air Batteries

Jie Li, Linfa Hou, Lihua Luan, Tianyu Zhang, Hong Sun*

School of Mechanical Engineering, Shenyang Jianzhu University, No 25, Hunnan Middle Road,
Shenyang, 110168, China.
*
 E-mail: sunhongwxh@sina.com, lijie@sjzu.edu.cn

Received: 4 March 2021 / Accepted: 27 April 2021 / Published: 31 May 2021

Because they have 10 times the energy density of lithium-ion batteries, Li-air batteries are very
promising for application in electric vehicles. In addition to the materials used in the batteries, oxygen
filtering and internal oxygen transfer resistance are also key issues that need to be resolved to ensure the
application of Li-air batteries. First, in this paper, the molecular dynamics (MD) method and the Monte
Carlo (GCMC) method are employed to study the dissolution and diffusion behaviour of oxygen
molecules and water molecules in the commonly-used oxygen selective membrane with
polydimethylsiloxane (PDMS). To further improve the dissolution and diffusion performance and
analyse the mechanism of internal oxygen transfer, a new type of oxygen selective membrane is prepared
by mixing polydimethylsiloxane (PDMS) and perfluorotributylamine (FTBA). The results show that in
addition to effectively limiting the diffusion behaviour of water molecules, the commonly-used PDMS
membrane also reduces the diffusion ability of oxygen molecules. However, the mixed oxygen
membrane formed by mixing PDMS and FTBA at a mass ratio of 1:3 improves the diffusion performance
of oxygen molecules while limiting the diffusion ability of water molecules, which can enhance the
battery performance while filtering oxygen. This study provides technical support for the transition from
Li-O2 batteries to Li-air batteries.

Keywords: Li-air battery, oxygen selective membrane, molecules, diffusion

1. INTRODUCTION

        Due to their energy density being 10 times that of lithium-ion batteries, lithium-air batteries with
a hybrid of organic electrolytes and water-soluble electrolytes are very promising for application in
electric vehicles [1-7]. At present, most research on Li-air batteries has been carried out in pure oxygen
to avoid interference from impurities in the air. Research on the oxygen-selective membrane of Li-Air
batteries has become one of the most widely applied methods to truly realize the transformation from
Li-O2 batteries to Li-Air batteries [8-10]. In addition to the materials used, the internal oxygen transfer
Int. J. Electrochem. Sci., 16 (2021) Article ID: 210749                                                      2

resistance is also a key issue that needs to be solved to ensure the application of lithium-air batteries.
         Zhang et al. [11] reported that silicone oil has high oxygen solubility, high viscosity, and good
stability and is non-volatile and suitable for Li-Air batteries that run for a long time in an air environment.
The immobilized silicone oil permeated into the porous PTFE material to make an oxygen selective
membrane. The test results showed that the battery worked for approximately 16 days in an air
environment with a relative humidity of 20%, and its specific energy was 2182 Wh kg-1.
         Zhu et al. [12] directly permeated silicon oil into a carbon-coated Li1.3Al0.3Ti1.7(PO4)3 cathode,
thus improving the oxygen penetration area and reducing the oxygen transport distance. Its capacity was
1000 mAhg-1 and it cycled continuously 100 times in air.
         Ruan et al. [13] prepared a new type of waterproof, oxygen-permeable layer by mixing
perfluorocarbide with silicone oil. The first discharge specific capacity of this Li-air battery using the
waterproof and oxygen permeable layer was 4991 mAhg-1 in ambient air with a relative humidity of 68%
and a current density of 0.1 mAcm-2. This value was close to the specific capacity of the Li-O2 battery
of 5363 mAhg-1 and was much higher than that of the non-waterproof oxygen permeable layer, which
was 1936 mAhg-1. In addition, the Li-air battery with the waterproof oxygen permeable layer was stable
over 41 cycles, which was close to the 47 cycles of the Li-O2 battery, while the Li-air battery without the
waterproof oxygen permeable layer only ran for 8 cycles at the same equivalent capacity of 500 mAhg-
1
  .
         At present, the most popular oxygen selective membrane is the PDMS membrane, which has the
highest utilization rate [11-14]. However, although the oxygen selective membrane can play a good
protective role for batteries to some extent, the cathode with the oxygen selective membrane reduces the
permeability and diffusion performance of O2, limiting the power density and capacity of Li-air batteries.
Therefore, it is urgent to develop an oxygen selective membrane with high oxygen permeability to
achieve the efficient utilization of Li-air batteries in an air environment.
         Perfluorotributylamine (FTBA) has high oxygen solubility, high chemical and thermal stability,
and hydrophobicity characteristics [15,16]. A new idea was proposed to make waterproof and oxygen
permeable membranes by mixing PDMS and FTBA to improve the permeability and diffusion
performance of O2. In this study, the dissolution and diffusion behaviour of oxygen and water molecules
in the PDMS membrane and PDMS-FTBA mixed membrane were simulated by using the molecular
dynamics method and Monte Carlo method with Materials Studio software. The optimal proportion of
the PDMS-FTBA mixed membrane was analysed, and the excellent performance of the PDMS-FTBA
mixed membrane was verified. The material and structure of the oxygen selective membrane were
optimized to further improve its performance and lifetime by reducing the internal oxygen transfer
resistance. The results of this research study will be very significant to the application of Li-air batteries
in electric vehicles.

2. MODEL DEVELOPMENT

2.1 Mathematical model

        The Forcite and Sorption modules of Materials Studio (MS) software were employed to carry
Int. J. Electrochem. Sci., 16 (2021) Article ID: 210749 3
out the molecular simulations in this study. Molecular dynamics (MD) methods and Monte Carlo
(GCMC) methods were used for the simulation. In addition, the COMPASS II force field was selected
to strengthen the support for the polymers and heterocyclic systems. Generally, the potential energy of
the interacting particle system can be expressed as the sum of the valence energy Evalence, cross-term
interacting energy Ecrossterm and non-bond interacting energy Enonbond, as shown in equation 1:
Etotal Evalence Ecrossterm Enonbond (1)
2
Evalence K 2 b b0 K 3 b b0 K 4 b b0
3 4
b
H H H
2 3 4
2 0 3 0 4 0
V1 1 cos 10 V2 1 cos 2 20 (2)
V3 1 cos 3 30 K 2
Ecrossterm Fbb b b0 b b0 F 0 0
b b
Fb b b0 0
b
b b0 V1 cos V2 cos 2 V3 cos 3
b
(3)
b b0 V1 cos V2 cos 2 V3 cos 3
b
0 V1 cos V2 cos 2 V3 cos 3
K cos 0 0
qi q j A B
Enonbond 9ij 6ij (4)
i j rij
i j rij rij
where b and b are the bond lengths in equilibrium, and are the bond angles in equilibrium,
is the dihedral torsion angle, is the out-of-plane angle or height, q is the particle charge, is the
dielectric constant, and ij is the i - j particle separation distance; Ki i 2 4 , H i i 2 4 ,
r
i0 i 1 3 , Vi i 1 3 , b0 , b0 , 0 , 0 , K , Fbb , F , Fb , K , Aij and Bij are system-
dependent parameters.
The distribution and size of the free volume are the most direct and important indicators that
affect the microstructure and morphology of the membrane material and its performance. The shape and
interspace of the free volume provide the necessary volume for the diffusion of molecules and determine
the diffusion ability of the molecules in the polymer. The free volume fraction FFV calculation formula
is shown in equation 5.
V V0
FFV (5)
V
where V is the total volume of the system and V0 is the volume occupied by the polymer.
Cohesive energy density (CED) is the energy required by 1 mol of condensate in unit volume to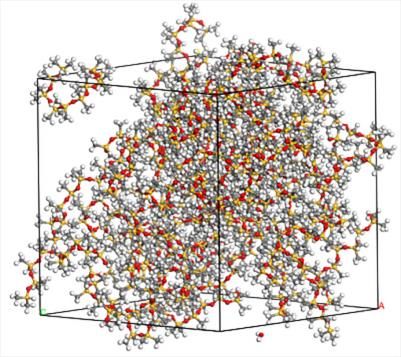
Int. J. Electrochem. Sci., 16 (2021) Article ID: 210749 4
overcome the intermolecular forces for vaporisation, as shown in equation 6. The greater the CED of the
material is, the greater the force between molecules; as the CED increases, the corresponding
permeability is weakened.
H RT
CED V (6)
Vm
where HV is the molar heat of evaporation; RT is the expansion work done during vaporization;
and Vm is the molar volume.
The diffusion coefficient of the substance indicates the amount of gas that passes through a unit
area per unit time in the unit concentration gradient. It is used to describe the speed at which a certain
molecule diffuses through the medium of its system. which is a transfer property of material. According
to Einstein's diffusion law, the diffusion coefficient D is shown in equation 7.
1
D lim
6 t dt
d
ri t ri 0
2
(7)
r t ri 0
2
where i is the mean square displacement (MSD), which represents the parameter of
molecular dynamics; ri t represents the position of the atom at time i; and ri 0 represents the position
of the atom at the initial moment. The diffusion coefficient is 1/6 of the mean square displacement.
The mass of the solvent permeating through the polymer membrane in the osmotic equilibrium
state is called the solubility coefficient, which is a thermodynamic parameter that differs from the
diffusion coefficient. The expression of solubility coefficient is
C
S lim (8)
p 0 p
where C is the concentration of adsorbed gas and p is the pressure.
2.2 Geometric model
All the molecular dynamics simulations described in this article were carried out using Materials
Studio molecular simulation software. Oxygen molecules, water molecules and FTBA molecules were
constructed through the common modules shown in Figure 1(a)(b)(c), and the homopolymer of PDMS
was constructed through homopolymer modules. The monomer structure, the repeating unit and the
initial molecular configuration with the degree of polymerization of 10 are shown in Figure 1(d)(e)(f),
respectively. All the constructed molecules needed to be geometrically optimized to reduce the energy.
Moreover, its geometric optimization employed the smart algorithm to optimize the step size of 5000
steps.
(a) (b) (c)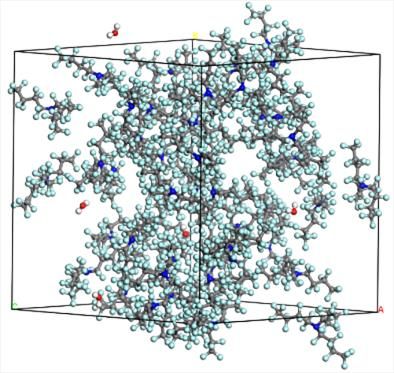
Int. J. Electrochem. Sci., 16 (2021) Article ID: 210749                                                  5

                   (d)                            (e)                              (f)

            H               C              F              N             O                Si

Figure 1. Molecular model. (a) O2 molecular model, (b) H2O molecular model, (c) FTBA molecular
       model, (d) schematic structure of the PDMS repeating unit, (e) initial molecular configuration of
       the PDMS repeating unit, and (f) randomly generated PDMS molecular model with a degree of
       polymerization of 10.

     Four different ratios of waterproof and oxygen-permeable membrane systems were built by the
Amorphous Cell module, and the initial modelling parameters are shown in Table 1 for details.

Table 1. Initial modelling parameters

          Composition           Repeat units of                                  Initial density
                                                           Number
            Weight                 PDMS                                              (g/cm3)
            PDMS                     10                50PDMS/5O2                      0.97
            PDMS                     10               50PDMS/5H2O                      0.97
        PDMS:FTBA=1:1                10            26PDMS/29FTBA/5O2                   1.26
        PDMS:FTBA=1:1                10           26PDMS/29FTBA/5H2O                   1.26
        PDMS:FTBA=1:3                10            12PDMS/40FTBA/5O2                   1.40
        PDMS:FTBA=1:3                10           12PDMS/40FTBA/5H2O                   1.40
            FTBA                     10                50FTBA/5O2                      1.54
            FTBA                     10               50FTBA/5H2O                      1.54

2.3 Model Optimization

        The structure was optimized to reduce the energy of the entire system after the model was initially
built. The Smart algorithm was employed for structure optimization, and the step size was optimized to
10,000 steps. Annealing with 5 cycles was carried out to better relax the atomic configuration. During
each cycle, the temperature was raised from 300 K to 600 K and then decreased back to 300 K. In
addition, the Forcite module was first used to perform the NPT simulation at 298 K for 500 ps to obtain
a stable system density. Finally, the NVT isothermal and constant volume dynamics simulation was
performed at 298 K with a time step of 3 fs, and the total of the simulated steps was set to 3 million. The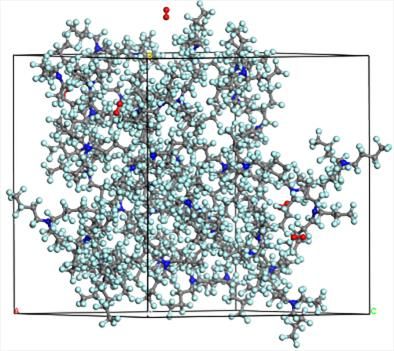
Int. J. Electrochem. Sci., 16 (2021) Article ID: 210749 6
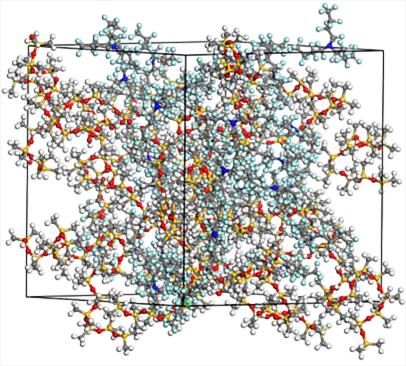
trajectories of molecules were recorded for analysis. The optimized molecular hybrid system of H2O-
PDMS and O2-PDMS is shown in Figure 2 (g, j); the optimized molecular hybrid system of H2O-
PDMS/FTBA and O2-PDMS/FTBA (the mass ratio of PDMS and FTBA was 1:1) is shown in Figure
2(h,k); and the optimized molecular hybrid system of H2O-FTBA and O2-FTBA is shown in Figure 2(i,l).
(g) (h) (i)
(j) (l)
(k)
Figure 2. Optimized molecular hybrid system. (g) Geometrically optimized H2O-PDMS mixed system
(h) Geometrically optimized H2O, PDMS, FTBA mixed system (the mass ratio of PDMS to
FTBA is 1:1) (i) Geometrically optimized H2O-FTBA mixed system (j) Geometrically optimized
O2-PDMS mixed system (k) Geometrically optimized O2, PDMS, FTBA mixed system (the mass
ratio of PDMS to FTBA is 1:1) (l) O2-FTBA hybrid system after geometric optimization.
2.4 Model reliability and stability analysis
Sorption module simulation results showed that the solubility coefficient of oxygen in the system
was 0.6×10⁻² cm3·cm-3·cmHg-1, which was at the same order of magnitude as the solubility coefficient
of oxygen in the PDMS simulations performed by Kikuchi[17] and Merkel[18] (as shown in Table 2).
In addition, the simulation results of the Forcite module showed that the diffusion coefficient of oxygen
in the system was 2.09×10⁻⁵ cm2/s, which was of the same order of magnitude as the diffusion coefficient
of oxygen in the PDMS simulations performed by Kikuchi[17] and Charati[19]. (as shown in Table 2).
Therefore, it was indicated that this model and the simulation were reliable.
Int. J. Electrochem. Sci., 16 (2021) Article ID: 210749                                                   7

Table 2. Solubility coefficient and diffusion coefficient of oxygen in PDMS

                                This work                   Kikuchi[17]                 Merkel[18]
Solubility coefficient   0.6×10 cm3·cm-3·cmHg-1
                                -2
                                                       7.94×10⁻⁶ cm3·cm-3·Pa-       0.18 cm3·cm-3·atm-1
                                                                   1

                                 This work                   Kikuchi[17]                Charati[19]
diffusion coefficient         2.09×10⁻⁵ cm2/s               3.1×10⁻⁵ cm2/s           2.0×10⁻⁵~8.0×10⁻⁵
                                                                                          cm2/s

        To prevent sudden changes in energy and temperature during the calculation process, it was
necessary to optimize the dynamics of the constructed system. Figure 3(a) and (b) show the stability of
energy and temperature in the process of dynamic optimization. The results showed that with the increase
of the simulation step length, the energy of the system tended to a stable state, the temperature fluctuated
up and down on the set value, and the overall system is reached in a stable state in the end. The potential
energy, non-bond energy and temperature of the four systems fluctuated less than 5% with increasing
simulated step size, which means that all four systems reached a thermodynamically stable state within
a 3000 ps time step. Therefore, the simulation could be carried out if the system energy and temperature
were stable while ensuring the validity of the model.

Figure 3. (a) Energy change during dynamic optimization (b) Temperature change during dynamic
      optimization

3. RESULTS AND DISCUSSION

        In this study, a modified oxygen selective membrane combining FTBA material and common
material PDMS was proposed to analyse the diffusion properties of the membrane system and its internal
components under mixed conditions of different proportions and to clarify whether FTBA could
effectively improve the mass transfer performance of Li-air batteries. The cohesive energy density and
the adsorption energies were analysed for four kinds of samples with different proportions. With
increasing FTBA content, the diffusion capacities of both water and oxygen molecules gradually
increased, and the diffusion capacities of oxygen were greater than those of water molecules. Finally,
Int. J. Electrochem. Sci., 16 (2021) Article ID: 210749                                                 8

the optimal proportion of PDMS and FTBA was obtained by analysing the free volume, diffusion
coefficient and movement trajectory of water and oxygen molecules.

3.1 Cohesive Energy Density

        Table 3 shows the cohesive energy density of the four membrane materials. The intermolecular
forces and the degree of stacking of chain segments were reflected by the cohesive energy density (CED).
The larger the CED is, the stronger the intermolecular interaction force and the lower the permeability
of small gas molecules in the membrane material. According to Table 4, as the content of FTBA increased,
the cohesive energy density of the four membrane materials decreased in turn, while the permeability of
the membrane material increased as its cohesive energy density decreased. Therefore, it was indicated
that the addition of FTBA was beneficial to the transportation and diffusion of small gas molecules.

Table 3. Cohesive energy density of PDMS/FTBA blends in different proportions

    PDMS/FTBA              PDMS          PDMS:FTBA=1:1           PDMS:FTBA=1:3               FTBA
 CED/(107 J·m-3)            17.14               16.98                  14.50                 13.26

3.2 Adsorption Energy

        Figure 4 and Figure 5 show the energy distribution curves of water and oxygen molecules in the
adsorption equilibrium of the four membrane materials. The abscissa is the adsorption energy, and the
ordinate is the Poisson distribution of energy. The most likely energy distributions of water for the four
membrane materials are -4.65, -4.15, -3.45 and -3.15 kcal/mol, respectively, as shown in Figure 4, while
the most likely energy distributions of oxygen are -2.75, -2.45, -1.85 and -1.45 kcal/mol, respectively,
as shown in Figure 5. The results showed that the adsorption energy of water and oxygen molecules in
the membrane material gradually decreased as the content of FTBA increased, which indicated that the
movement of water and oxygen molecules in the membrane material gradually accelerated, and the
binding ability between oxygen and water molecules also gradually weakened. Thus, the oxygen and
water molecules adsorbed inside the membrane material could overcome the interaction with the
surrounding molecules and escape. This result indicated that the diffusion capacity of the water and
oxygen molecules gradually improved with increasing FTBA content. It is worth mentioning that the
adsorption energy of water molecules in the membrane material was much higher than that of the oxygen
molecules in the membrane material. The movement of the water molecules was much smaller than that
of the oxygen molecules, indicating that the diffusion ability of oxygen was greater than that of water
molecules.
Int. J. Electrochem. Sci., 16 (2021) Article ID: 210749                                            9

                        Figure 4. H2O-PDMS/FTBA energy distribution curve

                         Figure 5. O2-PDMS/FTBA energy distribution curve

3.3 Free volume

       The authors used the Atom Volumes & Surfaces tools and spherical probes with radii of 1.35 Å
and 1.52 Å to continuously roll to form the Connolly surface, which effectively simulated the free
volume of water or oxygen in the membrane medium; then, they calculated the free volume fractions
(FFV) of the four membrane materials. Table 4 shows that the largest free volume fraction of the four
membrane materials obtained by the simulation was for a single FTBA sample, followed by a mixed
material composed of PDMS and FTBA, and the smallest was for a single PDMS sample.

Table 4. FFV of PDMS/FTBA blends in different proportions

         PDMS/FTBA             PDMS        PDMS:FTBA=1:1 PDMS:FTBA=1:3               FTBA
             RP=1.35Å          17.23           19.61         26.79                   36.11
       FFV/%
             RP=1.52Å          13.77           15.61         23.98                   34.82
Int. J. Electrochem. Sci., 16 (2021) Article ID: 210749                                               10

        However, the mixed material sample composed of PDMS:FTBA=1:3 and a single FTBA sample
had a larger free volume with a dense distribution of a large number of cavities from a microscopic point
of view (the pore morphology of the four membrane materials is shown in Figure 6). This morphology
was conducive to the diffusion and permeation of gas molecules. However, the cavity volume of the
single PDMS sample was small, and the distribution was relatively sparse, which was not conducive to
the diffusion and penetration of gas molecules.
         It is worth noting that the free volume of the membrane had a wide diffusion range but was
excessively concentrated if the sample was composed of only FTBA, which was not conducive to
diffusion. The distribution of the free volume showed an excessive concentration, while the particles
were also in a state of aggregation due to the great increase in interaction if the single FTBA material
was employed, which limited the diffusion and was not conducive to the reaction. The free volume of
oxygen increased by 74%, while the water increased by 55% if the mixed material sample was composed
of PDMS:FTBA=1:3 according to the specific data in Table 4. Therefore, PDMS:FTBA=1:3 was the
best choice for the mixed membrane material because it enabled obvious diffusion and maintained
uniform distribution in the system.

              (a)H2O

              (b)O2

              PDMS             PDMS:FTBA=1:1          PDMS:FTBA=1:3                 FTBA

Figure 6. Free volume topography of PDMS/FTBA blends with different ratios. (a) R P=1.35 Å; (b)
       RP=1.52 Å (the blue area is the free volume)

3.4 Adsorbing capacity and solubility coefficient

        The adsorption isotherms of water molecules and oxygen molecules in the four membrane
materials were calculated in the pressure range of 1 kPa~101 kPa, as shown in Figure 7 and Figure 8. It
can be seen from the figure that the absorption of gas by the rubbery polymer PDMS increased linearly
as the pressure increased, indicating that this adsorption was Henry adsorption, which was the same as
the conclusion reached in previous literature [20]. The solubility coefficient S was obtained by
Int. J. Electrochem. Sci., 16 (2021) Article ID: 210749 11
substituting the data into equation (8). The amount of gas adsorbed in the material was proportional to
the solubility coefficient of the gas in the material. The greater the amount of gas adsorbed in the material
was, the greater the solubility coefficient of the gas in the material. The order of adsorption capacity of
gas in the four membrane materials simulated in this paper is consistent with the order of solubility
coefficient in the simulation calculation, as shown in Table 5. It can be seen from the table that the
solubility coefficient of oxygen in PDMS is 0.6×10⁻² cm3·cm-3·cmHg-1, and the calculated result is
similar to Kikuchi's 7.94×10⁻⁶ cm3·cm-3·Pa-1[17] and Merkel's 0.18 cm3·cm-3·atm-1[18]. The solubility
coefficient of water and oxygen molecules in the membrane material gradually decreased as the content
of FTBA increased, which indicated that the transmission of water and oxygen molecules in the
membrane material increased and that the dissolution was less.
Table 5. Solubility coefficients of water and oxygen in different proportions of PDMS/FTBA blends
PDMS:FTBA= PDMS:FTBA
PDMS/FTBA PDMS FTBA
1:1 =1:3
Solubility Coefficient S H2O 3.75 1.88 1.28 0.98
(10-2cm3·cm-3·cmHg-1) O2 0.60 0.43 0.30 0.29
However, the solubility coefficient of water molecules was larger than that of oxygen molecules,
as shown in Figure 7, indicating that the diffusion transport performance of water molecules in
membrane materials was lower than that of oxygen molecules in the membrane materials. The
dissolution capacity of oxygen barely changed when the amount of FTBA increased to 1:3 or exceeded
this ratio, as shown in Figure 8. The results also proved that the diffusion capacity of oxygen was
basically stable if the ratio of PDMS and FTBA was equal to 1:3. Furthermore, the above conclusions
were verified, and PDMS:FTBA=1:3 was the best choice for mixing the membrane materials.
Figure 7. H2O-PDMS/FTBA adsorption isothermInt. J. Electrochem. Sci., 16 (2021) Article ID: 210749 12
Figure 8. O2-PDMS/FTBA adsorption isotherm
3.5 Diffusion Coefficient
Table 6 shows the diffusion coefficients of water and oxygen in different ratios of PDMS/FTBA
blends. The results indicated that the diffusion coefficients of both water and oxygen molecules in the
membrane material gradually increased as the content of FTBA increased.
Table 6. Diffusion coefficients of water and oxygen in different proportions of PDMS/FTBA blends
PDMS/FTBA PDMS PDMS:FTBA=1:1 PDMS:FTBA=1:3 FTBA
Diffusion H2O 1.42 1.98 2.02 4.20
Coefficient D
(10-5cm2/s) O2 2.09 3.04 6.60 7.06
Figures 9 and 10 show the mean square displacement curves of water and oxygen molecules in the
four membrane materials. The overall trend of the results showed that the slope of the mean square
displacement curve increased as the content of FTBA increased, which indicated that the corresponding
diffusion coefficient was constantly increasing. The diffusion coefficient calculated in this paper is
shown in Table 6. The diffusion coefficient of oxygen in PDMS is 2.09×10⁻⁵ cm2/s, and the calculated
result is similar to Kikuchi's 3.1×10⁻⁵ cm2/s[17] and Charati's 2.0×10⁻⁵~8.0×10⁻⁵ cm2/s[19].
While the diffusion coefficient of oxygen in the membrane material increased greatly, the
diffusion coefficient of water molecules in the membrane material was also increased by more than 3
times compared with that of the pure PDMS membrane material when the membrane material was pure
FTBA. The diffusion coefficient of water molecules in the membrane material was not significantly
higher than that in the pure PDMS membrane material when PDMS:FTBA=1:3, while the diffusion
coefficient of oxygen molecules in the membrane material was more than 3 times higher than that in the
single PDMS membrane material and was close to the diffusion coefficient in the membrane materialInt. J. Electrochem. Sci., 16 (2021) Article ID: 210749 13
with only FTBA. In addition, the diffusion coefficient of oxygen was approximately 1.47 times that of
water when pure and single PDMS materials were employed, while the diffusion coefficient of oxygen
was approximately 3.27 times that of the water diffusion coefficient when PDMS:FTBA=1:3. Therefore,
when PDMS:FTBA=1:3, it can be used as a waterproof and oxygen-permeable membrane material for
lithium-air batteries; moreover, pure materials with only FTBA are not the best choice for acting as
waterproof materials.
Figure 9. H2O-PDMS/FTBA mean square displacement curve
Figure 10. O2-PDMS/FTBA mean square displacement curve
3.6 Motion Trajectory
The diffusion of water and oxygen in the PDMS/FTBA blends was in a jumping diffusion state.
The channel between the holes was closed, and the gas molecules entered the lower hole through the
new hole after the gas jumped from one hole to an adjacent hole. Therefore, in addition to the maximum
motion range, the degree of molecules motion dispersion was also analysed from the motion trajectory
results. The more dispersed the molecular movement was, the more irregular the movement was, which
was not conducive to the uniform diffusion movement of molecules.
Figures 11(a) and (b) show the trajectories of water and oxygen in different proportions ofInt. J. Electrochem. Sci., 16 (2021) Article ID: 210749 14
PDMS/FTBA blends. The range of movement of molecules in the material gradually increased as the
content of FTBA increased. The range of motion of water molecules in the material did not increase
much compared to the pure PDMS material. The dispersion of oxygen was not changed strongly when
PDMS:FTBA=1:3, while the range of motion of the oxygen molecules in the material was close to that
in the pure FTBA membranes. Therefore, it can be considered that the performance of the waterproof
and oxygen-permeable layers of the PDMS/FTBA blend material reached the optimum efficiency when
PDMS:FTBA=1:3. In addition, Ruan et al.[13] recently mixed perfluorocarbon (PFC) and PDMS into a
waterproof and oxygen-permeable layer. The experimental results showed that the hybrid waterproof
oxygen permeable layer had better electrochemical properties than the pure PDMS membrane, which is
consistent with the simulated results.
(a)H2O
(b)O2
PDMS PDMS:FTBA=1:1 PDMS:FTBA=1:3 FTBA
Figure 11. Trajectory diagram of PDMS/FTBA blends with different proportions. (a) H2O;(b) O2
4. CONCLUSION
This study constructed a microscopic mass transfer model of a waterproof, oxygen-permeable
PDMS-FTBA layer based on the COMPASS II force field. Molecular dynamics and Monte Carlo
methods were used to analyse the transfer process of water and oxygen molecules in four different ratios
of PDMS/FTBA blends. The mass transfer efficiency of the waterproof and oxygen-permeable layer was
evaluated in terms of the material transfer channel, the energy change of the model system, and the
dissolution and diffusion of the material, and the following conclusions were obtained;
1) Through the analysis of the adsorption and dissolution performance of water and oxygen
molecules in PDMS/FTBA materials, it was found that the addition of FTBA could effectively reduce
the adsorption energy and solubility coefficient of the membrane materials to raise the molecular mass
transfer, which especially improved the diffusion efficiency of oxygen. Increasing the proportion of
FTBA significantly enhanced the ability to promote the transfer of oxygen molecules compared withInt. J. Electrochem. Sci., 16 (2021) Article ID: 210749 15
that of water molecules; hence, the PDMS-FTBA mixed membrane had the characteristics of
waterproofness and oxygen permeability.
2) The cohesive energy density of the membrane system decreased as the proportion of
FTBA increased, which showed an increasingly loose state. The barrier capacity of the material
decreased as the content of FTBA increased, which was better for the mass transfer and diffusion of
oxygen molecules. In addition, as the free volume fraction increased, the amount of gas that was
contained also increased, which provided favourable conditions for the self-diffusion movement of
molecules. Thus, adding FTBA could effectively increase the free volume fraction for oxygen molecules.
3) When PDMS:FTBA=1:3, the diffusion coefficient of water molecules increased by 40%
compared with that in the pure PDMS membranes, while the diffusion coefficient of oxygen molecules
increased by more than 300% compared with that in the pure samples; this increase was close to the
result obtained from the pure FTBA sample. Moreover, the diffusion coefficient of oxygen was
approximately 1.47 times higher than that of water in the case of pure PDMS, and in the case of
PDMS:FTBA=1:3, the diffusion coefficient of oxygen was approximately 3.27 times higher than that of
water. Therefore, waterproof and oxygen permeable layer materials could be employed for the practical
application of Li-air batteries if PDMS:FTBA=1:3 based on the above performance analysis.
ACKNOWLEDGMENTS
This research was supported by the National Natural Science Foundation of China (51906166, 51776131)
and the Department of Education of Liaoning Province (XLYC1802045, lnzd201902).
References
1. T. L. Kulova, V. N. Fateev, E. A. Seregina, A. S. Grigoriev, International Journal of
Electrochemical Science, 15 (2020) 7242-7259.
2. Y. F. Ma, International Journal of Electrochemical Science, 15 (2020) 10315-10329.
3. H. L. Li, T. Zhang, Z. Yang, Y. L. Shi, Q. C. Zhuang, Y. H. Cui, International Journal of
Electrochemical Science, 16 (2021) 210229.
4. F. X. Chen, L. B. Yu, S. S. Liu, C. J. D. Monthe, M. Wu, X. B. Jiang, Z. F. Yuan, International
Journal of Electrochemical Science, 16 (2021) 210332.
5. M. A. Rahman, X. Wang, C. Wen, Journal of Applied Electrochemistry, 44 (2014) 5-22.
6. J. Lu, L. Li, J. B. Park, Y. K. Sun, F Wu, K Amine, Chemical reviews, 114 (2014) 5611-5640.
7. H. D. Lim, H. Song, J. Kim, H. Gwon, Y. Bae, K. Y. Park, J. Hong, H. Kim, T. Kim, Y. H. Kim, X.
Lepró, R. Ovalle-Robles, R. H. Baughman, K. Kang, Angewandte Chemie, 126 (2014) 4007-4012.
8. U. R. Farooqui, A. L. Ahmad, N. A. Hamid, Renewable & Sustainable Energy Reviews, 77 (2017)
1114-1129.
9. U. Sahapatsombut, H. Cheng, K. Scott, Journal of Power Sources, 249 (2014) 418–430.
10. X. Zhang, L. Hua, E. Yang, Z. An, J. Chen, International Journal of Electrochemical Science, 7
(2012) 10562-10569.
11. J. Zhang, W. Xu, W. Liu, Journal of power sources, 195 (2010) 7438-7444.
12. X. B. Zhu, T. S. Zhao, Z. H. Wei, P. Tan, L. An, Energy & Environmental Science, 8 (2015) 3745-
3754.
13. Y. Ruan, J. Sun, S. Song, L. Yu, B. Chen, W. Li, X. Qin, Electrochemistry Communications, 96
(2018) 93-97.
14. J. Amici, M. Alidoost, C. Francia, S. Bodoardo, S. Martinez, D. Amantia, M. Biasizzo, F. Caldera,Int. J. Electrochem. Sci., 16 (2021) Article ID: 210749 16
F. Trotta, Journal of Applied Electrochemistry, 52 (2016) 13683-13686.
15. Y. F. Wang, D. Zheng, X. Q. Yang, D. Y. Qu, Energy & Environmental Science, 4 (2011) 3697-
3702.
16. O. Crowther, M. Salomon, Membranes,2 (2012) 216-227.
17. H. Kikuchi, M. Fukura, Kautschuk Gummi Kunststoffe, 57 (2004) 416-422.
18. T. C. Merkel, V. I. Bondar, K. Nagai, B. D. Freeman, I. Pinnau, Journal of Polymer Science Part B
Polymer Physics, 38 (2000) 415-434.
19. S. G. Charati, S. A. Stern, Macromolecules, 31 (1998) 5529-5535.
20. X. Duthie, S. Kentish, C. Powell, K. Nagai, G. Qiao, G. Stevens, Journal of Membrane Science,
294 (2007) 40-49.
© 2021 The Authors. Published by ESG (www.electrochemsci.org). This article is an open access
article distributed under the terms and conditions of the Creative Commons Attribution license
(http://creativecommons.org/licenses/by/4.0/).You can also read