Supplement of Size-resolved atmospheric ice-nucleating particles during East Asian dust events
←
→
Page content transcription
If your browser does not render page correctly, please read the page content below
Supplement of Atmos. Chem. Phys., 21, 3491–3506, 2021
https://doi.org/10.5194/acp-21-3491-2021-supplement
© Author(s) 2021. This work is distributed under
the Creative Commons Attribution 4.0 License.

Supplement of
Size-resolved atmospheric ice-nucleating
particles during East Asian dust events
Jingchuan Chen et al.

Correspondence to: Zhijun Wu (zhijunwu@pku.edu.cn)

The copyright of individual parts of the supplement might differ from the CC BY 4.0 License.
1. Supplementary Tables

 Table S1. The criteria used to distinguish between dust and non-dust events for 14 sets of samples.
 The two weather conditions, i.e., dust and non-dust events, were defined based on PM10 mass concentration (PM10 Mass Conc.),
25 the volume concentration of coarse mode particles (Vol. Conc.), phenomenological dust storm observations operated by China
 Meteorological Administration (Observations by CMA), and the concentration of aluminium (Al).

 Sample PM10 Mass Observations by Concentration of Al Weather
 Vol. Conc.2
 ID Conc. 1
 CMA 3
 element (μg m )-3 4
 condition

 M1 True True True 5.65 Dust
 M2 True True True 1.68 Dust
 M3 True True True 0.72 Dust
 M4 True False False 0.04 Non-dust 5
 M5 True False True 0.12 Dust
 M6 True True True 1.45 Dust
 M7 True True True 1.07 Dust
 M8 True True True 1.01 Dust
 D2 True True True 0.14 Dust
 D3 True True True 0.77 Dust
 D4 True True True 0.39 Dust
 D5 True True True 0.59 Dust
 D6 False False True 0.13 Dust
 D7 True False True 0.17 Dust
 Note: The weather condition of each sample was defined by a combination of the above four factors.
 1
 PM10 mass concentration: ‘True’ was defined as PM10 mass concentration larger than 200 μg m-3 for more than 2 hours.
 2
 The volume concentration of the coarse mode particles (> 1 μm): ‘True’ was defined for mean concentration higher than 75
30 μm3 cm-3. The threshold was developed based on the measurements of 2004-2006 in Beijing. Asian dust loading has declined
 in recent years. Thus, this threshold is not mandatory.
 3
 Phenomenological dust storm observations: China Meteorological Administration (CMA) provides predictions and
 observations on dust storm events that occurred in China. The dust events in Beijing identified in this study have been reported
 as the largescale dust storm events.
 4
35 Aluminium (Al) is usually selected to be an indicator of mineral dust because it is one of the most abundant constant elements
 in deserts. Thus, the concentration of Al is considered as an important factor to define dust events.

 2

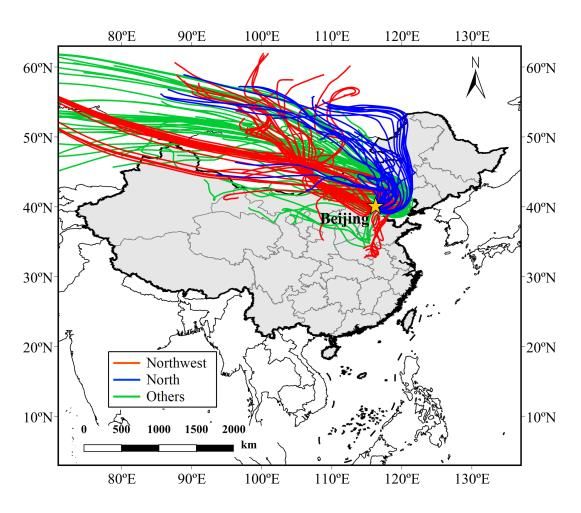
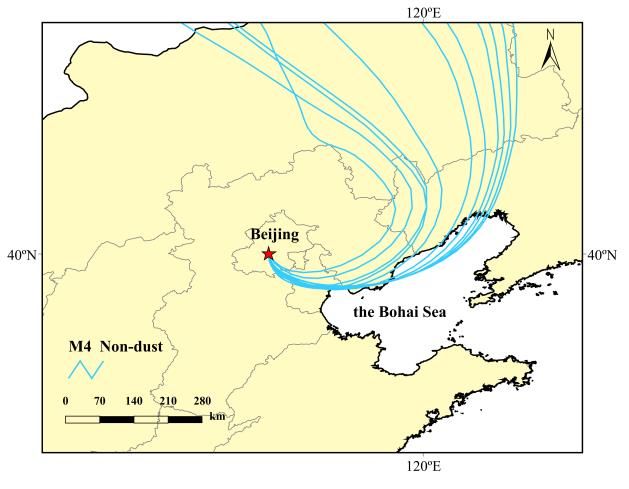
5
 Sample M4 was collected from the end of a continuous dust storm (M1, M2, and M3), i.e., during the removal process after
 a dust storm. High wind speeds can blow up large particles from the roads and other surfaces in the city. In addition, the air
 mass of M4 passed through the Bohai Sea before arriving in Beijing (Fig. S1), possibly bringing large marine particles.
40 Although the average concentration of PM10 for sample M4 was higher than those of samples M5 and D6, the concentration
 of Al in sample M4 was much lower compared to sample M5 and D6. Therefore, we classify sample M4 as a non-dust event,
 since it’s not dominated by mineral dust.

45

50

55

60

65

 3
70 Table S2. The INP concentrations for 8 particle sizes at different temperatures. Three criteria (average concentration (Average),
 standard deviation (STD), and valid sample number (Sample Num)) based on 13 dust dominated samples are presented for
 each particle size. Large size particles start and complete freezing at warmer temperatures than small particles. At a given
 temperature, not all 13 samples may begin to freeze, while some samples may be completely frozen. Therefore, the valid
 sample number for the 8 particle sizes presented here at various temperatures is less than or equal to 13.
 Particle Temperature (℃) & INP concentrations (L-1)
 Type
 size (μm) -8 -10 -13 -15 -18 -20 -23
 Average 0.055 0.150 0.481 0.786 2.244 3.904 7.577
 10.0 STD 0.066 0.198 0.627 0.890 1.673 2.297 4.527
 Sample Num 9 11 11 11 11 8 3
 Average 0.117 0.247 0.615 1.030 2.395 3.913 4.542
 5.6 STD 0.212 0.437 1.004 1.553 1.987 2.943 3.621
 Sample Num 9 13 13 13 12 9 3
 Average 0.064 0.184 0.552 0.993 2.830 4.228 8.722
 3.2 STD 0.117 0.211 0.537 1.031 2.300 2.916 /
 Sample Num 11 12 13 13 13 9 1
 Average 0.042 0.119 0.329 0.618 2.059 3.289 4.121
 1.8 STD 0.064 0.147 0.340 0.540 1.714 2.518 3.373
 Sample Num 9 12 12 12 13 10 5
 Average 0.028 0.065 0.156 0.289 1.005 2.610 4.017
 1.0 STD 0.025 0.053 0.145 0.272 0.867 2.206 3.388
 Sample Num 6 10 12 12 13 12 5
 Average 0.012 0.025 0.048 0.096 0.429 1.574 3.686
 0.56 STD 0.004 0.016 0.036 0.076 0.297 1.092 3.768
 Sample Num 2 10 13 13 13 12 5
 Average 0.010 0.021 0.040 0.059 0.275 1.143 1.481
 0.32 STD 0.006 0.018 0.045 0.066 0.359 1.821 0.920
 Sample Num 2 4 10 11 13 12 5
 Average 0.010 0.009 0.016 0.022 0.081 0.226 0.286
 0.18 STD 0.006 0.005 0.014 0.028 0.090 0.280 0.125
 Sample Num 2 3 7 9 11 10 4
75

 4
Table S3. The average percentage of heat-resistant and heat-sensitive INPs of the overall INP populations ( 50 ≥ 1.0 μm) at
 three different temperatures. The indicated uncertainties correspond to the standard deviation of 12 samples at each temperature.
 Temperature (℃) & Average concentration proportion
 Type
 -10 ℃ -15 ℃ -20 ℃
 Heat-sensitive INPs 81 ±12% 70 ±15% 38 ±21%
 Heat- resistant INPs 19 ±12% 30 ±15% 62 ±21%

80

 Table S4. The average percentage of heat-resistant and heat-sensitive INPs of the size-resolved INPs ( 50 = 10.0, 5.6,
85 3.2, 1.8 1.0 μm) at different temperatures. The valid sample number (Sample Num) presented in the table is less than or
 equal to 12 because the results are based on 12 samples.
 Particle size (μm) & Concentration proportion
 Temperature (℃) Type
 10.0 5.6 3.2 1.8 1.0
 Heat-sensitive INPs 80% 78% 82% 89% 84%
 -10 Heat- resistant INPs 20% 22% 18% 11% 16%
 Sample Num 10 12 11 11 9
 Heat-sensitive INPs 75% 64% 71% 75% 70%
 -15 Heat- resistant INPs 25% 36% 29% 25% 30%
 Sample Num 10 12 12 11 11
 Heat-sensitive INPs 33% 27% 34% 35% 66%

 -20 Heat- resistant INPs 67% 73% 66% 65% 34%

 Sample Num 10 12 12 12 12

90

 5
Table S5. The average percentage of heat-resistant and heat-sensitive INPs of the northwest and north samples ( 50 ≥ 1.0 μm)
 95 at two temperatures. The indicated uncertainties correspond to the standard deviation of samples in the same pathways.
 Sample type & Average concentration proportion
 Temperature (℃)
 NW-HR1 NW-HS2 N-HR3 N-HS4

 -10 ℃ 12 ±2% 88 ±2% 31 ±19% 69 ±19%
 -15 ℃ 21 ±3% 79 ±3% 46 ±20% 54 ±20%
 Note:
 1
 NW-HR: Heat-resistant INPs of the northwest samples ( 50 ≥ 1.0 μm, sample M6, M7, M8 and D7, the same below);
 2
 NW-HS: Heat-sensitive INPs of the northwest samples;
 3
 N-HR: Heat-resistant INPs of the north samples ( 50 ≥ 1.0 μm, sample M3 and D6, the same below);
 4
100 N-HS: Heat-sensitive INPs of the north samples;

105

110

115

 6
120 2. Supplementary Figures

 Figure S1. Back trajectory of the air mass for sample M4 (solid blue lines), which went through the Bohai Sea before arriving
 in Beijing.

125

 Figure S2. Air mass trajectories for different samples originated from the northwest (M6, M7, M8 and D7; solid red lines),
 north (M3, M5 and D6; solid blue lines) and other (M1, M2, D2, D3, D4 and D5; solid green lines) transport pathways.

 7
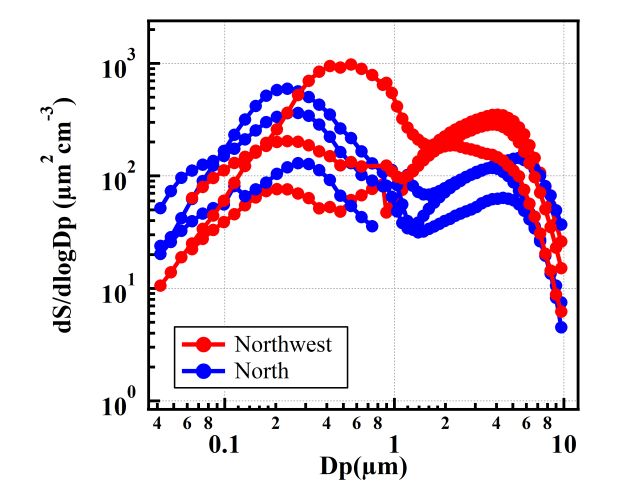
130 Figure S3. Surface area distributions of the northwest (M6, M7, M8 and D7) and north (M3, M5 and D6) transport pathways
 averaged over the respective sampling periods. is the aerodynamic diameter of the particles. The surface area spectrum of
 the sample D7 is partially missing, and is not shown here.

135 Figure S4. Comparison of nucleation activity of northwest and north samples after heat treatment. Northwest and north
 samples are named “Heated”, and marked as solid light yellow/green circles, respectively. The average ( ) of the samples
 in the same pathway are illustrated as solid lines with corresponding colors.

 8
140 3. Supplementary Methods

 Particle washing removal efficiency

 We did an experiment of particle washing removal efficiency to ensure that particles were washed off the filters, as depicted
 in Fig. S5. The tested filter was collected from a dust event in 2018, and all the extraction processes were the same as those
 described in the manuscript except for the extraction time. This Nuclepore filter was completely submerged in 20 mL
145 double-distilled water (resistivity of 18.2 MΩ·cm at 25 ℃) and was extracted by an ultrasonic shaker for 15 minutes to get
 the sample called “15 min - 1st” in Fig. S5. Then the filter was removed from the washed suspension and was immersed in a
 fresh 20 mL double-distilled water for a second extraction cycle to obtain the sample called “15 min - 2nd”. The sample “15
 min - 3rd” was produced similarly in a third extraction cycle.

150 Figure S5. Particle washing removal efficiency experiments. The brown, orange and light orange bars represent the frozen
 fraction ( ) of the solution at different temperatures after the first, second, and third ultrasonic treatment, respectively. As
 comparisons, the grey and blue bars are the droplet freezing experiments for blank filter and distilled water, respectively.

 The freezing of the three samples indicated that most of the particles were extracted efficiently in the first cycle, which had
155 higher frozen fractions at higher temperatures than rest of the samples. Indeed, some of the particles remained over the filter,
 but a longer extraction periods would not impact the freezing results, since there was only minor overlap between their freezing
 temperatures. Therefore, 15-minute ultrasound treatments for twice (i.e., 30 minutes) can wash all ice active materials off the
 filters.

 9
160 Determination of surface ice active site density ( ( ))

 The surface ice active site density, ( ),was derived from our measured data, as described in our manuscript. As a key
 parameter, the particle diameter (i.e., particle surface area) is a main uncertainty source for the calculation of ( ), and the
 particle diameter should be specified when comparing the ( ) values among different studies.
 Two main diameters, geometric and BET-inferred diameters (derived from BET surface, a gas adsorption technique, Brunauer
165 et al., 1938), were adopted in calculating ( ), although some studies did not mention which particle sizes they used. It is
 clear that the BET-inferred surface area is typically larger than simplified spherical estimation, resulting in a lower ( )
 value if employed (Hiranuma et al., 2015).
 We evaluated the bias of the results calculated using aerodynamic and geometric diameter. The geometric diameter can be
 converted from its aerodynamic diameter as:

 g
170 ae = √
 0 ae

 where ae is aerodynamic diameter, is geometric diameter (i.e., the volume equivalent diameter), 0 is unit density (1 g
 cm-3), is the particle density, is the dynamic shape factor, and ae are the Cunningham slip correction factors
 associated with the geometric and aerodynamic diameters, respectively.

175 Table S6. The deviation of calculations between the geometric and aerodynamic diameters

 (g cm-3) ( )a

 2.6 1.1 ae = 0.65 ae , = 2.36 , , = 0.42 ,
 2.0 1.1 ae = 0.74 ae , = 1.82 , , = 0.55 ,
 1.8 1.1 ae = 0.78 ae , = 1.64 , , = 0.61 ,
 1.5 1.1 ae = 0.86 ae , = 1.36 , , = 0.74 ,
 2.6 1.4 ae = 0.73 ae , = 1.86 , , = 0.54 ,
 2.0 1.4 ae = 0.84 ae , = 1.43 , , = 0.70 ,
 1.8 1.4 ae = 0.88 ae , = 1.29 , , = 0.78 ,
 1.5 1.4 ae = 0.97 ae , = 1.07 , , = 0.93 ,
 a
 , and , are the surface ice active site densities associated with the geometric and aerodynamic diameters, respectively.

 Table S6 shows the results of calculations using different particle densities ( = 1.5 - 2.6 g cm-3) and dynamic shape factors
 ( = 1.1 - 1.4, Niemand et al., 2012) when the slip correction factor is not considered. At a given particle density and

 10
180 dynamic shape factor, is 0.65 to 0.97 times ae , and , is 1.07 to 2.36 times , . Therefore, our ( ) derived from
 the aerodynamic diameter is 0.42 to 0.93 times the value of ( ) determined by the converted geometric diameter.
 We choose to use the aerodynamic diameter rather than the converted geometric diameter to derive the ( ) values for
 three reasons. First, the conversion between aerodynamic and geometric diameters requires knowledge of particle density
 and shape factor. However, the above two parameters are associated with the chemical composition, diameter and
185 morphology of particles, and cannot be measured directly. There is large uncertainty when using estimated fixed values. In
 fact, the Cunningham slip correction factor, which is often neglected in calculations, is also an important factor for particles
 smaller than 1 μm. Second, the determination of geometric diameter is influenced by the wavelength of the measuring
 instrument. Third, the airborne particles collected in our measurement were mixed particles rather than pure mineral dust,
 and the size distribution was mainly detected by APS. We think the uncertainty would be reduced to the greatest extent when
190 using the aerodynamic particle size in calculation.
 In a word, we use the aerodynamic diameter in calculating ( ), and note that the uncertainty should be borne in mind
 when comparing our data with other studies.

195

 References

 Brunauer, S., Emmett, P. H., and Teller, E.: Adsorption of Gases in Multimolecular Layers, Journal of the American Chemical
 Society, 60, 309-319, 10.1021/ja01269a023, 1938.
 Hiranuma, N., Augustin-Bauditz, S., Bingemer, H., Budke, C., Curtius, J., Danielczok, A., Diehl, K., Dreischmeier, K., Ebert,
200 M., Frank, F., Hoffmann, N., Kandler, K., Kiselev, A., Koop, T., Leisner, T., Mohler, O., Nillius, B., Peckhaus, A., Rose, D.,
 Weinbruch, S., Wex, H., Boose, Y., DeMott, P. J., Hader, J. D., Hill, T. C. J., Kanji, Z. A., Kulkarni, G., Levin, E. J. T.,
 McCluskey, C. S., Murakami, M., Murray, B. J., Niedermeier, D., Petters, M. D., O'Sullivan, D., Saito, A., Schill, G. P., Tajiri,
 T., Tolbert, M. A., Welti, A., Whale, T. F., Wright, T. P., and Yamashita, K.: A comprehensive laboratory study on the
 immersion freezing behavior of illite NX particles: a comparison of 17 ice nucleation measurement techniques, Atmospheric
205 Chemistry and Physics, 15, 2489-2518, 10.5194/acp-15-2489-2015, 2015.
 Niemand, M., Möhler, O., Vogel, B., Vogel, H., Hoose, C., Connolly, P., Klein, H., Bingemer, H., DeMott, P., Skrotzki, J.,
 and Leisner, T.: A Particle-Surface-Area-Based Parameterization of Immersion Freezing on Desert Dust Particles, Journal of
 the Atmospheric Sciences, 69, 3077-30/10.1175 ,92jas-d-11-0249.1, 2012.

 11
You can also read