Features of assessing the evenness of road surfaces using laser road scanners
←
→
Page content transcription
If your browser does not render page correctly, please read the page content below
IOP Conference Series: Materials Science and Engineering

PAPER • OPEN ACCESS

Features of assessing the evenness of road surfaces using laser road
scanners
To cite this article: R V Smolianiuk et al 2021 IOP Conf. Ser.: Mater. Sci. Eng. 1021 012029

View the article online for updates and enhancements.

                              This content was downloaded from IP address 178.171.37.69 on 20/01/2021 at 17:34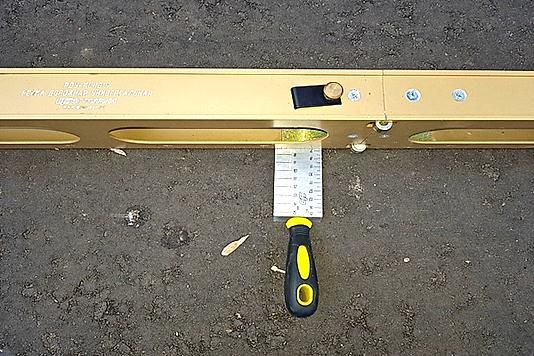
International Scientific Conference Energy Efficiency in Transport (EET 2020)                                            IOP Publishing
IOP Conf. Series: Materials Science and Engineering              1021 (2021) 012029           doi:10.1088/1757-899X/1021/1/012029

Features of assessing the evenness of road surfaces using laser
road scanners

                     R V Smolianiuk1,3, N V Smolianiuk2 and I V Kiashko1
                     1
                       Department of Automobile Road Construction and Maintenance, Kharkiv National
                     Automobile and Highway University, Yaroslava Mudrogo St. 25, 61002 Kharkiv, Ukraine
                     2
                       Department of Bridges, Structures and Structural Mechanics, Kharkiv National Automobile
                     and Highway University, Yaroslava Mudrogo St. 25, 61002 Kharkiv, Ukraine
                     3
                         Email: rovlsm@yahoo.com

                     Abstract. Road pavement evenness is one of the basic parameters characterizing road quality.
                     Evenness influences car wear, fuel consumption, transportation costs, emotional state and
                     comfort of drivers and passengers, and many other parameters. Assessment of road pavement
                     evenness, which is widely used all over the world, has a number of features that do not allow to
                     correctly assess an evenness at bridges, viaducts and other structures. Moreover, particularities
                     of laser scanners operation do not allow to compare the obtained data with data obtained with
                     the help of three-meter straight-edge. The paper suggests ways to solve problems in question,
                     which enable significantly improving quality of evenness assessment at such important
                     transport infrastructure objects as bridges, overpasses and viaducts. There is also a solution to
                     compare the data of transverse evenness obtained by laser scanners with data obtained with the
                     help of a three-meter straight-edge that will permit to use these data later for comparison with
                     standard values.

1. Introduction
Road pavement evenness (roughness) influences car wear, fuel consumption [1], transportation costs,
emotional state and comfort of drivers and passengers, and many other parameters. In current practice
related to pavement evenness assessment, the most widely used evenness parameter is the IRI
(International Roughness Index) [2], which is calculated by summing fluctuations of prediction model
of the “golden car” [3]. Fluctuations are simulated by special software according to the measured
profile of the road pavement. Profile can be measured with the help of equipment of 4 classes.
    The 2nd class equipment is used most widely; it is generally a measuring complex based on laser
sensors that measure the distance between the level at which the sensor is located and the pavement
surface. After adjusting for the angle of measurement, the profile of road pavement is obtained. Laser
sensors have shown the best resistance to atmospheric phenomena and other disturbances and today
are actually the standard for such equipment. A feature of all laser sensors is a very small diameter of
laser trace on pavement. Another feature of the general equipment operation is that the distance
between the measured points ranges from 50 to 300 mm. It depends on equipment design determined
by the manufacturer. To calculate the IRI, it is sufficient to take measurements with a step of 300 mm.
However, with such step, a number of important points can be lost that can have a significant impact
on car traffic comfort [4]. To calculate the IRI, RoadRoof or ProVAL software can be used.

2. Investigation of evenness at bridges and other objects
              Content from this work may be used under the terms of the Creative Commons Attribution 3.0 licence. Any further distribution
              of this work must maintain attribution to the author(s) and the title of the work, journal citation and DOI.
Published under licence by IOP Publishing Ltd                          1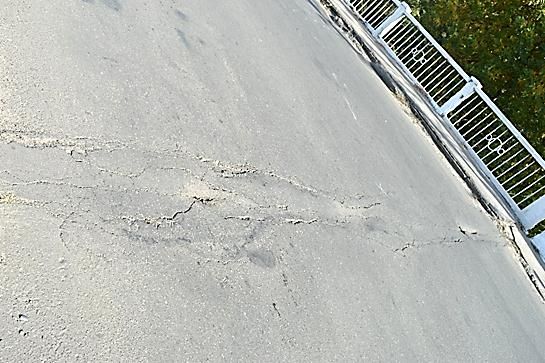
International Scientific Conference Energy Efficiency in Transport (EET 2020)                        IOP Publishing
IOP Conf. Series: Materials Science and Engineering      1021 (2021) 012029     doi:10.1088/1757-899X/1021/1/012029

Laser sensors used in the 2nd class equipment for assessing evenness give a laser trace on pavement
surface within 2-5 mm (Figure 1) that enable actually determining pavement texture.

                                        Figure 1. Laser trace on pavement.
   Frequency of laser sensors operation is (according to the manufacturers’ data) in the range from 2
to 16 kHz. Such operating speed can be achieved under ideal conditions. In real practice, taking into
account necessary storage time of laser sensor and speed of ports and other equipment operation,
measurement frequency is from 200 Hz. However, even such speed is excessive and most of the data
is simply ignored or not obtained, since they are not needed to calculate the evenness of road
pavement according to IRI. But this data can be especially valuable for analyzing such objects as
bridges, overpasses and others. As a rule, such places have defects influencing evenness (Figure 2).

                                  Figure 2. Defects on the bridges of Ukraine.
   A lot of defects of bridges are caused by presence of joints of reinforced concrete slabs [5-8]. These
places require constant maintenance and very often are in poor condition. Typical profiles
corresponding to such types of defects were analyzed as well as models of such profiles were
developed in this work. Based on the developed profiles, vehicle movement was simulated to calculate
the IRI. Simulation and calculation were carried out by ProVAL software.

                                                             2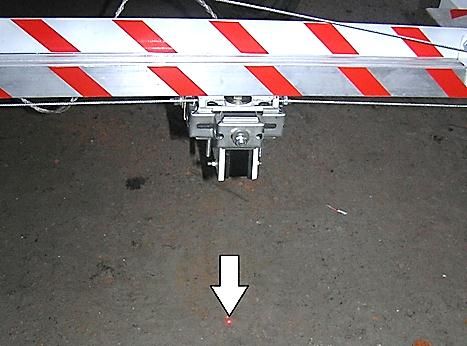
International Scientific Conference Energy Efficiency in Transport (EET 2020)                        IOP Publishing
IOP Conf. Series: Materials Science and Engineering      1021 (2021) 012029     doi:10.1088/1757-899X/1021/1/012029

    Figure 3 shows one of typical profiles and the result of movement simulation along it.

             Figure 3. One of typical profiles and the result of movement simulation along it.
   As it is shown at the diagram, the instantaneous IRI values are quite high. Fluctuations of the
vehicle caused by such defects continue for a long time. Calculation of average IRI values for the
section of 10 m length containing a single defect was also carried out using ProVAL software.
Calculation results show that for a number of defects the average IRI value can exceed 4 m/km that is
the boundary value of evenness in terms of safety.

                                Figure 4. Laser scanning complex LVS-4-KNAHU
   Laser scanning complex LVS-4-KNAHU (Figure 4) has been used for laser scanning of the
pavement and calculating evenness according to IRI at 4 experimental sections, which contain bridges.
Table 1 presents the basic results of the experiment.

                                                             3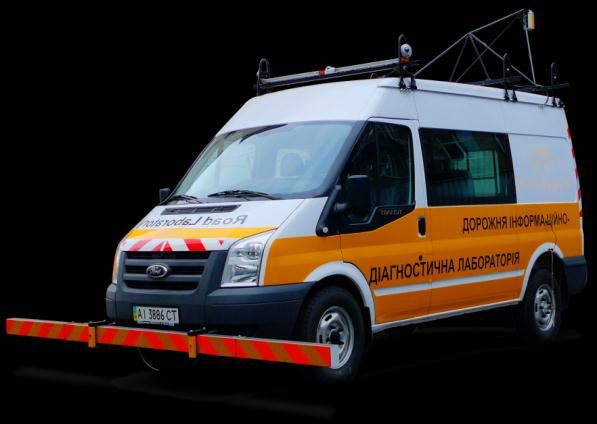
International Scientific Conference Energy Efficiency in Transport (EET 2020)                        IOP Publishing
IOP Conf. Series: Materials Science and Engineering      1021 (2021) 012029     doi:10.1088/1757-899X/1021/1/012029

                                         Table 1. Results of experiment.
                                         Evenness according to IRI, m/km for 10 m length section
                                                          containing a defect
 Number of the object                                                                 Evenness value
                                 Profile measured by      Profile measured by
                                                                                   obtained for the defect
                                     20 cm step                 2 cm step
                                                                                           model
             1                           2.57                      3.86                     3.56
             2                           3.39                      4.82                     4.74
             3                           1.86                      2.42                     2.66
             4                           3.62                      4.64                     3.99
    The first column of Table 1 shows evenness values obtained under pavement surveying with usual
step. Low values of evenness can be explained by the fact that the laser beam of a sensor may not fall
or partially fall into the joint between the beams of the bridge. Therefore, this defect does not
influence the value of evenness. Column 2 presents evenness values for the profile measured with a
significantly smaller step. These values are usually slightly larger than the theoretical ones obtained
with the help of defect model. This is due to the fact that along the section length there may be
additional defects that increase the overall value of evenness.

3. Using a laser scanner to determine lateral evenness (rut)
The peculiarity of scanning system laser sensors operation, namely, small area of laser trace on road
pavement, causes problems under determining lateral evenness of roads [9,10]. In Ukraine, as in many
other countries, a three-meter straight-edge (in some countries, two-meter straight-edge) is used to
determine lateral evenness or tracing rut (presence of rut). A straight-edge is put down across
pavement and the distance between the straight-edge surface and pavement is measured using special
device (Figure 5).

                    Figure 5. Using straight-edge and gage rod to determine tracing ruts.
   Scheme for determining lateral evenness using present-day laser scanning systems is not
significantly different (Figure 6).

                                                             4
International Scientific Conference Energy Efficiency in Transport (EET 2020) IOP Publishing
IOP Conf. Series: Materials Science and Engineering 1021 (2021) 012029 doi:10.1088/1757-899X/1021/1/012029
Figure 6. Scheme for determining lateral evenness using laser scanning systems
All sensors of laser scanning system are located on the same level. From this level, sensors measure
the distance up to the surface of pavement. However, during measurements on stone mastic asphalt
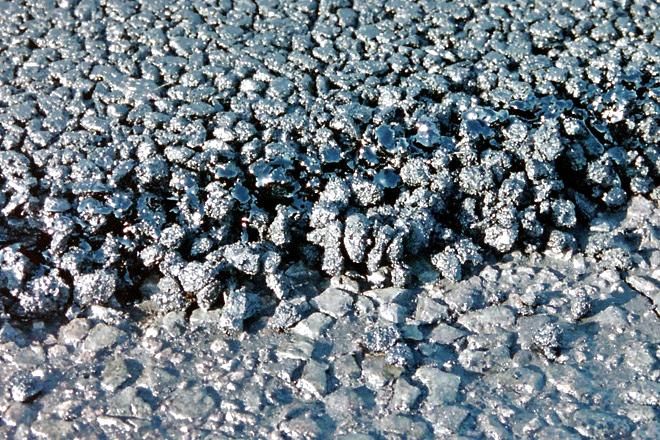
surfaces there are some problems. Structure of such pavement is shown in Figure 7.
Figure 7. Stone mastic asphalt.
As opposed to other types of pavements, surface of stone mastic asphalt is not solid. There is a
significant distance between crushed agents, which very often is larger than a trace from laser sensor.
Thus, laser beam may not fall on pavement surface, but fall into the gap between adjacent grains of
stones. During experimental studies, it was found that this phenomenon is systematic. At the same
time, it is impossible to unambiguously determine which of the sensors measured the distance up to
the surface of a pavement, and which measured the distance in the gap between the grains of stones.
Therefore, it is impossible to compare the obtained values with the values obtained with the help of a
three-meter straight-edge. When measuring with three-meter straight-edge it actually has place an
averaging of values over the width of gage rod, which is 5 cm. The lower edge of gage rod is in
contact with peaks of stones and measurements are made from this level (Figure 8).
gage rod
laser trace
Figure 8. Comparison of measurement principle under using three-meter straight-edge and laser
sensors.
It was experimentally established that the difference between measurements with using laser
systems and a three-meter straight-edge can be 5-20%.
5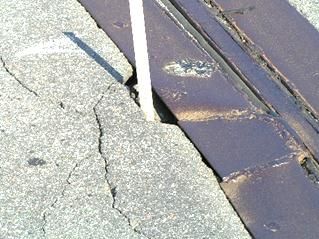
International Scientific Conference Energy Efficiency in Transport (EET 2020)                        IOP Publishing
IOP Conf. Series: Materials Science and Engineering      1021 (2021) 012029     doi:10.1088/1757-899X/1021/1/012029

   Solution to this problem may be to change operating modes of laser scanner. In places, where it is
necessary to measure lateral evenness, the laser scanner has to perform at the maximum frequency and
the obtained data should be processed separately. Under operating speed of measurement and
maximum frequency, data can be collected every 5 mm.
   As in the case, if a gage rod is used, it is necessary to collect data over 5 cm. Thus, it is possible to
get about 10 points, from which it is necessary to select the minimum values, which will be the
calculated ones. So, the measurement will be as identical as possible to the measurement with using a
gage rod and a three-meter straight-edge

4. Conclusions
Present-day laser scanning systems have technological capabilities providing significant increase of
useful data amount. In case of appropriate software upgrades, it is possible to record profile of road
pavement of such objects as bridges with small step that enables identifying various specific defects.
Detailed profile survey enables assessing the impact of joint condition at bridges on ride comfort as
well as giving more information about their condition. Design feature of laser sensors does not allow
to determine lateral evenness on roads with stone mastic asphalt pavements. This problem can also be
overcome by introducing a special high-frequency mode of pavement survey in places where such
measurements are necessary. Solution of this problem is also possible through software upgrades with
introducing separate report for recording such data.
References
[1] Louhghalam A, Akbarian M and Ulm F-J 2015 Roughness-induced pavement–vehicle
        interactions: key parameters and impact on vehicle fuel consumption J of the Transportation
        Research Board 2525 pp 62–70
[2] Sayers M W and Karamihas S M 1998 The Little Book of Profiling. Basic Information about
        Measuring and Interpreting Road Profiles (Michigan: The University of Michigan
        Transportation Research Institute) р 306
[3] Sayers M W 1989 Two Quarter-Car Models for Defining Road Roughness: IRI and HRI
        Transportation Research Record 1215 pp 165–172
[4] Šimun M and Sršen М 2007 Roadway curtain equality on road infrastructure structures J
        Građevinar 59 pp 395–405
[5] Smolyanyuk R V, Smolyanyuk N V, Startsev V A and Zakharchenko M R 2019 Modeling the
        influence of technological inequalities on a bridge floor on traffic conditions Bulletin of
        KhNAHU 86(1) pp 186–191
[6] Smolyanyuk R V, Smolyanyuk N V, Startsev V A and Zakharchenko M R 2019 Modeling the
        influence of technological inequalities on a bridge floor on traffic conditions Bulletin of
        KhNAHU 86(1) pp 186–191
[7] Kiashko I V Novakovskiy D M and Smolianiuk R V 2016 Estimation of roughness of the
        surface of automobile roads B Roads and road construction 95 pp 75–86
[8] Múcka P 2017 International Roughness Index specifications around the world J Road Materials
        and Pavement Design 18(4) pp 929–65
[9] Young Suk Park, Dong Ku Shin and Tae Ju Chung 2005 Influence of road surface roughness on
        dynamic impact factor of bridge by full-scale dynamic testing Canadian Journal of Civil
        Engineering 32(5) pp 825-29
[10] K. Bogsjo, K. Podgorski, and I. Rychlik 2012 Models for road sourface roughness Vehicle
        System Dynamics 50 pp 725-747
[11] Sulaymon Eshkabilov, Abduvokhid Yunusov 2018 Measuring and Assessing Road Profile by
        Employing Accelerometers and IRI Assessment Tools American Journal of Traffic and
        Transportation Engineering 3(2) pp 24-40

                                                             6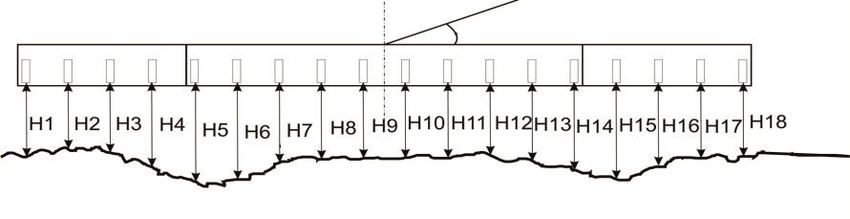
You can also read