Particle and Chemical Emissions from a Vat Photopolymerization 3D Printer
←
→
Page content transcription
If your browser does not render page correctly, please read the page content below

A SU M M A R Y R EPO R T

Particle and Chemical Emissions from
a Vat Photopolymerization 3D Printer

Qian Zhang, PhD, Underwriters Laboratories Inc.
Marilyn Black, PhD, Underwriters Laboratories Inc.

MAY 2021

© 2021 Underwriters Laboratories Inc.                Report 240 | Page 1
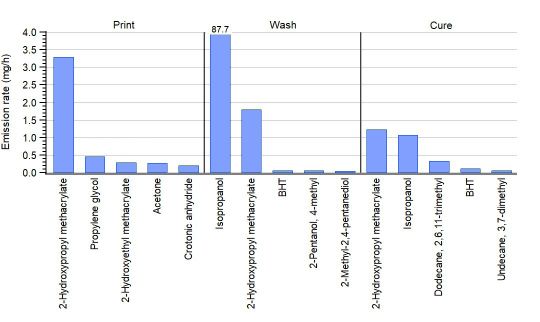
TABLE OF CONTENTS
1.          INTRODUCTION											                                                                                               3
2.          METHODS AND MATERIALS									                                                                                        3
3.          RESULTS												                                                                                                   4
            3.1 Particle emissions											                                                                                      4

            3.2 VOC emissions							                                                         				                                  4

4.          FUTURE RESEARCH										                                                                                             5

5.          REFERENCES											                                                                                                 5

TABLE OF FIGURES
Figure 1: Maximum (Max) and average (Avg) total particle number concentrations for print, wash and cure processes.                4

Figure 2: TVOC emission rates from this study (markers), compared to existing database (boxplot) and the maximum allowable
          level in ANSI/CAN/UL 2904 (red line). The box indicates 25% quartile, median and                                        4
          75% quartile; the whiskers indicate the minimum and maximum values.

Figure 3: Top five of the most emitted chemicals from each process (Print, Wash, Cure) with their emission rates.                 5

© 2021 Underwriters Laboratories Inc.                                                                                Report 240 | Page 2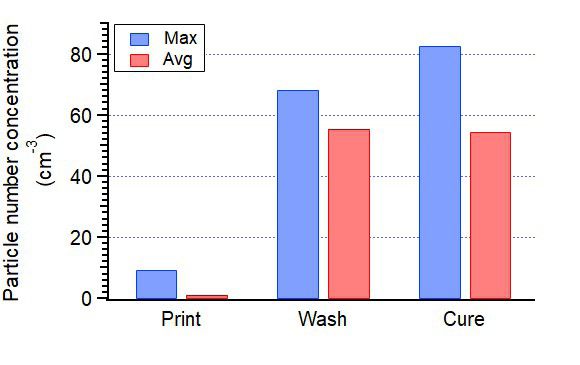
1. INTRODUCTION
Chemical Insights, with our research partner Georgia Institute of Technology, School of Civil and Environmental Engineering and
School of Earth and Atmospheric Sciences, has been conducting leading research on the characterization and potential health impacts
of chemical and particle emissions from 3D printers. These efforts have been presented in various publications and reports (more
resources on website). In addition, a consensus standard, “Standard Method for Testing and Assessing Particle and Chemical Emissions
from 3D Printers”, has been developed from the research, establishing test protocols and acceptable emissions criteria for 3D printers.
Primary research findings show that emissions released during fused filament fabrication (FFF) 3D printing process include large
numbers of volatile organic compounds (VOCs) and particles, primarily in the ultrafine size range. Toxicity responses have also been
obtained. Since these studies demonstrate the potential for adverse human health effects, research is continuing to further assess
toxicity of emissions and to evaluate options for reducing emission exposures.

This study is an extension of the research initiative on characterizing emissions from 3D printing, further focusing on vat
photopolymerization 3D printing technology, also called stereolithography (SLA) or resin printing. Unlike FFF or material extrusion 3D
printing, SLA technology prints a 3D object by shining an ultraviolet (UV) light on a vat of photopolymer resin and cure (or harden) the
resin via photochemical processes selectively by layers. This report presents the preliminary findings of particle and chemical emissions
from a desktop SLA 3D printer during printing, as well as associated post-processing treatments, in accordance with ANSI/CAN/UL 2904.1
Emissions from SLA 3D printing are compared to previously obtained results from FFF 3D printing using the same testing method.

2. METHODS AND MATERIALS
Emission measurements were made in a 1 m3 exposure chamber with the 3D printer placed in the middle. There were accessible ports
with gloves on the side walls of the chamber to enable operation with the printer inside, without opening the chamber or changing the
air conditions inside the chamber. The interaction chamber was validated for its air-tightness, mixing and air exchange rate according to
standards.2,3

The studied SLA 3D printer has an enclosed design; a clear resin from the printer manufacturer was loaded in the printer tank when the
printer was loaded in the chamber. The printer was heated to 31°C before print process started, followed with a 4-hour print, with the
printer enclosed for the entire process. The post-processing treatments included a wash and a cure process. The wash unit is enclosed
with the washing reagent of isopropyl alcohol (IPA); the lid was only open when loading/unloading the printed object. The time for wash
treatment was 15 min. The cure unit is also enclosed with a 405 nm light; the lid was only open when loading/unloading the printed
object. The treatment time for cure was 10 min.

Particles with diameters from 7 to 300 nm were measured using a scanning mobility particle sizer spectrometer, and particles with
diameters from 0.3 to 10 μm were measured by an optical particle sizer.4 Particle emission rate (emission per print time) and particle
yield (emission per mass of filament extruded) during printing and post-processing were calculated according to the methods in ANSI/
CAN/UL 2904.1 VOCs as well as formaldehyde and other low-molecular weight carbonyl compounds were collected onto sorbent media
separately, and then analyzed by gas chromatography - mass spectrometric or high performance liquid chromatography, respectively.5
Sampling time (i.e., target sampling volume) was adjusted according to the chemical levels in the chamber during printing and the
shorter processing time for post-processing treatments. Emission rates for individual VOCs and total VOC (TVOC) were calculated based
on the methods in ANSI/CAN/UL 2904.1

© 2021 Underwriters Laboratories Inc.                                                                                     Report 240 | Page 3
3. RESULTS
Overall, preliminary findings on emissions from the studied SLA 3D printer and post-processing processes showed very limited particle
emissions but high levels of VOC emissions. The total VOC emission rates from SLA 3D printing were higher than the average from FFF
3D printing by a factor of 3 to 6. Individual VOCs emitted differed from those measured with FFF 3D printing due to the differences in
print technologies and materials. Detailed emission results are shown below.
3.1 Particle emissions
The particle emissions from SLA 3D printing, including post-processing processes, were very low (Figure 1); the particle concentrations
remained similar to levels of the chamber background concentrations. The maximum particle number concentration was below 100 cm-3
for all processes studied, which was typically in the order of 103 – 105 cm-3 for FFF 3D printers under the same chamber conditions.
Figure 1. Maximum (Max) and average (Avg) total particle number concentrations
for print, wash and cure processes.
3.2 VOC emissions
TVOC results are shown in Figure 2, along with the statistics of TVOC data from previously studied FFF 3D printing, which included 32
tests with thermoplastic materials. TVOC emission rates from all processes were below the maximum allowable emission criterion listed
in ANSI/CAN/UL 2904 (10.4 mg/h), see Figure 2.
Figure 2. TVOC emission rates from this study (markers), compared to existing database (boxplot) and the
maximum allowable level in ANSI/CAN/UL 2904 (red line). The box indicates 25% quartile, median and
75% quartile; the whiskers indicate the minimum and maximum values.
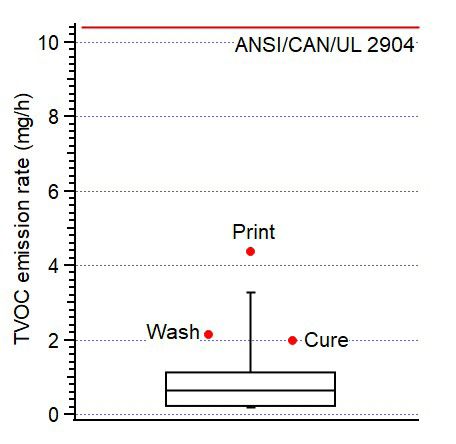
There were 40 individual VOCs detected from printing, 34 from wash post-processing and 42 from cure post-processing; note the air
sampling volumes in this study were smaller than those for FFF 3D printing due to the differences of concentration levels and operation
times. The top five chemicals with the highest emission rates are shown in Figure 3; they accounted for 88%, 100% and 91% of the
sum of VOC emissions for print, wash and cure processes respectively. 2-Hydroxypropyl methacrylate was detected from all processes
with the highest or second highest emission rates (Figure 3), which was associated with the resin chemical compositions. The studied
resin is composed with 55% – 75% of urethane dimethacrylate, 15% – 25% of methacrylate monomers and photoinitiators according
to manufacturer safety data sheet. Isopropanol accounted for over 97% of the sum of VOC emission rates for wash treatment, which
was due to the use of isopropyl alcohol as the was reagent that was filled in the wash tank. The washed part was further treated with
light (i.e., cure post-processing), therefore, isopropanol was also detected at a relatively high emission rate for cure treatment (Figure 3).
Other top emitting chemicals included hydrocarbons, alcohols, and esters.
© 2021 Underwriters Laboratories Inc. Report 240 | Page 4Figure 3. Top five of the most emitted chemicals from each process (Print, Wash, Cure)
with their emission rates.
These highly emitted chemicals from SLA 3D printing (Figure 3) were not commonly observed from previously studied FFF 3D printing.
Only BHT (2,6-di-tert-butyl-4-methylphenol) was detected at a frequency of 15% among 39 FFF prints, while the rest of the VOCs
listed in Figure 3 had less than 10% detect frequencies. Among the top 10 individual VOCs detected from SLA 3D printing, 1-butanol
was detected with a frequency of 72% for FFF prints, and the rest were below 50% detect frequency. Previous study showed VOC
emissions from FFF 3D printing were mainly associated with the filament materials and additives,5 therefore, the most commonly
observed VOCs from FFF 3D printing were not detected or in low emission rates for SLA 3D printing, given the differences of print
technologies and materials applied.
Chemicals of concern are VOCs listed in health-related regulation and guidance.1,6–8 There were 17, 16 and 12 chemicals of concern
detected from print, wash and cure processes separately. Among them, formaldehyde is a human carcinogen according to International
Agency for Research on Cancer (IARC) and it was detected from all 3 processes, at emission rate levels of 0.01 mg/h or lower. Other
chemicals of concerns include acetaldehyde from printing, methyl isobutyl ketone (MIBK) and naphthalene from washing. Although the
emission rates and estimated office exposure levels for chemicals of concern were below those indicated in regulation and guidance,
this complex mixture of alcohols, aldehydes and acrylates could present a strong irritation response among those exposed.
4. FUTURE RESEARCH
Future research will explore how emission characteristics change for different print materials, i.e., resins, such as different
manufacturers, polymer formulars, colors, etc.
5. REFERENCES
1. ANSI. ANSI/CAN/UL 2904 Standard Method for Testing and Assessing Particle and Chemical Emissions from 3D Printers. American
National Standards Institute: Washington DC, US 2019.
2. ASTM. ASTM D6670-13 Standard Practice for Full-Scale Chamber Determination of Volatile Organic Emissions from Indoor Materials
/ Products. ASTM International: West Conshohocken, PA 2013.
3. ISO. ISO 16000-9 Indoor Air – Part 9: Determination of the Emission of Volatile Organic Compounds from Building Products and
Furnishing – Emission Test Chamber Method. International Organization for Standardization: Geneva, Switzerland 2007.
4. Zhang, Q.; Wong, J. P. S.; Davis, A. Y.; Black, M. S.; Weber, R. J. Characterization of Particle Emissions from Consumer Fused Deposition
Modeling 3D Printers. Aerosol Science and Technology 2017, 51 (11), 1275–1286. https://doi.org/10.1080/02786826.2017.1342029.
5. Davis, A. Y.; Zhang, Q.; Wong, J. P. S.; Weber, R. J.; Black, M. S. Characterization of Volatile Organic Compound Emissions from Consumer
Level Material Extrusion 3D Printers. Building and Environment 2019, 160, 106209. https://doi.org/10.1016/j.buildenv.2019.106209.
6. CDPH. Standard Method for the Testing and Evaluation of Volatile Organic Chemical Emissions from Indoor Sources Using
Environmental Chambers Version 1.2. California Department of Public Health: Sacramento, CA 2017.
7. ACGIH. TLVs® and BEIs®: Threshold Limit Values for Chemical Substances and Physical Agents Biological Exposure Indices.; Signature
Publications: Cincinnati, OH, 2018.
8. AgBB. Health-Related Evaluation Procedure for Volatile Organic Compounds Emissions (VVOC, VOC and SVOC) from Building
Products 1. February 1, 2015.
© 2021 Underwriters Laboratories Inc. Report 240 | Page 5A n I ns t i t ut e o f Unde rwri te rs L abo rato ri e s Inc .
2 2 1 1 N e wm a r k e t Parkway, S ui te 106, Mari e tta, GA 30067
c he mi c al Insi ghts@ul .o rg
c he mi c al i nsi ghts.o rg
© 2021 Underwriters Laboratories Inc.
© 2021 Underwriters Laboratories Inc. Report 240 | Page 6You can also read