SUSTAINABILITY REPORT - 2020 HONEYBEAR - Honeybear Brands
←
→
Page content transcription
If your browser does not render page correctly, please read the page content below
A yearly update on our
                        sustainability goals.

                       2020
              SUSTAINABILITY
                     REPORT
  HONEYBEAR
    Brands

2020                   HONEYBEAR BRANDS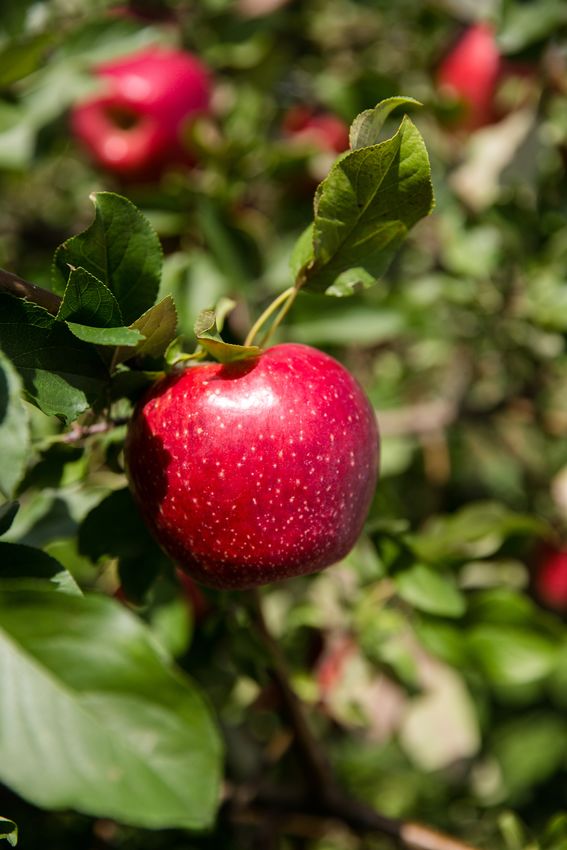
TABLE OF
 CONTENTS

  1    A Letter to Our Stakeholders

 2     Introduction

  3    Progress Highlights

  4    Pollinator Habitat + Health

  8    Plastic-Free Packaging

 11    Food Loss Diversion

 16    Climate

 19    References

2020                                  HONEYBEAR BRANDS
A LETTER TO OUR
 STAKEHOLDERS

 At Honeybear Brands we pride ourselves on developing, growing, and
 supplying the world's finest eating apples. Grown in the Midwest, Eastern
 Canada, the Pacific Northwest, and the mountainous Chilean countryside, our
 apples span nations, microclimates, and flavor profiles.

 Since our foundation, quality fruit has been our principal focus, but with
 today's challenge of climate change, we are rethinking what it means to
 produce fruit and how our business impacts the world at large.

 We rely on robust pollinator populations, predictable temperature patterns,
 consistent rainfall, and healthy soils to produce delicious eating apples year-
 round. Therefore, our production model must also be sustainable, thoughtful,
 and lead to minimal environmental harm.

 It's now been well over a decade since we began addressing sustainability
 throughout our business, and today our sustainability program continues to
 grow and is more comprehensive than ever before.

 In 2014, we formally addressed pollinator health, waste and water reduction,
 and our growing practices, establishing the TruEarth certification program.
 This was just one step in our sustainability journey.

 Over the last five years, we've continued to heard from our customers that
 sustainability matters, both for the health of our crops and communities. In
 2020, we responded with the creation of four new sustainability pillars
 spanning pollinator health, emissions reductions, food loss, and packaging
 waste.

 Today, I am proud to present to you our very first annual sustainability report,
 created in partnership with Sustainable Food Group, which outlines our four
 pillars, where we're starting from, where we've made progress, and where we
 plan to grow. For now, we're on the right track, but we still have a lot of work
 to do and are committed to sustainability now and for the years to come.

    SINCERELY,

    FRED WESCOTT
    Founder and President

2020                                                       1 - HONEYBEAR BRANDS
INTRODUCTION
 In 2019, Honeybear Brands partnered with Sustainable Food Group to take the
 next steps in our sustainability journey and define meaningful goals in five
 key areas: biodiversity, sustainable farming, sustainable packaging, food loss,
 and waste, and climate change.

 In 2020, we announced our first public sustainability goals. In this report, we
 outline the progress we made in our first year.

 Our primary focus in 2020 was better understanding our current practices and
 where we have the best potential to make the most positive impact. Highlights
 include identifying orchards to install pollinator habitat in 2021, converting
 two of our three facilities to 100% renewable energy (becoming the first
 company to participate in the 100% renewable program through our electric
 provider), planning the expansion of our sustainable agriculture program into
 our largest source region, and measuring and understanding food loss and
 diversion within our facilities and at the orchards that supply us.

2020                                                       2 - HONEYBEAR BRANDS
2020 Progress
 Highlights
                              Goal Completion Rate:

                                  Established
 Establish 50 acres of
 pollinator habitat on our
 source orchards
                                32%
                                of 50 acres of
 by 2025.                      pollinator habitat

                                   Certified
 Expand the TruEarth
 program to 90% of acres
 supplying Honeybear
                                12%
                                of acres under
 Brands.                           TruEarth

                                     Sold
 Eliminate plastic in our
 branded packaging by
 2030.
                                42%
                                  of branded
                              product plastic-free

                                   Diverted

                                92%
 Achieve zero food waste
 (to landfill) from farm to
 retail by 2025.                 of food loss
                                 from landfills

                                   Sourcing
 Source 100% of electricity
 used at Honeybear Brand
 facilities from renewable      93%
                               of facility energy
 energy sources by 2025.       from renewables

2020                                                 3 - HONEYBEAR BRANDS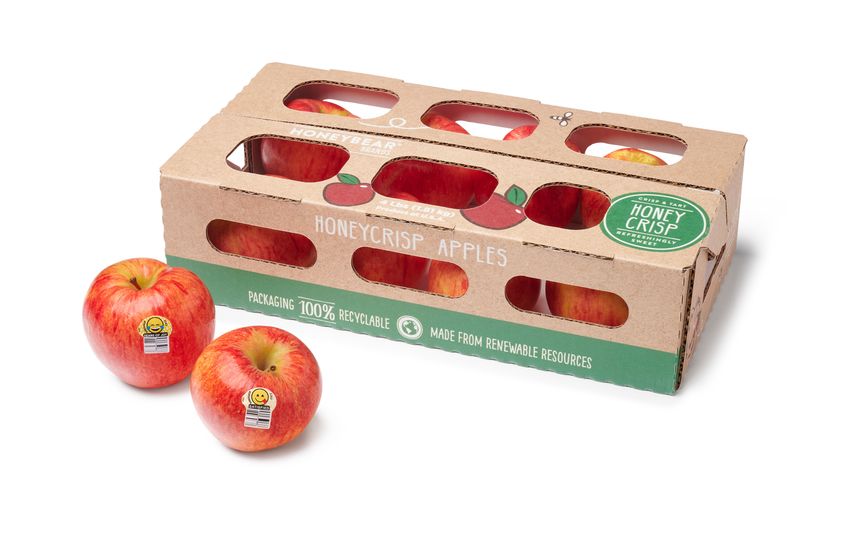
POLLINATOR
 HABITAT + HEALTH

 POLLINATOR PLIGHT: HABITAT LOSS AND
 ITS IMPACT ON APPLE PRODUCTION

 At Honeybear Brands, we know that pollinators, and particularly bees, are essential to apple
 production. They impact fruit yields and quality, along with the economic security of orchards
 across the United States. (1) However, often the very practices used to grow pollinator-
 dependent crops endanger pollinator health. In recent years, parasites, pesticides, climate
 change, and habitat destruction have led to the steep decline of pollinator populations.

 Though these challenges are often associated with managed honeybees, wild pollinator
 populations are also declining. While managed honeybees can travel several miles in search
 of forage, wild bees have more limited ranges, meaning that they are more heavily impacted
 by habitat loss. (2) This is important because wild bees frequently supplement the pollination
 of managed bees in apple orchards. We have been able to learn firsthand from our grower
 suppliers about the essential importance of wild pollinator populations and pollinator-friendly
 practices through our own TruEarth program that encourages sustainable farming on apple
 orchards. In 2020, 81% of TruEarth-certified orchards accomplished pollination without
 commercially produced bumblebee hives.

 Given Honeybear Brand’s dependence on pollinators, we recognize the need to support the
 health of both managed and wild pollinator populations. Moreover, as the cost of managed
 hives continues to increase, healthy wild pollinator populations will directly benefit our
 growers by providing low-cost pollination.

 One of the best ways to support pollinator populations is through habitat installations, a
 cause near and dear to Honeybear Brands. Adopting pollinator-friendly farming and
 conservation practices, like some of the practices recognized in our TruEarth program, is also
 important for protecting pollinators in and around the orchard ecosystems from potential
 pesticide exposure.

   OUR GOAL:                                              "OFTEN THE VERY
   Increase native pollinator abundance by implementing   PRACTICES USED TO
   pollinator conservation practices on 100% of our       GROW POLLINATOR-
   company-owned US orchards supplying Honeybear          DEPENDENT CROPS
   Brands, expanding the TruEarth program to 90% of
   company-owned acres supplying Honeybear Brands
                                                          ENDANGER
   and creating 50 acres of pollinator habitat by 2025.   POLLINATOR HEALTH."

2020                                                                 4 - HONEYBEAR BRANDS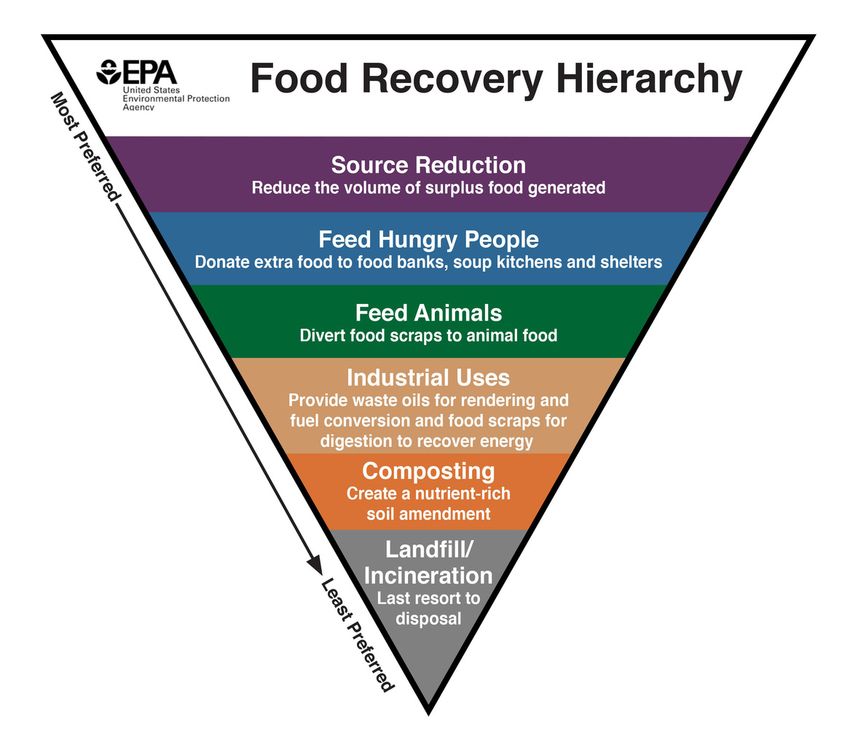
POLLINATOR PROTECTIONS: THE
 CREATION OF TRUEARTH

 In 2010, Honeybear Brands began developing the TruEarth protocol, a certification program
 that encourages the adoption of pollinator-friendly and sustainable farming practices on
 apple orchards. The program began as an extension of an existing program in the
 Northeastern US, and from 2010 to 2012, eight orchards were certified under this extension.

 In 2013, The Mississippi Valley Fruit Company, a conglomerate of Midwestern apple growers
 led by Honeybear Brands, initiated a partnership with the IPM Institute of North America to
 develop a new certification standard. The new standards were tailored to the growing and
 production practices of the Midwest.

 In 2014, this new program was coined TruEarth. Today, the program certifies Honeybear
 Brands’ suppliers’ orchards throughout the Midwest.

 The program encourages the adoption of various advanced practices that require a high level
 of commitment and a deep understanding of ecological and IPM-based farming systems.
 Advanced practices cover a variety of sustainable agriculture practices including pollinator
 conservation (Table 1).

                                                       ADOPT-AN-ACRE:
                                                       FUNDING HEALTHY
                                                       HABITAT

                                                       In 2020, Honeybear Brands created and
                                                       launched an innovative Adopt-an-Acre
                                                       program that enables retailers to fund
                                                       pollinator habitat on orchards they are
 TruEarth supports pollinators by:                     sourcing from. A well-known midwest
                                                       retailer was the first company to join
    Requiring sustainable agriculture practices        the program, helping to fund the habitat
                                                       that will be installed in 2021.     The
    around soil, water, and energy, pesticides, and
                                                       series is now available to view on our
    pest management.                                   site at honeybearbrands.com.

    Prohibiting or restricting the use of pesticides   Meanwhile, we are working with IPM
    with the greatest toxicity to pollinators, and     Institute to strategize around expanding
    prohibiting the most toxic pesticides when         the TruEarth program into Washington
    the crops are in bloom.                            and adapting it for a western climate.
                                                       IPM Institute also thoroughly reviewed
                                                       the program for opportunities to
    Requiring growers to adopt robust IPM
                                                       incorporate       additional    pollinator
    practices, which require an understanding of       conservation practices, like providing
    pest behavior, integration of non-chemical         recognition for growers who establish
    pest management strategies, use of                 new pollinator habitat.
    pesticides only when necessary, and precise
    pesticide application timing.

2020                                                                  5 - HONEYBEAR BRANDS
2020 PROGRESS

 When it comes to our pollinator habitat and protection goals, 2020 proved to be a productive
 year. Across our Midwest orchards, our grower suppliers had already established 16 acres of
 pollinator habitat (Figure 2). For additional pollinator habitat establishment, 2020 was a year
 of preparation. Throughout the winter months, two Mississippi Valley Fruit Company growers
 were selected as recipients of funding for pollinator habitat plots: Ferguson’s Orchard and
 Wescott Orchard (Figure 3). The end of the year was spent researching habitat installation,
 connecting with prairie seed providers, and sharing information with growers. In addition,
 durable signage was printed that will identify the new habitat plots.

 As of 2020, Eleven of our Mississippi Valley Fruit Company growers are enrolled in the
 TruEarth program, 12% of our US source orchard acreage (Figure 1). Mississippi Valley Fruit
 Company growers are mostly modest family farm operations, and the bulk of our source acres
 are in Washington state, where the program has not yet been established. Moving into 2021,
 standards are being adapted for our Western growing region. Expanding into Washington will
 bring far more of our acreage into the program as we work towards our goal of 90% of acres
 certified. All certified acres are adopting the minimum pollinator requirements, and the
 advanced pollinator conservation practices have an average adoption rate of 36.5%(Figure 3).

  TRUEARTH                                                   POLLINATOR HABITAT
  CERTIFIED ACRES                                            ESTABLISHED AS OF
  AS OF 2020                                                 2020

        Certified Acres
                                                                                34 acres left to
            12.2%
                                                             16 acres of        plant
                                                             habitat planted

                          Uncertified Acres
                               87.8%                          Figure 2. Honeybear Brands
                                                              growers have established 16
 Figure 1. In 2020, 603.04 out of 4,930.74                    acres of pollinator habitat, which
 total US acres supplying Honeybear                           is 32% of the way to our goal of
 Brands are TruEarth certified, or 12.2%.                     50 acres by 2025.

2020                                                                 6 - HONEYBEAR BRANDS
2020 PROGRESS

       POLLINATOR CONSERVATION                                   ADOPTION RATE ACROSS
       PRACTICES IN TRUEARTH                                        TRUEARTH CERTIFIED
       PROGRAM                                                              ORCHARDS

       Min requirement:
       Compliance with all legal requirements for pesticide applications                 100%

       Min requirement: Pesticides with US EPA pollinator toxicity advisory
       box not applied from tight cluster through end of crop bloom                      100%

       Advanced Practice:
       Enrolled in an NRCS-approved Environmental Quality Incentives
       Program or Conservation Stewardship Program                                           55%
       Advanced Practice:
       Buffer zone of non-blooming plants >60 feet is maintained around all
       fields that receive applications of pesticides toxic to pollinators                   18%

       Advanced Practice:
       Blooming ground cover is reduced to protect foraging pollinators                      73%
       Figure 3. Adoption of pollinator protection practices in the TruEarth certification
       program. On average, advanced pollinator practices have a 36.5% adoption rate.

 LOOKING AHEAD: A BEE-AUTIFUL FUTURE
 AT HONEYBEAR BRANDS

 We will begin seeking out opportunities to introduce the TruEarth program to Washington
 growers.

 In the coming years, Honeybear will continue expanding Adopt-an-Acre, generating funding for
 new habitat, and reducing the costs for our growers.

 Growers that are strong candidates for the Adopt-an-Acre program have been identified, and
 conversations around plot prep and planting in the spring of 2022 are ongoing. In 2022,
 Honeybear plans to pilot the TruEarth protocol with our company-owned orchards, with
 eventual expansion to 90% of company-owned US source orchards. We will also begin
 assessing the adoption of pollinator conservation practices on our company-owned US
 orchards in pursuit of our goal of 100% adoption by 2025.

2020                                                                    7 - HONEYBEAR BRANDS
PLASTIC-FREE
PACKAGING
THE PLASTIC PROBLEM:
IDENTIFYING THE SOURCE
Almost every piece of plastic ever made still exists in the environment today, polluting
waterways and landscapes, harming animals, and ending up in human food and water
supplies. This occurs because it can take up to 400 years to break down and when it does, it
turns into microplastics which are almost impossible to get out of the environment as they
are too small. All of this plastic adds up, and today there are 600,000 square miles of plastic
in the Pacific Ocean.
Some see recycling as an effective solution to plastic waste, but in reality, only 9% of plastic
is recycled. (3) This is due to insufficient infrastructure, differing standards from place to
place, and misleading labeling. Recycling also places far too much responsibility on
consumers, who didn’t produce the plastic in the first place.
Therefore, at Honeybear Brands we believe that the best way to address the overwhelming
amount of plastic pollution is to stop producing it in the first place.
Luckily for us, and the planet, consumers are increasingly interested in sustainable packaging
options. In a recent study, consumers associated “earth-friendly” packaging with
sustainability more than any attribute other than “efficient use of water and inputs.”
At Honeybear Brands, we aim to set an industry precedent and provide consumers with a no-
brainer, sustainable packaging options while keeping up with ever-changing guidelines and
regulations such as those in eight US states where single-use plastic bags have been banned,
and in Canada where plastics were recently declared to be toxic.(4,5,6)
A NOTE ON
COVID-19:
OUR GOAL:
With COVID came heightened demand
for packaged products which our team
Use zero plastic in our branded packaging by
worked quickly to meet. From 2020 to
2030 and provide plastic-free alternatives to early 2021, packaged apple volume
all branded packaging products by 2025. increased 17.5%. Despite that growth,
bulk apple sales only decreased by
1.1% and still made up the majority of
apple products sold.(7)
2020 8 - HONEYBEAR BRANDS2020 PROGRESS
In 2020, our packaged fruit sales were higher than usual. This was due to several factors
connected to the COVID-19 pandemic:
Fueled by a desire to avoid human contact, many consumers opted for more efficient
shopping trips. In the produce section, grab-and-go options such as our “Cubbies” made
for a quick pass through the produce section without the need to stop and sort through
bulk options(Figure 5).
A propensity for hand hygiene furthered the desire for packaged goods, as consumers
sought out sealed products sold in bags, boxes, and containers.
Participation in COVID-19 food aid-related programs which targeted families, schools, and
those impacted by economic disparities.
Due to these factors, 2020, our baseline year for packaging data, was a bit of an anomaly. For
the first time ever, the percentage of Honeybear cases sold in plastic (57%) outpaced bulk
fruit (42% sold without packaging).
A NOTE ON OUR 2020
2020 HONEYBEAR BRANDS
PLASTIC PACKAGING
PACKAGING MATERIALS
DATA COLLECTION:
Paper While our packaging goal centers
1% around branded packaging, in our 2020
data we are unable to separate branded
packaging from the rest of the
packaging. Therefore, in this report, we
are reporting on ALL Honeybear Brands
Bulk
packaging materials put into the world
42.2%
in 2020 (Figure 4).
Plastic
56.8% Additionally, much of our private label
(non-branded) packaging for specific
retail customers is plastic and for full
transparency on the amount of plastic
we are putting into the world, we feel
it’s important to report a complete
picture.
Figure 4: In 2020, 56.8% of our apples
were sold in plastic packaging, 1.0% Our current plastic packaging includes
were sold in paper, and the remaining plastic pouches, polybags, plastic totes,
42.2% was sold in bulk (no packaging), mesh bags, and clamshells.
which is on par with the US apple
industry as a whole.
2020 9 - HONEYBEAR BRANDS2020 PROGRESS Despite the significant challenges, we began working with our packaging suppliers to explore and trial plastic-free packaging options and alternatives with significantly reduced plastic content. This year we trialed an “eco-box”, a cardboard alternative to a plastic clamshell used to package 4lb of Honeycrisp apples sold at a national big-box retailer, and we expect this option to be rolled out next year.(Figure 5) We also conducted a small trial with a well-known midwest retailer using the eco-box as an alternative to a plastic polybag, and transitioned to a smaller plastic footprint in our polybags, moving towards an option that uses 30% less plastic than our previous polybag. THE ROLE OF THE RETAILER: POWER IN PARTNERSHIPS It is imperative that we continue to provide innovative solutions and, as our plastic-free packaging trials illustrate. It is equally important to find retail partners willing to go on this sustainability journey with us. Our retail partners are invited to share in the appropriate messaging and education to consumers and reap the benefits of being a leader in sustainability. At the same time, we continue to push our packaging suppliers to cover costs of mockups, molds, and tooling so sustainable packaging is real and more than a slide in a presentation deck. LOOKING AHEAD: MATERIAL INNOVATIONS IN THE PACKAGING SPHERE At Honeybear, we are always considering the wants and needs of consumers. For many of our customers, sustainable, plastic-free packaging is a high priority, and we want to meet them with solutions. As a result, we are actively seeking out alternatives to plastic packaging materials. A few examples of this ongoing work include working with packaging suppliers to better understand material reduction and pricing, recyclability, and waste stream infrastructure, considering the role of consumer education, and exploring the realm of plant-based packaging. In fact, we are exploring the potential to debut a paper-based pouch with a plant- based window as an alternative to plastic packaging next year. Consumers may be willing to pay more for earth- friendly packaging, but finding a balance between first-to-market advantage and fair pricing is a continual challenge. During our 2020 4lb eco-box trial, converting from traditional poly to paper added significant cost: at $1.37 compared to $0.09 per unit, paper boxes cost 15 times more than polybags. Costs should decrease as plastic-free packaging becomes more readily available. Regardless, we will Figure 5: Our eco-box polybag continue to research, compare and contrast, and alternative, rolling out in a Midwest look for retail partners to join us in our journey. pilot program come 2021. 2020 10 - HONEYBEAR BRANDS
FOOD LOSS
 DIVERSION

 BOTTOM OF THE BARREL: UNDERSTANDING
 FOOD LOSS IN THE PRODUCE SUPPLY CHAIN

 In the United States, 52% of fresh produce grown is not consumed. This is the highest rate of
 waste for any type of food. Wasted food uses 21% of all freshwater, 19% of all fertilizer, 8% of
 cropland, and 21% of landfill volume.(8) American consumers, businesses, and farms spend
 $218 billion per year growing, processing, transporting, and disposing of food that is never
 eaten.(9)

 Food “loss” refers to losses from production up to, but not including retail, while food “waste”
 encompasses losses from retail to the consumer. Together, they encompass the entire supply
 chain. In the US produce supply chain, most loss and waste occur at the consumer level
 (28%), in production (20%), and in distribution and retail (12%). Smaller losses occur post-
 harvest, in handling and storage (3%) and processing and packaging (1%).(10)

 Given the economic, social, environmental, and climate impacts of food loss and waste,
 Honeybear Brands is committed to addressing food loss, beginning in our operations and with
 our grower suppliers.

 2020 PROGRESS

 To establish baseline data in 2020, we began collecting food loss data from our facilities and
 grower suppliers. These data shed light on the avenues that apples follow after harvest, and
 illuminate opportunities for waste reduction.

 In 2020, we surveyed the bulk of our grower suppliers, mostly in the Midwest and one grower
 in Washington, covering hundreds of acres and hundreds of thousands of bushels harvested
 to understand orchard-level food loss, why it happens, and where it goes. We also collected
 data on fruit loss in our facilities.

                                                      "IN THE US PRODUCE
   OUR GOAL:
                                                      SUPPLY CHAIN, MOST
   Achieve zero food waste (to landfill) from         LOSS AND WASTE OCCUR
   farm to retail by 2025.
                                                      AT THE CONSUMER LEVEL"

2020                                                                 11 - HONEYBEAR BRANDS
2020 PROGRESS
FARM-LEVEL LOSSES:
NON-HUMAN FRUIT USE
Throughout the growing season, it is inevitable that fruit drops from the tree. This is a result
of weather such as wind, water, heat, or stress, as well as disease or fruit shape. On average,
growers surveyed reported that 12.5% of fruit dropped. Once fruit drops from the tree, it
cannot be used for human consumption for food safety-related reasons, so it is sent to local
farms for animal feed (16%), left on the ground under the tree (49%), or chopped/mowed into
small pieces (35%) (Figure 8). The latter two allow nutrients to be recycled directly back into
the orchard ecosystem with minimal to no resource use.
At harvest some apples are left on the tree after harvest; in 2020, 2.5% of the apple crop was
left unharvested as a result of weather damage (42%), pest or disease damage (8%), because
they did not meet grading specifications (39%), or for economic reasons, for example, there
was no buyer (3%) or it was not cost-effective to harvest (8%) (data not shown).
After harvest, 65% of harvested apples are sold as whole apples at full price for human
consumption. The remaining 35%, the “losses,” are used in a variety of ways.
Our food loss categories are based on
the US EPA Hierarchy which prioritizes
IN SEASON LOSSES: food loss diversion strategies that feed
DESTINATION OF DROPPED hungry people overfeeding animals,
which is prioritized over composing
FRUIT 2020
(Figure 7). All methods are preferred
over sending food to a landfill. Across
orchards supplying Honeybear Brands,
just 0.3% of all harvested apples were
Flail Chopped sent to a landfill, and 0.6% of all “losses”
35% were sent to a landfill, for an orchard-
Left under tree level food loss diversion rate of 99.5%.
49.2%
Animal Feed
15.8%
Figure 6: Across our surveyed orchards,
12.5% of fruit dropped in 2020. Dropped
fruit destinations include local animal
feed, leaving the fruit on the ground
under the tree to recycle nutrients, or
Figure 7: The US EPA Food Recovery
chopping up the fruit and spreading it.
Hierarchy illustrates avenues for food loss
diversion from most to least preferred.
2020 12 - HONEYBEAR BRANDS2020 PROGRESS
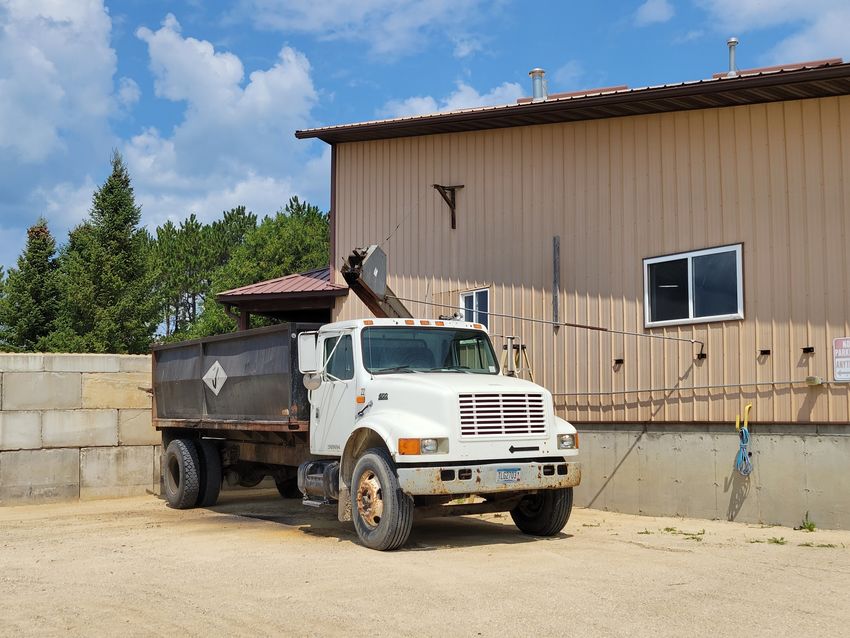
Figure 8: Most fruit that falls under fruit- Figure 9: A truck at Wescott Orchard is
laden trees will be flail chopped for soil loaded with fallen fruit before being sent to
nutrients or left to decompose. a pig farm as feed.
POST HARVEST DESTINATIONS:
ORCHARD FOOD LOSS DIVERSION 2020
Sold for juice
4%
Sold for cider
20.4%
Landfill
0.3%
Orchard use
5.2%
Feed hungry people Retail
3.5% 65.5%
Figure 10. After harvest, apples reach a variety of destinations; the vast majority of all
harvested apples (99.7%) are diverted from the landfill to more preferred uses on the
US EPA Food Recovery Hierarchy. Nearly two-third are sold as whole apples at full
price, while the remaining are diverted to other uses along the hierarchy. Of the
“losses” (apples not sold as whole apples), 99.2% are diverted from landfill.
2020 13 - HONEYBEAR BRANDS2020 PROGRESS
FACILITY-LEVEL LOSSES:
Wescott AgriProducts – Elgin, Minnesota
88% of all apples that enter Honeybear Brands’ Wescott AgriProducts packing facilities in
Minnesota are sold to customers. Of the 12% of apple “losses” that cannot be sold directly to
consumers, none are sent to a landfill (Figure 7), and all are diverted to strategies high on the
US EPA Food Recovery Hierarchy. Nine percent are pressed into cider and 2% are made into
juice. The remaining 1% are apples with decay that cannot be sold or pressed for juice; these
are provided to nearby cattle farmers for free. This facility has in fact already achieved the
goal of zero food loss sent to a landfill.
Honeybear Growers - Washington
At the Honeybear Growers facility in Washington, 79% of all apples that come in are sold to
customers, 18% are sold as ingredients for apple products like juice or pie. The remaining 3%
of apples are dumped in a pit in the ground because they do not meet quality or appearance
criteria (Figure 7). This practice, known as culling, is the largest driver of fresh produce loss
in our supply chain. Though the apples are dumped outside, they still break down and
generate emissions in a similar way to fruit dumped in a landfill and are therefore categorized
as losses to landfill.
FACILITY FOOD LOSS FACILITY FOOD LOSS
DESTINATIONS: WESCOTT DESTINATIONS:
AGRI PRODUCTS HONEYBEAR BRANDS
Cider
Juice 9% Landfill
3%
2%
Processed fruit
18%
Retail Retail
88% 79%
Figure 11. Food loss diversion at
Wescott AgriProducts; this facility has Figure 12. Food loss diversion at
already achieved our goal of zero food Honeybear Growers facility; this
loss to landfill and prioritizes diversion facility sends 3% of apples that
strategies that are high on the US EPA come through the facility to
Food Recovery Hierarchy including “landfill” (a depression in the
feeding people and animals. ground), or 14% of all food loss.
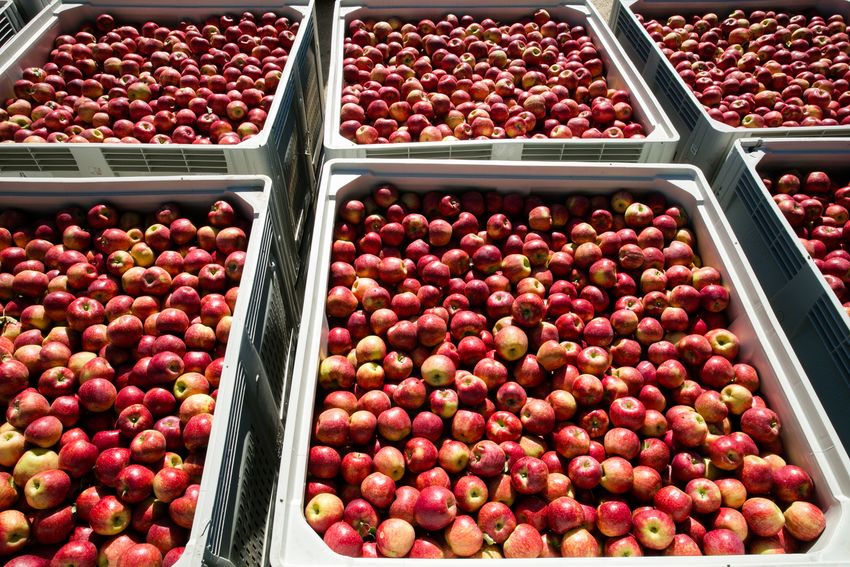
2020 14 - HONEYBEAR BRANDS2020 PROGRESS THE BIG PICTURE: FOOD LOSS AT LARGE The vast majority of Honeybear Brands’ fruit that is unusable for human consumption is diverted to other uses. As of 2020, we are proud to say that less than 10% of all food loss occurring at our facilities is sent to a landfill, and across our orchards, just 0.6% of losses end up at a landfill. Across our orchards and facilities combined, just 8% of food losses are sent to a landfill, which represents just 1.6% of all harvested fruit that ends up in a landfill. We are already well on our way to achieving our goal of 0% losses to landfill through a combination of strategies that minimizes losses and prioritize strategies that divert apples that cannot be sold as whole apples to other uses. Across the orchards that supply us, most food “loss” is recycled directly to the orchard ecosystem, returning nutrients to the soil. Within our facilities, the vast majority of losses are diverted to the highest priorities on the US EPA Food Recovery Hierarchy, human and animal consumption. LOOKING AHEAD: EXPLORING ORGANIZATIONAL AND FARM PARTNERSHIPS After a year of essential data collection to establish a baseline and identify potential opportunities to improve, Honeybear Brands plans to continue addressing the minimal food loss that exists within our supply chain in 2021. In Washington, we plan to seek out composting alternatives for apples that are unfit for human consumption or processing. Meanwhile, we are exploring options with our midwest growers to more effectively make use of fallen fruit. For example, some growers are Figure 13: Freshly picked apples bound for the considering distilled cider or on- packing facility where they will be graded, sorted, farm compost sites. and sent to retailers, processors, and farms. 2020 15- HONEYBEAR BRANDS
CLIMATE

 CONNECTING THE DOTS: APPLE PRODUCTION’S
 ROLE IN CLIMATE CHANGE MITIGATION

 As we have witnessed over the last decade, the climate is rapidly changing. At Honeybear
 Brands we have seen this shift first-hand in our orchards, where we are working to cope with
 heightened fluctuations in cold and hot temperatures, periods of drought, and heavy rains.
 Like all agricultural production, apples are heavily influenced by climate, and without reliable
 temperatures, rainfall, and seasons, it becomes harder and harder to produce consistently
 high-quality crops.

 While agriculture is one driver of climate change, with 11% of global greenhouse gas
 emissions stemming from farming (and 10% of US greenhouse gas emissions), agriculture is
 also a key opportunity to mitigate climate change. (11) Apples are not a major source of
 emissions in agriculture; field-grown fruits have the second-lowest climate impact of all food
 and livestock production, second only to field-grown vegetables, and apples have the lowest
 climate impact of all fruit crops studied, and a lower impact than most vegetables. (12)

 Regardless, the lifecycle of an apple goes beyond the orchard, and emissions are generated
 at every stage: transport to the packinghouse, cold storage, sorting, packing, and distribution.
 At Honeybear Brands, we recognize the need to take responsibility for our all of our supply
 chain emissions from farm to table. We need to make a change both for the long-term
 security of our business, and greater food security for the planet.

 One solution lies in renewable power sources such as solar and wind. Using renewable energy
 directly reduces our greenhouse gas emissions and supports a cleaner energy sector for all.
 We can be even more effective by coupling renewable energy use with the adoption of new
 energy efficiency strategies to reduce our overall energy consumption.

                                                     Moreover, as a perennial cropping system,
                                                     our orchards offer carbon sequestration
    OUR GOAL:                                        potential in both the trees and soil.
                                                     Electric vehicles offer yet another avenue
                                                     for climate conscious change within our
    Source 100% of electricity used at Honeybear     business.
    Brand facilities from renewable energy
    sources by 2025, reduce greenhouse gas
    emissions by 15% in Honeybear Brands
    operations by 2030 (compared to a 2020
    baseline) and be carbon neutral by 2040.

2020                                                                 16 - HONEYBEAR BRANDS
2020 PROGRESS In 2020 we hit the ground running, making significant progress towards our renewable energy and climate goals. We chose to focus first on our Minnesota facility operations because our Washington facility is already sourcing over 80% of its power from renewable hydropower. In Minnesota, we still largely rely on coal, so energy transition leads to a more immediate, positive climate impact. We began purchasing 100% renewable energy to power our Wescott AgriProducts facility in Elgin, Minnesota from the People’s Energy Co-op through their Evergreen Energy Program, becoming the first company to participate in this program! For our facility in Pepin Heights facility in Lake City, Minnesota, we arranged a 100% renewable energy contract based on renewable energy credits through the Southern Minnesota Municipal Power Agency (SMMPA) that will take effect in 2021. We were the first company to ask SMMPA for a 100% renewable energy option. Honeybear Brands was featured in SMMPA’s annual report and the People’s Energy Co-op’s energy provider’s (Dairyland Power Cooperative) newsletter for our achievements in renewable energy sourcing. In pursuit of our energy efficiency goals, we conducted energy efficiency audits at both Minnesota facilities. The results will help inform strategic facility upgrades as we work to reduce our carbon footprint. 2020 BASELINE DATA In 2020, we established our baseline energy usage and greenhouse emissions associated with all of our owned operations including our facilities (fuel, electricity, and refrigerant use) and distribution (fuel and refrigerant use). We began to look into tools for measuring our supply chain emissions from growing apples at the orchards that supply us, and in future years we will calculate emissions for our entire supply chain as well as our owned operations (scopes 1, 2, and 3 emissions) in our pursuit of becoming carbon neutral by 2040. By the end of 2020, across all of our facilities Honeybear Brands we achieved 93% renewable energy, making significant progress towards our 2025 goal of 100%. For comparison, in 2018, our energy mix was 24% renewable at Wescott AgriProducts, 27% at Pepin Heights, and 68% renewable across all of our facilities. Figure 14 shows the breakdown of renewable energy by the facility; the Honeybear Growers facility in Washington is the largest energy user while Pepin Heights is the smallest. We used the Greenhouse Gas (GHG) Protocol to calculate emissions associated with our operations, including purchased electricity, natural gas and propane, transportation (distribution), and refrigeration. In 2020, our total GHG emissions across all of our operations were 3,025.2 metric tonnes of CO2 equivalent, which is the equivalent of the electricity used by 550 homes for one year, or 658 passenger vehicles driven for one year. Figure 15 summarizes GHG emissions by facility and source. Across all facilities, our largest source of emissions stemmed from purchased electricity, which supports our decision to transition to renewable energy. Refrigeration (refrigerants used for cold storage and refrigerated trucks) was the smallest source of emissions this year, as refrigerants for our coolers and refrigerated trucks are not purchased yearly. Meanwhile, Our Honeybear Growers and Pepin Heights facilities use a refrigerant with zero global warming potential, which means it does not contribute to overall emissions. 2020 17 - HONEYBEAR BRANDS
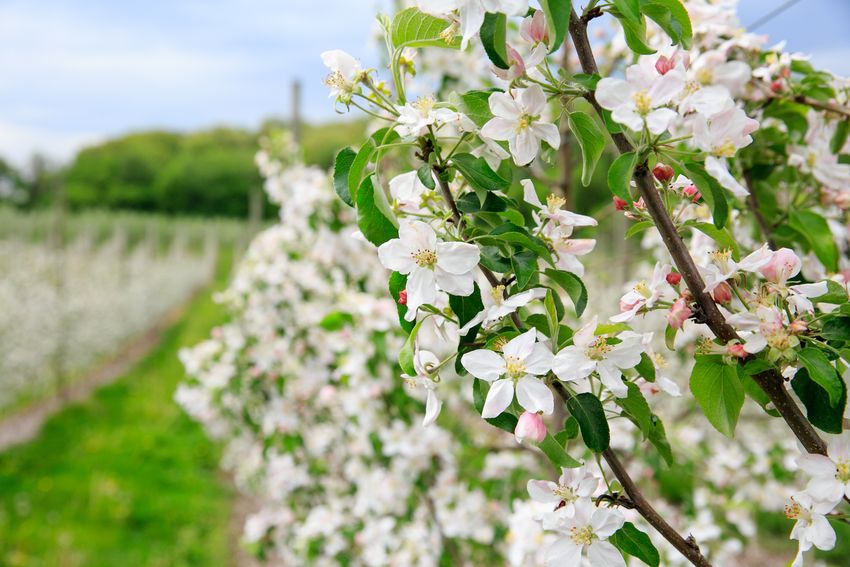
2020 PROGRESS

         RENEWABLE ENERGY                             100%

         USE BY FACILITY
                                                       75%
         Figure 14. We achieved 100%
         renewable energy sourcing at
         Wescott AgriProducts facility,
         compared to 24% renewable power               50%
         in 2018. At Pepin Heights we
         negotiated a contract to source
         100% of our power from renewable              25%
         energy in 2021. The Honeybear
         Growers facility in Washington
         state is powered by 85%
                                                        0%
         hydropower and 4% wind power.                         Honeybear Growers      Wescott Agri Products            Pepin Heights

 1,500
                                                                          GHG EMISSIONS BY
                                                                          FACILITY AND SOURCE
                                                                          Figure 15. Greenhouse gas
 1,000
                                                                          (GHG) emissions by facility and
                                                                          source. Total emissions across
                                                                          all owned operations (Scopes 1
                                                                          and 2) in 2020 were 3,025.2
                                                                          metric tonnes of CO2
  500
                                                                          equivalent, which is the
                                                                          equivalent of the electricity use
                                                                          from 550 for one year.
                                                                             Purchased electricity     Refrigeration

                                                                             Transportation            Propane
    0
          Honeybear Growers   Wescott Agri Products   Pepin Heights          Natural gas

 LOOKING AHEAD: A BRIGHT FUTURE

 In 2021, we will continue to focus on our renewable energy goal, shifting focus to Washington
 where we will explore options to expand the use of renewables at our largest facility. Towards
 our GHG emissions reduction goal, we will explore energy efficiency measures at our
 Minnesota facilities, informed by the results of the energy audits conducted in 2020.
 Meanwhile, we will begin assessing the emissions and carbon sequestration potential across
 all of our source orchards, with the goal of calculating the carbon footprint of our entire
 supply chain and beginning to create a roadmap for achieving our goal of carbon neutrality by
 2040.

2020                                                                                          18 - HONEYBEAR BRANDS
2020 HONEYBEAR BRANDS REFERENCES 1.Pardo, Adara & Borges, Paulo. 2020. "Worldwide importance of insect pollination in apple orchards: A review". Agriculture Ecosystems & Environment. 293. 10.1016/j.agee.2020.106839. 2. Biddinger, D. 2017. Orchard Pollination - The Role of Pollen Bees. Accessed 7/1/2021 at 3. United Nations Environment Programme. N.d. Our planet is drowning in plastic pollution – it’s time for a change! Retrieved from https://www.unep.org/interactive/beat-plastic- pollution/ 4. Iri Nielsen ending Feb 21, 2021 5. National Conference of State Legislatures. 2021. State Plastic Bag Legislation. Retrieved from:https://www.ncsl.org/research/environment-and-natural-resources/plastic-bag- legislation.aspx 6. Rescuing Leftover Cuisine. 2021. "Food Insecurity". rescuingleftovercuisine.org. Retrieved from https://www.rescuingleftovercuisine.org/challenge? gclid=Cj0KCQjwpfHzBRCiARIsAHHzyZrXv7uCp1Cjksas27Ov6JtQHyWJC8Q32Cq8W5oP3qv62E4 SLIpq26QaAoS-EALw_wcB 7. 27 Solutions to Food Waste: Financial Benefit. n.d. Retrieved from https://www.refed.com/?sort=economic-value-per-ton 8. Gunders D. "Wasted: How America is Losing Up to 40 Percent of Its Food from Farm to Fork to Landfill". www.nrdc.org. 2012. Retrieved from https://www.nrdc.org/sites/default/files/wasted-food-IP.pdf 9. US EPA. 2021. Greenhouse Gas Equivalencies Calculator. Accessed 7/3/2021 at https://www.epa.gov/energy/greenhouse-gas-equivalencies-calculator 10. Gunders D. 2012. Wasted: How America is Losing Up to 40 Percent of Its Food from Farm to Fork to Landfill. Retrieved from https://www.nrdc.org/sites/default/files/wasted-food- IP.pdf 11. Adewale, C. and Granatstein, D. 2019. Improvement options for horticultural production of fruits and vegetables. Burleigh Dodds Science Publishing Limited. http://dx.doi.org/10.19103/AS.2018.0044.13. 2020 19 - HONEYBEAR BRANDS
You can also read