Sustainable mobility challenges for the transition targets - Emanuele Proia ASSTRA
←
→
Page content transcription
If your browser does not render page correctly, please read the page content below
Sustainable mobility challenges
          for the transition targets

Current and future challenges to Energy Security – 2nd AIEE Energy Symposium
                     Roma – Saturday, November 4, 2017

                       Emanuele Proia‐ ASSTRA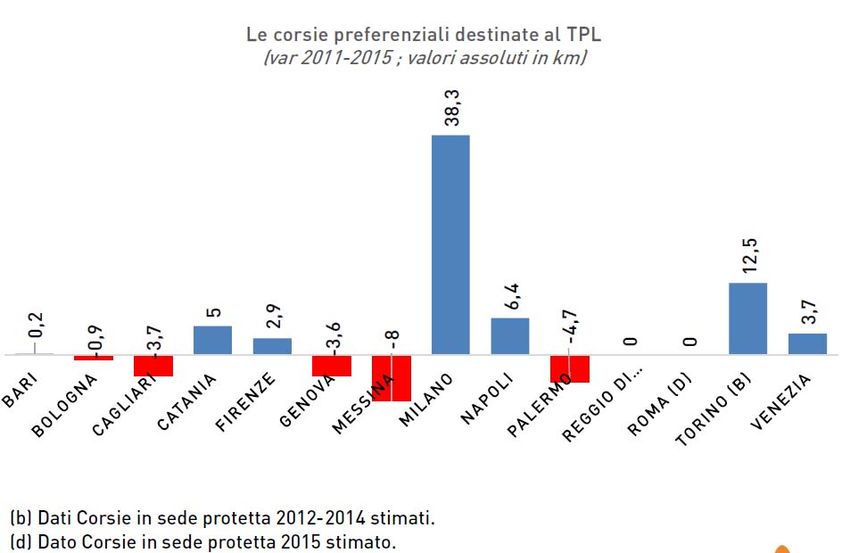
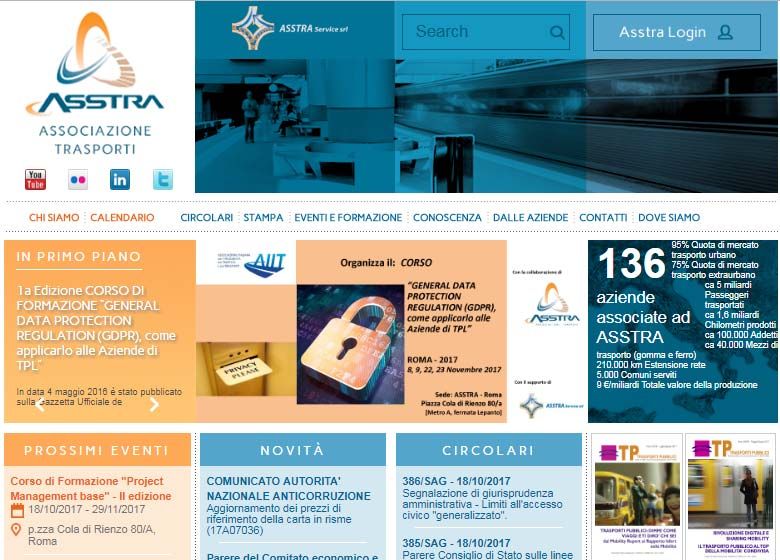
ASSTRA: WHO WE ARE
ASSTRA represents a network of 136 companies running urban, suburban and
extraurban public transport services on:
√ Buses, √ Tramway, √ Trolleybuses, √ Metropolitan railway, √ Light rail (Except those
  operated by Trenitalia S.p.A.),
√ Waterborne transport, √ Tourist and school services, √ Parking areas, √ Towing
  away of vehicles.

    www.asstra.it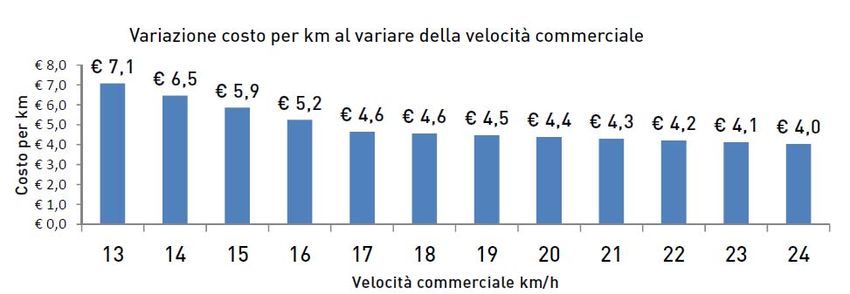
ASSTRA: WHAT IT DOES
The Association REPRESENTS THE NEEDS OF PUBLIC TRANSPORT OPERATORS and
defends their interests in front of Institutions, at national and European level.

 PROMOTES local public                                     OFFERS technical advice
 transport as the way to                                   on social, legal,
 sustainability, fostering                                 administrative, financial,
 awareness on its                                          and innovation fields
 environmental, social and
 economic values.
                                                           COLLECTS data to assure
  DEFENDS the rights and the                               the punctual analysis of
  interests of its Members                                 the sector

             BRINGS relevant sector stakeholders together to exchange
             ideas and find solutions, being a recognized platform for
             knowledge sharing and business networking
Urban Mobility in Italy
                                          Motorization rate
                                      (Cars per 100 inhabitants)
                   65 61
                         58 55
                               54 53 53
                                        49 49 49 47 47 47 46
                                                             44 42 41

         Source: 14° Rapporto sulla mobilità in Italia, Roma 19 aprile 2017 (ISFORT, ANAV, ASSTRA)
                       50                      61
5 cars                cars                                        ROME: 70.7 CARS PER 100 INHABITANTS
                                              cars
  in                   in                                         EUROPE AVERAGE: 40 CARS PER INHABITANTS
                                               in
 1961                 1991                                        BERLIN: 35, MADRID: 32; ….
                                              2014
Urban Mobility in Italy
                                 The Modal split
                    Private car                 Motor bike                   Public transport

2016                                            81,1%                                         5,3% 13,6%

2015                                             81,6%                                        6,5% 11,9%

2008                                           79,5%                                          8,0% 12,6%

  Source: 14° Rapporto sulla mobilità in Italia, Roma 19 aprile 2017 (ISFORT, ANAV, ASSTRA)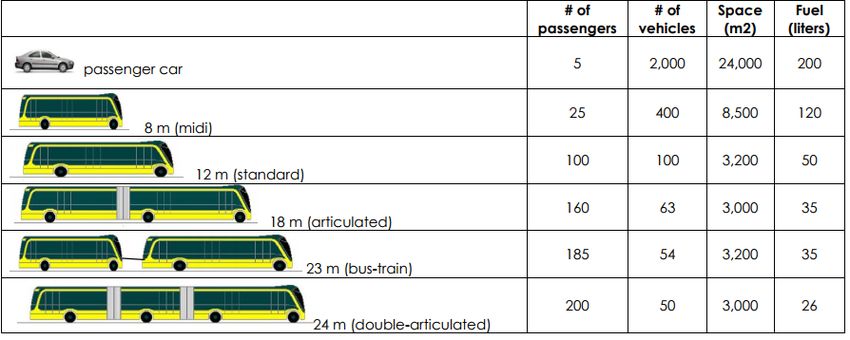
PT MODAL SPLIT

                 6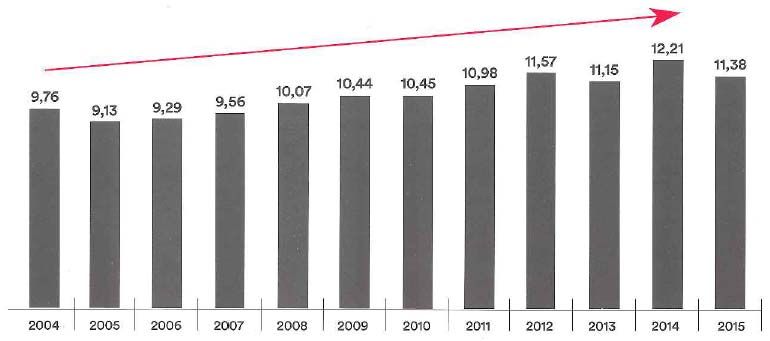
THE ITALIAN INFRASTRUCTURAL GAP
                                     Km rete ferroviaria suburbana/milioni
                                          di abitanti (Anno 2015; Km)

                                                           25,2        26,4         30,8
                                   10,7       10,9

                                  Italia     Francia    Germania      Regno       Spagna
                                                                      Unito

     Km rete tram/milioni di abitanti (Anno 2015;                         Km rete metropolitana/milioni di abitanti
                        Km)                                                          (Anno 2015; Km)

                                                23,37                                                            12,5
                                                                                                        10,5
                                                                                               7,8
                                   11,07                                3,8          5,5
   3,65        5,05     5,34
                                                                       Italia      Francia   Germania   Regno   Spagna
Regno Unito   Spagna    Italia    Francia     Germania
                                                                                                        Unito

                                    Fonti: Investire nel TPL, ASSTRA‐CdP, gennaio 2017.

                                                                                                                    7
PT in Italy (2015)
                            Average age of fleet (Bus)

[Source: “Investire nel trasporto pubblico – Mezzi e reti per la mobilità” ‐ ASSTRA e CDP – 2017 ]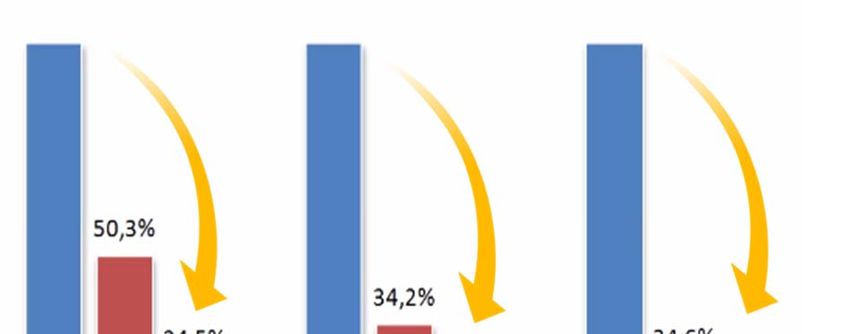
PT in Europe (2015)
                                     Average age of fleet (Bus)

                                                                                                     INFRASTRUCTURAL
       11,4                                                                                          GAP RESPECT TO
                                                                                                     OTHER MAIN
                          8,0               7,8               7,6               6,9                  EUROPEAN
                                                                                                     COUNTRIES ALWAYS
                                                                                                     INCREASES MORE.
         ITALIA          SPAGNA            FRANCIA        REGNO UNITO         GERMANIA

[Source: “Investire nel trasporto pubblico – Mezzi e reti per la mobilità” ‐ ASSTRA e CDP – 2017 ]
PT in Italy (2015)
  The source for energy ‐ Bus (Urban service, 2015)
                                                      Hybrid
                      Electric                         1%
                        1%
                                                                                      CNG
                                                                                      27%            RECENT TENDERS IN
                                                                                                     BERGAMO, MILANO
                                                                                                     AND TORINO HAVE
                                                                                                     INCREASED
                                                                                                     CONSISTENTLY THE
                                                                                                     NUMBERS OF FULL
                                                                                                     ELECTRIC BUSES (ABOUT
                         Diesel                                                                      60 VEHICLES)
                          71%
[Source: “Investire nel trasporto pubblico – Mezzi e reti per la mobilità” ‐ ASSTRA e CDP – 2017 ]

                                                                                                                    10
PT in Italy (2015)
Level of emission ‐ Bus (Urban service, 2015)
Pre Euro 0, Euro I
Euro 0 2%
3%
EEV Euro II
26% 22%
Euro VI
8%
Euro III
Euro V 21%
14% Euro IV
4%
[Source: “Investire nel trasporto pubblico – Mezzi e reti per la mobilità” ‐ ASSTRA e CDP – 2017 ]
11WHY IT IS NECESSARY TO INTERVENE IN PT
12Investing in Public Transportation Provides
Economic Growth and new jobs opportunities
5,6 mld € 137 mila nuove unità di
3,9 mld € di di valore
lavoro annue
investimenti fino al 2033 aggiunto annuo (+0,3% PIL) (+0,6% occupazione)
[Source: “Investire nel trasporto pubblico – Mezzi e reti per la mobilità” ‐
ASSTRA e CDP – 2017 ]
13PT Reduces the congestion and fuel consumption To transport 10.000 passengers Fonte: UITP ‐ Volvo Bus Corporation, MAN Truck & Bus AG, and UITP Bus Committee © 2015
PT Reduces the congestion and emissions
                                     BUS             AUTO                var
                                  g/km pass       g/km pass             %
              NMVOC                 0,041           0,401             +878%
              CO                    0,168           3,093            +1.741%
              CO2                   53,328         167,252           +213,6%           CO2 CAR = 3 * BUS CO2
              PM10                  0,021           0,033             +57,1%
              PM2,5                 0,019           0,027             +42,1%

    Source: 14° Rapporto sulla mobilità in Italia, Roma 19 aprile 2017 (ISFORT, ANAV, ASSTRA)

                 Fonte: UITP
PT saves money and increase property values
Family monthly expenditure for transport (Italia
2015;%) ‐ ISTAT
Servizi di Acquisto mezzi
trasporto trasposto
9% 21%
Esercizio mezzi
trasporto
70%
Private car family monthy expenditure : 260 Euro
PT family monthy expenditure : 23 Euro
Residential property values performed 42 percent
better on average if they were located near public
transportation with high‐frequency service.Expecially in Italy
17SOLUTIONS
• To promote the modal shift towards collective and
sustainable mobility systems through the
implementation of a new and modern national
transport plan;
• Promote an expansive investment policy for the
renwal of fleet and construction of new rail, tram an
metro lines;
• Bridging the infrastructure gap of collective mobility
systems with the aim to satisfy the needs of current
and potential demand (quality, quantity, integration
of the offer).
18SOLUTIONS
Increase commercial speed even through new reserved lanes
19SOLUTIONS
• Introduce the indexing the National Transport Fund.
The indexing of the inflative dynamics would avoid
the deterioration of the real value of the fund over
the years;
• Driving a process of industrialization of the TPL
sector through the modernisation of the regulatory
framework, an impetus towards greater and better
competition ;
• Implement the principle of standard costs as soon
as possible.
20Thanks for your attention
21You can also read