Scenari macroeconomici e finanziari 2020 - Giorgio di Giorgio | Vice Rettore, Università LUISS Roma - Deloitte

Page created by Stephanie Strickland
 
CONTINUE READING
Scenari macroeconomici e finanziari 2020 - Giorgio di Giorgio | Vice Rettore, Università LUISS Roma - Deloitte
Scenari macroeconomici
e finanziari 2020
Giorgio di Giorgio | Vice Rettore,
Università LUISS Roma
Scenari macroeconomici e finanziari 2020 - Giorgio di Giorgio | Vice Rettore, Università LUISS Roma - Deloitte
Agenda

1 – Il quadro congiunturale. Rallentamento verso recessione.

2 – Liquidita’ e rischi finanziari

3 – Le difficolta’ in Europa

4 – L’Italia e i nostri problemi strutturali: una agenda ”vecchia”, sempre attuale

                                                                                     2
Scenari macroeconomici e finanziari 2020 - Giorgio di Giorgio | Vice Rettore, Università LUISS Roma - Deloitte
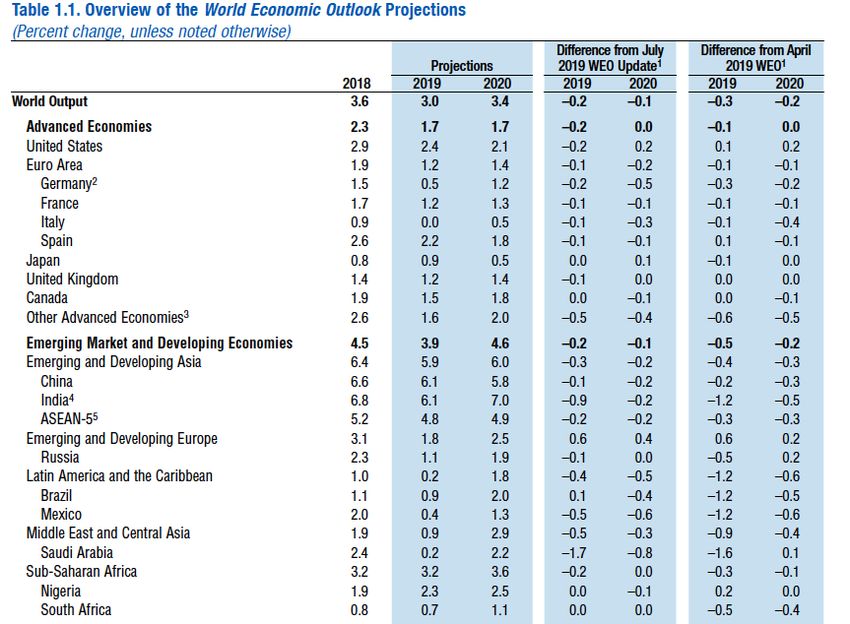
Forecasts revised downward mostly everywhere

                                               3
Scenari macroeconomici e finanziari 2020 - Giorgio di Giorgio | Vice Rettore, Università LUISS Roma - Deloitte
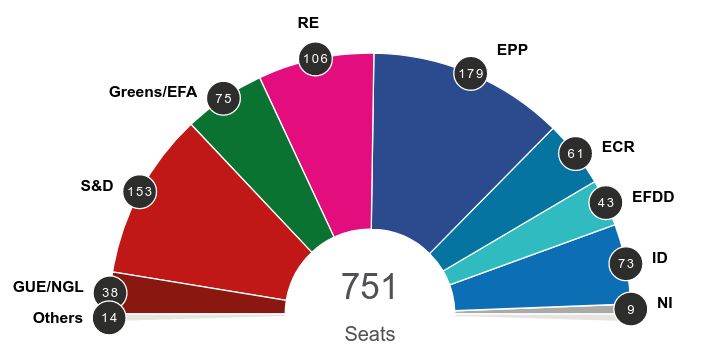
The medium term macro environment

Growth acceleration of emerging countries (with respect to developed ones) begins in the years 2000. In
the same period inflation rates converge (in part).
   Real GDP growth
                                         '80s              '90s              '00-'07          '08-'18         '19 estim          '20 estim
   World Economy                           3.2               3.1                 4.5              3.4               3.5                3.6
    Developed countries                    3.1               2.8                 2.7              1.4               2.0                1.7
    Emerging countries                     3.2               3.6                 6.6              5.0               4.5                4.9
   Consumer inflation
                                         '80s              '90s              '00-'07          '08-'18         '19 estim          '20 estim
   World Economy                         15.8              20.2                  4.2              3.7               3.8                3.6
    Developed countries                    6.5               2.9                 2.1              1.6               1.7                2.0
    Emerging countries                   36.6              55.4                  6.8              5.6               5.1                4.6
                                                                   10
               Real GDP grow th (source IMF)                                            Consumer inf lation (source IMF)

                                                                   8                                                                          115
          emerging countries
                                                                   6                                                                          95

                                                                   4                                                                          75

                                                                   2                                                                          55
        developed countries
                                                                   0                                             emerging countries           35
                                                                                                                 developed countries
                                                                   -2                                                                         15

                                                                   -4                                                                         -5
   80   85    90     95        00   05   10      15   20     25         80     85      90    95     00     05      10      15   20     25
                                                                                                                                Source: IMF
                                                                                                                                                    4
Who drives global growth

Emerging countries produce almost 60% of global GDP (in 2000 their share was 43%) and represent some
70% of global annual growth.

                                                                                       %      65
                             Distribution of World GDP
                         (GDP measured at PPP, source IMF)
                                                                                              60
                                   57%
                                                                                59%
                                                                                              55
     developed countries

                                                                                              50

     emerging countries                                                                       45
                                                                               41%

                                  43%                                                         40

                                                                                              35
    90 92 94 96 98 00 02 04 06 08 10 12 14 16 18 20
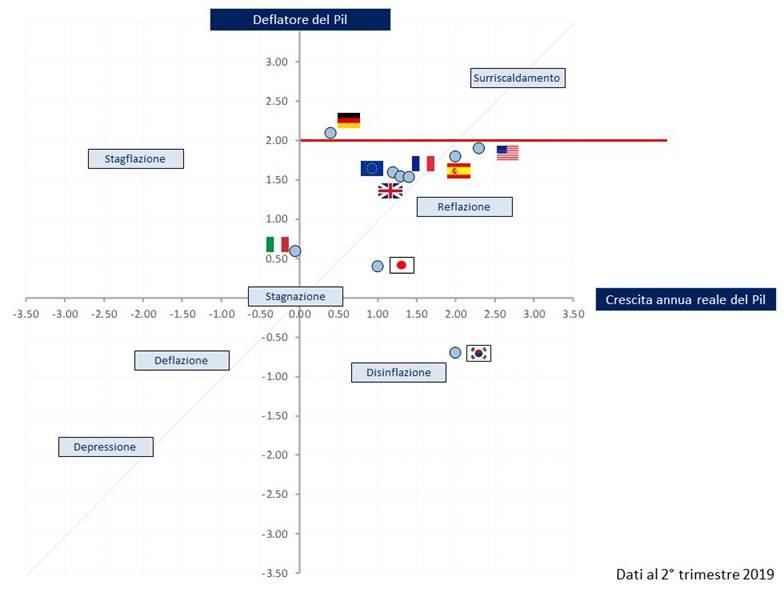
                                                                                                       5
L’orologio del ciclo nei maggiori paesi (dati terzo trimestre 2019)

                                                                      6
28 novembre 2019|Prof. Giorgio Di Giorgio

                   Risks evident in the world trade fall….

                                                             7
28 novembre 2019|Prof. Giorgio Di Giorgio

                   ….in a reduction of dinamism in China

                                                           8
Monetary policy challenges

In a world of no inflation to be fought, central banks are again in an expansionary mood

The Fed stopped its normalization path by reducing rates and stopping the downward
   adjustment of its balance sheet

The ECB is re activating the bazooka

A fiscal role for monetary policy?

What else in the Eurozone?

                                                                                           9
Liquidity and the risks of a new financial crisis

Abundant liquidity keeps being the model

Negative interest rates even for long maturities in gov bonds

Very Low risk adjusted returns in private debt

High indebtness of firms and governments (less worrying for
households)

Asset inflation: high valuations in equity and bond markets

fragility and risks!!!

However: Banks much more capitalized, leverage of brokerage
firms much lower than in 2007, profit conditions of firms still pretty
sound

                                                                         10
German industrial production slowing down, despite many
                        favourable conditions

    135

    130

    125

    120

    115

    110
Indice 2002=100

    105

    100

            95

            90

            85

            80

            75
                  '02    '03   '04   '05   '06   '07      '08   '09       '10   '11   '12   '13   '14   '15     '16   '17   '18

                                                 Italia         Francia         Spagna       Germania         100

                                                                                                                                  11
28 novembre 2019|Prof. Giorgio Di Giorgio

                   ….and in further damage provoked by a hard Brexit or no deal

                                                                                  12
EU Parliament more fragmented than ever: a large coalition needed

                                                                    13
28 novembre 2019|Prof. Giorgio Di Giorgio

                          Focus Italy: Italy is the weak link in the Eurozone

                                  GDP Pro-capite 1992-2018: Italy, UK vs major countries
                                                                     (100 = 31/12/1992)

               250

               225

               200

               175

               150

               125

               100

                75
                     92      94      96       98          00          02          04         06        08    10            12   14    16   18

                                       USA           United Kingdom                Italy           Germany        France        100

                                             Source: GaveKal, Bloomberg, Profilo Investment Advisory                                       | 14 |
28 novembre 2019|Prof. Giorgio Di Giorgio

                    Long period GDP per capita dynamics

                        Italy       Euro Area     USA   France   Germany   UK    Spain   Japan

      1951-60            5,4                4,3   1,8    3,7       7,1     2,3    3,5     7,6

      1961-70            4,9                3,7   3,0    4,4       3,5     2,2    6,3     8,9

      1971-80            3,1                2,4   2,2    2,7       2,7     1,8    2,4     3,3

      1981-90            2,2                1,8   2,4    2,0       2,0     2,8    2,6     4,0

      1991-00            1,6                1,5   2,2    1,7       1,6     2,2    2,5     1,0

      2001-10            -0,1               0,5   0,8    0,6       1,1     1,0    0,8     0,6

      2011-18            -0,1               0,7   1,5    0,8       1,5     1,2    1,1     1,2

                                                                                          15
28 novembre 2019|Prof. Giorgio Di Giorgio

                    Italy: Our Structural Problems

             Low productivity
             Low competitivity
             Fiscal fragility: High public debt-gdp ratio nothwistanding sound fiscal flows
             Banking fragility: unprofitable banks, consolidation needed
             Inefficient labor and goods markets
             High unemployment and low participation in the South, among women and the young
             Excessive weight of SMEs, and of micro-firms among the latter
             Excessive burocracy, inefficient and costly PA
             Service sectors highly regulated and protected
             Inadequate infrastructures (material and immaterial)
             High costs of politics and too many (and inefficiently coordinated) decision levels
             Lack of Assesment-Evaluation-Intervention procedures in public spending
             Too many laws, rare enforcement
             Slow and inefficient Justice
             High taxes on families and firms
             Costly and inefficient local public services
             Quite Low Social expenditure (excluding pensions)                                16
28 novembre 2019|Prof. Giorgio Di Giorgio

                    Long history of (shy) attempts for structural reforms

             Change is necessary

             All governments have failed, for different reasons

             From macro to micro policies, based on right Incentives to agents behavior
             Comprehensive fiscal reform needed
             Recomposition of public expenditure needed (more infrastructure and human capital,
             less subsidies, reduced purchases for the PA, proper dealing with health, ageing and
             migration)
             Environmental interventions needed (Justice, burocracy..)
             Redistribution policies?

             Return to dynamism is the true challenge

                                                                                            17
You can also read