Sustainable production of graphene from petroleum coke using electrochemical exfoliation
←
→
Page content transcription
If your browser does not render page correctly, please read the page content below
www.nature.com/npj2dmaterials

                  ARTICLE                  OPEN

                  Sustainable production of graphene from petroleum coke using
                  electrochemical exfoliation
                  Sanjit Saha 1, Pritishma Lakhe1, Matthew J. Mason1, Bryan J. Coleman1, Kailash Arole                                 1
                                                                                                                                           , Xiaofei Zhao1, Sergey Yakovlev2,
                  Sundararajan Uppili2, Micah J. Green 1 ✉ and Rohan A. Hule 2 ✉

                      Petroleum coke is a solid, carbonaceous by-product of oil refining and is normally used for heating or as an anode in aluminum and
                      steel production. These applications contribute to carbon emissions, but here we show that petroleum coke has another potential
                      avenue: as a precursor for graphene production. This path presents an environmentally and economically sustainable use for a low-
                      value industrial stream. Electrochemical exfoliation is used to produce graphene nanosheets from petroleum coke, rather than
                      graphite. The final product is separated from the unreacted material by a two-step centrifuging process. SEM and TEM images
                      confirm that the final product contains few-layered nanosheets, and the Raman spectra confirm that the exfoliated coke product is
                      indeed graphene. Post-annealing of this product substantially increases the electrical conductivity. This new finding holds potential
                      for the petroleum industry to produce a value-added nanomaterial and enhance the economic impact of slurry oil and slurry oil-
                      derived coke streams by orders of magnitude; this route also allows these streams to be directed away from high-emissions uses.
                      npj 2D Materials and Applications (2021)5:75 ; https://doi.org/10.1038/s41699-021-00255-8
1234567890():,;

                  INTRODUCTION                                                                               consistently produced with high graphitic content and low
                  With the continuing rise in concern over sustainable resource use,                         impurity concentrations. Global needle coke production was at
                  the petrochemical industry faces challenges in managing each of                            1.1 million tons per year as of 2020, and it is expected to increase
                  its product streams. Even by-products of oil refining, such as                              to 1.5 million tons per year by 20266. However, these numbers are
                  petroleum coke, are difficult to utilize sustainably; coke is                               based on the demand for needle coke for the steel and lithium-ion
                  produced by heating resids or slurry oils from refinery units such                          battery industries; needle coke production can be significantly
                  as Fluid Catalytic Crackers. Coke is used as a fuel for heating in                         increased to meet additional demand if needed. Although
                  several industries, and the combustion of coke produces more                               petroleum (and therefore petroleum coke) is also a finite resource,
                  CO2 per fuel mass than coal1. Coke is also used in the steel and                           progress has been made toward producing needle coke from
                  aluminum industries as an anode for smelting, a process that also                          renewable feedstocks such as biomass7 or plastic waste8. Not only
                  emits greenhouse gases2. These concerns highlight the global                               can needle coke be a more permanent feedstock for graphene
                  need to repurpose existing petroleum streams such as coke and                              production, but this avenue also the petroleum portfolio away
                  its precursor oils toward sustainable end-uses (Fig. 1).                                   from high-emission end-uses.
                      Here, we demonstrate the use of petroleum coke as a feedstock                             Graphite-derived graphene is well-documented9–11, but coke-
                  for carbon nanomaterial production. Graphene, in particular, is an                         derived graphene has not been extensively explored. Prior work
                  exciting target because of its ongoing deployment into a range of                          on the production of graphene from coke has largely focused on
                  application fields including batteries, supercapacitors, structural                         graphene oxide (GO) and explored the effect of crystallinity on the
                  materials, transparent electronics, and flexible wearable devices3,4.                       resulting lateral size10,12,13. Ball-milling coke with stearic acid has
                  It is highly desirable to expand the suite of graphene precursors to
                                                                                                             also been explored14, but questions remain about the distinction
                  include existing industrial by-products.
                                                                                                             between the parent material and the final graphene-like product,
                      The economics of possible coke-to-graphene processes are
                  quite striking: needle coke, the highest quality grade of petroleum                        particularly in their Raman signature. This is likely related to a lack
                  coke, can be used for electrodes in steel production and can be                            of effective separation procedures in place.
                  purchased for ~$1500–3000/ton. Bulk graphene powder can be                                    Our group recently demonstrated the potential for high-yield
                  purchased at the lab scale for as little as ~$8/gram, orders of                            and scalable production of high-quality graphene nanosheets
                  magnitude more valuable than coke. This latter price will decrease                         using an electrochemical exfoliation (ECE) method in a com-
                  with scaleup, but this is still an order-of-magnitude increase in                          pressed expandable chamber15,16. The compressed reactor allows
                  economic value.                                                                            for expansion of the parent material as it is exfoliated while
                      In addition, petroleum coke provides an additional feedstock for                       maintaining electrical contact throughout the mixture. (This is
                  graphene production. Natural graphite is a finite source; it is                             superior to conventional electrochemical methods that use
                  estimated that 800 million tons can be recovered worldwide5.                               graphite monoliths as a parent material; the exfoliation process
                  Furthermore, much of it is difficult to use or unusable for                                 breaks apart the graphite monolith, losing electrical contact and
                  graphene production because only 10–15% of natural graphite is                             halting the reaction.) The resulting nanosheets are termed
                  actually graphitic carbon; most of it is amorphous and contains                            electrochemically exfoliated graphene (EEG). Simpler ECE proce-
                  silicate minerals or metals5. In contrast, needle coke can be                              dures have been attempted on coke before, but the resulting

                  1
                   Artie McFerrin Department of Chemical Engineering, Texas A&M University, College Station, TX, USA. 2ExxonMobil Chemical Company, Spring, TX, USA. ✉email: micah.green@tamu.edu;
                  rohan.a.hule@exxonmobil.com

                  Published in partnership with FCT NOVA with the support of E-MRS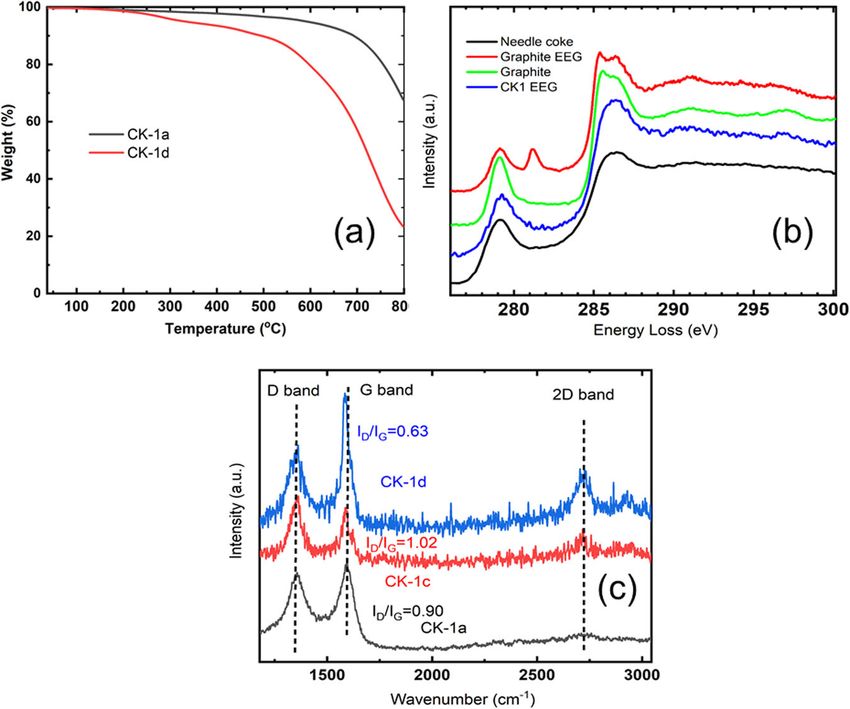
S. Saha et al.
                  2

                      Fig. 1 Schematic of Refinery Products. Simplified schematic of refinery operations and products: there is a need to push these petroleum
                      streams toward products with low end-use emissions, such as carbon nanomaterials.
1234567890():,;

                      Fig. 2   FE-SEM image of CK-1 parent material. The sample contains both (a) small and (b) relatively large (30–100 μm) particles.

                      Fig. 3 Schematic of the coke-graphene synthesis process. It contains four steps as described in the scheme as follows: pre-treatment, pre-
                      reaction separation, electrochemical exfoliation process, post-reaction separation process.

                      material either formed small graphene quantum dots or required           make needle coke the most promising coke candidate to act as a
                      additional post-processing exfoliation17,18.                             graphene precursor. The field emission scanning electron micro-
                        In this work, different needle coke grades are evaluated as the        scope (FE-SEM) images in Fig. 2 show the layered structure of CK-
                      parent material for the ECE process in a compressed chamber. The         1, with layer thicknesses that can be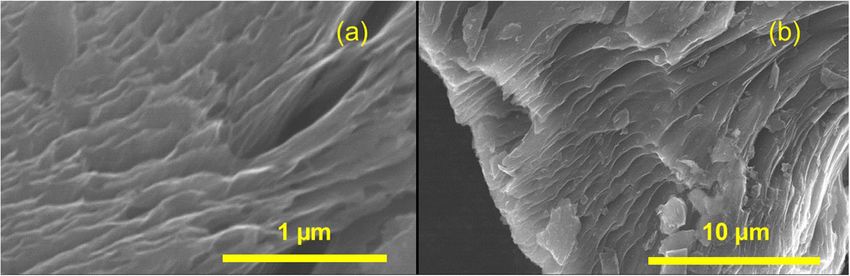
S. Saha et al.
                                                                                                                                                 3
conducting monolith, an external weight is placed on top of the          sheets frequently contain folds that may potentially mask such
membrane. Both the working and counter electrodes are                    features.) The coke-derived product has a smaller fraction of very
submerged in the electrolyte. Under a positive bias at the working       large particles relative to graphite-derived EEG, likely owing to the
electrode, CK-b samples are then exfoliated to CK-c (EEG). After         thorough post-processing separation.
the reaction, the reaction mixture is washed and then suspended             The yield of the coke-derived graphene product was ~1.6%,
in an ethanol-water mixture. The ECE product contained non-              which is lower than typical EEG yields of 10% or more (depending
exfoliated coke, smaller non-graphitic material, and the EEG             on reaction conditions) reported in our prior work, indicating that
product. To separate the graphene sheets (final product) from the         coke is more difficult to exfoliate than graphite15,16. However, this
undesired material, a two-step centrifuge process was followed as        value is far lower than the true yield because of the need for the
described in Supplementary Fig. 4d; the first centrifuge removes          centrifuge process post reaction to isolate EEG from both parent
the unreacted parent material, and the second centrifuge removes         material and impurities. Our prior work indicates that significant
the small, non-graphitic material.                                       graphene product remains in the unwanted material and can be
                                                                         recovered via multiple separation passes24. The remaining
Characterization of coke-derived graphene                                material may also be recycled back through the process as a
The FE-SEM images of CK-1b and CK-1c, the parent material and            parent material with no pre-treatment.
product of the ECE process, are shown in Supplementary Fig. 5a              In contrast, the ECE products of CK-2 and CK-3 did not contain a
and Supplementary Fig. 5b, respectively. These images show that          significant amount of well-defined, graphene-like sheets. Supple-
the ECE process breaks down some of the 40 μm-sized parent               mentary Fig. 9a shows an FE-SEM image of CK-3d. Although a few
material particles into smaller sheet-like graphene platelets and        large sheets are visible, most of the structures are not graphene-
some smaller non-graphitic particles.                                    like but are more similar to large needle-like structures. In
   More importantly, graphene-like nanosheets are clearly seen in FE-    addition, Supplementary Fig. 9b shows an FE-SEM image of CK-2d;
SEM images (Fig. 4a, b) of CK-1d (final product, reacted and then         graphene-like sheets are not visible in this image either. The
separated), confirming the major hypothesis of the paper. The lateral     presence of large plate-like and needle-like structures suggests
dimension of the coke-graphene sheets varies considerably, with the      that graphene was not successfully prepared from CK-2 or CK-3 by
majority of lateral sizes in the 1–3 µm range. The presence of           the ECE process. TEM images of CK-3d (Supplementary Fig. 9c) and
graphene sheets was further investigated by TEM imaging. Figure 4c,      CK-2d (Supplementary Fig. 9d) also do not show any sheet-like
d show HR-TEM images of CK-1d where graphene-like sheets are             structures. These ECE products (CK-2d, CK-3d) are quite different
clearly visible (additional TEM images can be found in Supplementary     than the graphene-like structure in CK-1d. Potential reasons for
Figs. 6, 7). Moreover, high-resolution imaging reveals a hexagonally     this difference may relate to the parent material structure.
packed crystalline lattice of sheets as seen in Fig. 4d. This lattice       Petroleum cokes are produced in a variety of manners, many of
corresponds to a graphitic structure and is virtually identical to the   which are proprietary. Although specific production details of each
structure observed on graphite-derived EEG shown in Supplemen-           coke are unknown, optical microscopy was carried out on each
tary Fig. 8. The sheets appear to be a single crystal, with no grain     parent material to distinguish their morphology. Note that CK-2
boundaries observed in the micrograph field of view. (However,            and CK-3 were received as relatively large pieces and required

Fig. 4 Electron Microscopy Analysis. Scanning electron microscopy: a and b SEM images of CK-1d (EEG, separated) and c and d TEM images
of CK-1d.

Published in partnership with FCT NOVA with the support of E-MRS                                npj 2D Materials and Applications (2021) 75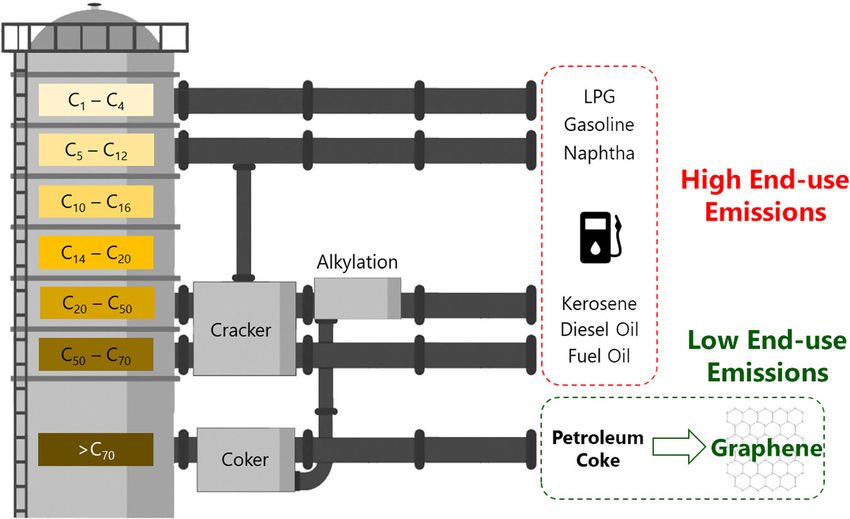
S. Saha et al.
4
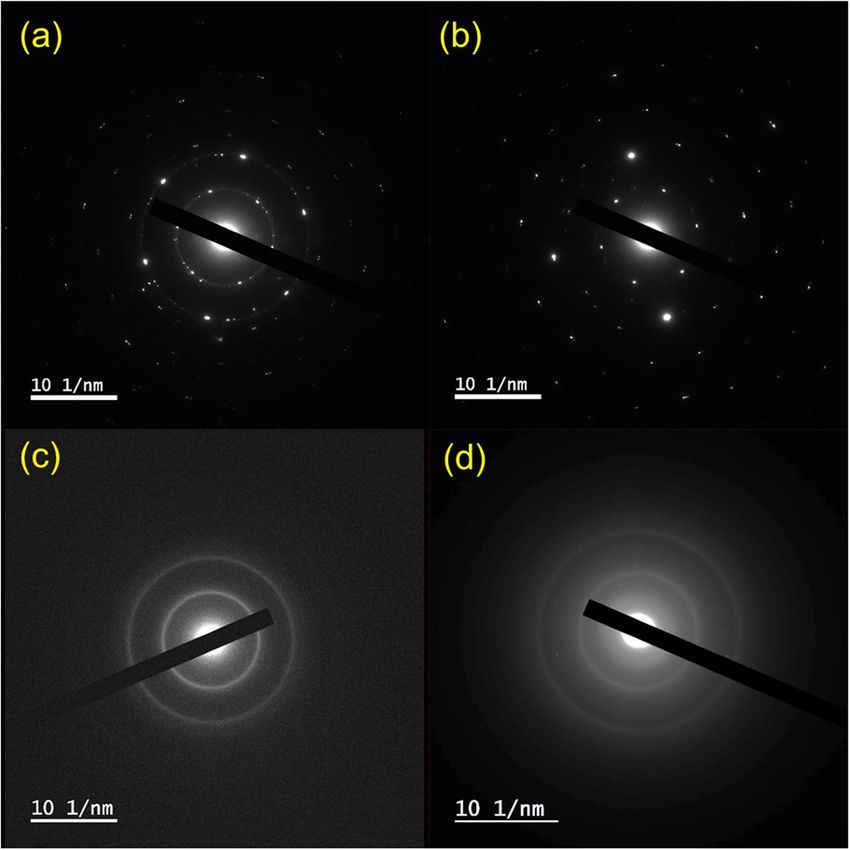
Fig. 5 Diffraction Patterns of Coke and Coke-derived graphene. Electron diffraction patterns of a CK-1d EEG, b graphite-derived EEG, c CK-
2d EEG, and d CK-1 coke.
grinding prior to the ECE process. The CK-1 powder was very fine sample shown in Supplementary Fig. S13. CK-1d material has oxygen
and has a significantly smaller particle size than CK-2 and CK-3. to carbon atomic ratio (O:C) of 0.29 which remains relatively low; in
The CK-1 particle edges are more jagged, angular, and distorted, addition, we did not observe much C–O bonding based on the C 1 s
whereas the CK-2 and CK-3 particles have more rounded edges peak fittings. This suggests a product that is more similar to
and no layers. These morphology differences may allow for graphene than GO25. Nitrogen element was not observed for this
differences in acid effects, electrolyte intercalation, and ease in sample, indicated by the XPS survey spectra (no peak shows ~399 eV
layer exfoliation. Optical images of each parent material are where N 1 s peak should be).
included in Supplementary Figs. 10–12. Aside from these Electron energy loss analysis was also performed to evaluate the
morphology factors, the three-parent needle cokes are quite level of oxidation. It was shown in prior work that GO has a sharp
similar, including in their Raman and TGA data (discussed below). peak immediately after the π* excitation peak at ~279 eV in
The electron diffraction pattern of CK-1d (Fig. 5a) shows a carbon k-edge26. The magnitude of this peak increases with an
crystalline structure with a well-ordered hexagonal arrangement increase in oxygen content. At ~10–15% oxygen, the magnitude
of atoms, confirming the formation of graphene-like nanosheets. of this peak becomes equal to the magnitude of the π* peak.
This pattern observed on CK-1d is similar to patterns observed in Figure 6b shows the spectra collected from CK-1a, graphite, and
graphite-derived EEG (Fig. 5b). In contrast, the electron diffraction EEG derived from graphite and the coke. Neither coke nor
pattern of the CK-1 coke parent material (Fig. 5c) shows broad graphite shows the peak corresponding to oxidation. Graphite-
(amorphous) rings. Similarly, CK-2d (Fig. 5d) shows similar features, derived EEG contains 10–15% of oxygen, which is consistent with
indicating an amorphous final product. There is a signature of prior findings, whereas the coke-derived EEG is considerably less.
these same features in the pattern for CK-1d, suggesting higher Raman spectra provide valuable information about carbonac-
amorphous content than graphite-derived EEG. eous materials. Generally, Raman generates two distinct peaks at
The oxidation content in the parent coke and EEG product can be ~1350 and 1570 cm−1 called the D and G band, respectively. The
assessed in multiple ways: in our prior work, we showed that G band is related to the graphitic structure (sp2), whereas the D
thermogravimetric analysis (TGA) can be used as a rough measure of band indicates a distortion or defect (sp3). In our data (Fig. 6c), the
oxygen content. TGA analysis of the parent coke and EEG product is relative intensity of the G band is significantly higher for CK-1d
shown in Fig. 6a. At ~700 °C, half of CK-1d is removed15. At the same than for the CK-1 parent or CK-1c. This indicates the isolation of an
temperature (700 °C), only ~10% of the mass was removed for CK-1a, sp2 structure. The Raman peak fitting results are displayed in
indicating that the degree of oxidation is higher for CK-1d than CK- Supplementary Fig. 14. In addition, more accurate values of the ID/
1a; this indicates that some oxidation may occur during ECE. IG ratios based on the intensities of the fitted D and G peaks are
However, the degree of oxidation is lower than that seen in GO or also included in Supplementary Fig. 14.
even in graphite-derived EEG15. X-ray photoelectron spectroscopy However, the most exciting finding was the appearance of a 2D
(XPS) was used to determine the surface composition of the CK-1d peak in the CK-1d Raman spectra (Fig. 6c). The parent coke has no
npj 2D Materials and Applications (2021) 75 Published in partnership with FCT NOVA with the support of E-MRSS. Saha et al.
5
Fig. 6 Thermogravimetric and Raman Analysis. Thermogravimetric analysis: a TGA of CK-1a and CK-1d (inert atmosphere). TGA of CK-1d was
carried out on freeze-dried material, b EELS spectra showing carbon k-edge in CK-1a, graphite, CK-1d EEG, and Graphite EEG, and c Raman
spectra of CK-1a, CK-1c, and CK-1d show different ID/IG ratios and 2D band characteristics for the parent material, material after the ECE
reaction, and after the post-reaction centrifuging process.
2D peak; this suggests that the parent coke lacks sufficient
graphitic content to show this classic graphite signature. A small Table 1. Electrical conductivity of coke-derived graphene
2D hump is present in CK-1c, which indicates that after the ECE buckypapers, as well as a CK-1d sample annealed for 12 h at 1100 °C.
process, a significant amount of graphene-like material is present.
The 2D peak is even larger (with no shoulder in the peak) in CK-1d, Electrical conductivity (S/m) Standard deviation
confirming that the centrifugation process separates the graphene CK-1d 56.9 1.2
product from unwanted material. Note that the difference
CK-2d 2.26 0.06
between these 2D peaks indicates that our process is isolating
CK-3d 2.87 0.04
the exfoliated graphene-like material from the parent material, not
converting it; the lack of a 2D peak in the parent coke indicates CK-1d annealed 474 11.9
that the maximum possible graphene yield will be considerably
lower than that of graphite.
In contrast, no significant difference was observed in the Raman microscopy results described earlier: CK-1d is graphene-like,
spectra for CK-2 and CK-3 before and after exfoliation. Supple- whereas CK-2d and CK-3d do not show a graphene-like
morphology.
mentary Fig. 15 shows the Raman spectra of CK-2a, CK-2c, and CK-
The electrical conductivity of the coke-derived graphene was
2d. The ID/IG ratio of CK-2d was only slightly lower than CK-2a and
lower than graphene-produced from graphite, so thermal anneal-
CK-2c. However, this does suggest that the ECE process is still
ing (500 °C for 12 h in a tube furnace) was carried out on CK-1d to
isolating primarily sp2 structures even from less crystalline
increase its electrical conductivity (Supplementary Table 2). This
precursors. A similar scenario is found for the Raman spectra of
step significantly improved the electrical conductivities of both
CK-3a, CK-3c, and CK-3d (Supplementary Fig. 16). XRD of the
graphite-derived EEG and CK-1d (Supplementary Table 3) to 9735
parent cokes (Supplementary Fig. 17) shows that all the starting
and 250 S/m, respectively.
material has (002) peaks at 26°.
Additional thermal reduction and annealing were carried out at
a range of temperatures and times for CK-1d to determine how
Electrical properties and annealing of coke-derived graphene both graphene structure and conductivity may be improved.
Vacuum-filtered films were made from the dispersions of both These studies show that temperature has a much greater impact
coke and coke-derived graphene. The electrical conductivities of on electrical conductivity than time does (Table 2). When the
parent CK-1, CK-2, and CK-3 were measured as 0.07, 0.23, and annealing time was increased from 12 to 24 h, the conductivity
0.38 S/m, respectively (Supplementary Table 1). Electrical con- increased only slightly from 250 to 258 S/m (at 500 °C). However,
ductivity increased significantly after the exfoliation and separa- when the annealing temperature was increased from 500 to
tion process; the electrical conductivities of the three CK-d 900 °C, the electrical conductivity increased significantly from 250
samples are summarized in Table 1. The electrical conductivity to 345 S/m (for 12 h of annealing). Furthermore, for annealing at
of CK-1d is high (~56.9 S/m), which can be attributed to its 1100 °C, the electrical conductivity is 474 S/m. For Li-ion battery
graphene-like structure. However, the other samples show applications, the required conductivity is between 10 and 1000 S/
relatively poor electrical conductivity. This is consistent with the m, so this is a suitable target for annealed CK-1d27,28.
Published in partnership with FCT NOVA with the support of E-MRS npj 2D Materials and Applications (2021) 75S. Saha et al.
6
Table 2. Electrical conductivities of CK-1d after annealing at various times and temperatures.
CK-1d CK-1d A1 CK-1d A2 CK-1d A3 CK-1d A4 Graphite powder
12 h at 500 °C 24 h at 500 °C 12 h at 900 °C 12 h at 1100 °C (for Li-Ion battery anode)31
Electrical conductivity (S/m) ~56.9 ~250 ~258 ~345 ~474 ~166
Standard deviation (S/m) 1.2 5.3 28 7.7 11.9
The electrical conductivity values are also compared with reported graphite powder for Li-ion battery anode34.
Energy loss analysis of coke EEG annealed at various temperatures aluminum industry. The highest quality and value, needle coke, is
did not reveal any difference in electronic structure (Supplementary produced by coking high-quality aromatic feeds like Fluid Catalytic Cracker
Fig. 18). One possible reason for the conductivity increase is the decant oil and is used to produce high-grade graphite electrodes for the
removal of covalently bound oxygen groups or adsorbed impurities. steel industry29. These three cokes differ greatly in their microscopic and
macroscopic structures. Anode coke has a sponge or honeycomb-like
However, this should be achieved at 500 °C and 12 h. Beyond 500 °C, morphology, and the least crystalline fuel coke is made of agglomerates of
the conductivity further increases, possibly due to the removal of spherical “shots”. All of these cokes have no long order in their structure.
other impurities or molecular restructuring29,30. The relationship Needle coke, on the other hand, is highly crystalline and has long needle-
between temperature and conductivity is related to the restructuring like structures. The high aromaticity and the ordered structure make
process, but this process is not yet fully understood. Note that the needle coke the most promising candidate to act as a graphene precursor.
improved conductivity may also result from improved graphene- The long-range order and aromaticity of needle coke can be further
graphene contacts in addition to the graphene structure changing enhanced by heat treatment29. Needle coke can also be graphitized by
during annealing. Considering the low initial content of oxygen in heating in an inert atmosphere at >2500 °C.
For this experimental work, dichloromethane and ammonium sulfate
coke-derived EEG, we conclude that reduction is not the main reason
were purchased from Sigma-Aldrich. Ethanol was purchased from Fisher
for the conductivity increase. (Additional data on the TGA of these Chemical. Three different petroleum cokes (pet-cokes) were used as parent
samples is found in Supporting Information, Supplementary Fig. 19). materials for the ECE process:
(i) Needle coke fines (CK-1),
(ii) Needle coke large particles (CK-2),
DISCUSSION (iii) Needle coke medium size particles (CK-3)
In this work, needle cokes were explored as an alternative feedstock The coke samples are modified as they go through the ECE process. To
to produce graphene. Both microscopy and Raman indicate that designate the material and stage of the process, a naming system is used
graphene was successfully prepared from needle coke fines via the as follows:
(a) Material that has been washed and pre-treated,
ECE process, with Raman analysis confirming that CK-1d contains (b) Material that has been separated (before reaction),
few-layer graphene sheets. In this process, the centrifugation before (c) Material that has been electrochemically exfoliated (EEG),
the ECE reaction is important for refining the reaction feedstock, and (d) Material (EEG) that has been centrifuged (after reaction) and separated
the centrifugation after the reaction is crucial for separating the from the other reaction products. For example, needle coke (CK-2) that is
graphene product from the unreacted parent material. The final between the separation and reaction steps is designated CK-2b.
graphene material can be modified through annealing to achieve
excellent conductivities appropriate for energy storage devices. Experimental procedure
These results show there is a promising pathway through which Wash and pre-treatment process: the parent material was washed with
industry can sustainably use a by-product stream to produce a dichloromethane and then deionized (DI) water via vacuum filtration to
valuable low-emissions material. This also means that slurry oil (the remove any impurities. The washed material was then pre-treated with 6 M
precursor to many cokes) can be re-routed to produce coke and nitric acid by mixing it with the material, using 1 mL of acid per gram of
coke-derived graphene rather than high-emissions fuels. The material. The mixture was kept in a stainless-steel autoclave container and
emissions associated with the actual ECE process will decrease per placed inside an oven at 120 °C for 4 h. The pre-treated material was washed
mass if the process is scaled up. Furthermore, this process is with DI water to neutralize the acid then dried overnight at 100 °C on a
hotplate. The three washed and pre-treated cokes are designated as CK-1a,
economically advantageous, converting a low-value stream into a CK-2a, and CK-3a.
high-value nanomaterial product. High-value carbonates are a Pre-reaction separation process: the particles in each parent material varied
substantial market, depending on conductivity and aspect ratio, greatly in size. Small particles, less fit for the reaction, were removed by
with values in the range of $10,000/ton; production of coke-derived centrifuging. The pre-treated material was mixed with water in a ratio of
EEG feeds into both the composites and electronics sectors of this 5 mg/mL and centrifuged for 10 min at 4000 rpm. The supernatant containing
market. the unwanted smaller particles was discarded, and the sediment was
collected. The separated parent cokes are designated as CK-1b, CK-2b, and
CK-3b. These CK-b materials were used as the starting material for the ECE
METHODS process.
ECE setup and reaction process: the pre-treated and separated material
Materials was compacted in a dialysis bag (length ~16 cm and width ~2.5 cm) that
In the coking process, the heaviest components of petroleum are was clipped on both ends. A platinum wire was inserted into the material
pressurized with steam and water to form solid petroleum coke. This as the working electrode and copper mesh was wrapped around the
process takes place inside a large vessel called a “coker unit”. The raw coke dialysis bag as the counter electrode. A known weight (~0.75 kg) was
that comes directly out of a coker unit is termed “green coke” and has placed on top of the dialysis bag and copper mesh, and the apparatus was
10–20 wt% volatile hydrocarbons. Petroleum cokes are categorized based submerged in 2 L of 0.1 M ammonium sulfate ((NH4)2SO4) solution. A
on their application, with three major grades: fuel coke, anode coke, and potential of 12 V was applied across the platinum electrode and copper
needle coke31,32. A coker unit could produce one of these three grades mesh to power the ECE process, and the reaction was run for 2 h. After
depending on the process temperature, duration of coking, and the quality reacting, the product was washed in DI water to remove the electrolyte.
of hydrocarbon feedstocks. Low-grade vacuum residues produce the The ECE product contained unreacted materials, smaller non-graphitic
lowest value fuel coke as a by-product which is high in impurities (heavy material, and the EEG product. The unseparated reaction products are
metals, sulfur, and nitrogen) and is used as fuel in electricity generation designated as CK-1c, CK-2c, and CK-3c.
and cement kilns. Relatively higher-grade vacuum residues are used to Post-reaction centrifuging process: the post-reaction separation of the
make anode grade coke, which has moderate value and is used in the final product was carried out in a two-step centrifugation method. First, the
npj 2D Materials and Applications (2021) 75 Published in partnership with FCT NOVA with the support of E-MRSS. Saha et al.
7
unseparated material was centrifuged for 10 min at low speed (2000 rpm). Received: 9 April 2021; Accepted: 5 August 2021;
In this step, unreacted larger particles were sedimented and discarded, and
the supernatant was collected. Second, the supernatant was centrifuged
again for 20 min at high speed (5000 rpm). In this step, unreacted, non-
graphitic smaller particles were removed in the supernatant. The sediment
of the second step was collected as the final product; these separated REFERENCES
coke-EEGs are designated as CK-1d, CK-2d, and CK-3d. 1. Andrews, A. & Lattanzio, R. K. Petroleum coke: Industry and environmental issues.
Yield calculation process: the yield of the coke-derived graphene (CK-1d) (Congressional Research Service, 2013).
was measured from UV-vis absorbance spectroscopy using an extinction 2. Shan, Y. et al. Rapid growth of petroleum coke consumption and its related
coefficient of 1293 L/g/m33. The absorbance measurement at 666 nm was emissions in China. Appl. Energy 226, 494–502 (2018).
used to calculate the concentration of EEG in the product dispersion. An 3. Liang, M., Luo, B. & Zhi, L. Application of graphene and graphene-based materials
example spectrum is provided in Supplementary Fig. 20. in clean energy-related devices. Int. J. Energy Res. 33, 1161–1170 (2009).
Annealing process: the annealing of CK-d powder was done in a tube 4. Jo, G. et al. The application of graphene as electrodes in electrical and optical
furnace (Thermo Scientific Lindberg/Blue M) under an argon atmosphere. devices. Nanotechnology 23, 112001 (2012).
During annealing, the sample was heated at the rate of 10 °C/min. CK-1d 5. Survey, U. G., S, O. & Survey, U. G. Mineral Commodity Summaries. (Government
was annealed at 500 °C for 12 h and 24 h and at 900 °C and 1100 °C for Printing Office, 2009).
12 h. The annealed samples were designated as CK-1d A1, CK-1d A2, CK-1d 6. Needle Coke Market: Global Industry, Size, Share, Growth, Trends, and Forecast,
A3, and CK-1d A4, respectively. After cooling, the powder sample was 2018–2026. Transparency Market Research (2018).
collected and dispersed in water by bath sonication. Buckypaper of the 7. Li, L. et al. Characteristics of the mesophase and needle coke derived from the
annealed sample was prepared through a vacuum filtration process. blended coal tar and biomass tar pitch. J. Anal. Appl. Pyrolysis 150, 104889 (2020).
8. Ko, S., Kwon, Y. J., Lee, J. U. & Jeon, Y.-P. Preparation of synthetic graphite from
Characterization techniques waste PET plastic. J. Ind. Eng. Chem. 83, 449–458 (2020).
9. Ren, S., Rong, P. & Yu, Q. Preparations, properties and applications of graphene in
Imaging of the parent coke materials was done on cold emission SEM
functional devices: a concise review. Ceram. Int. 44, 11940–11955 (2018).
Hitachi S-4300 at an accelerating voltage of 15 keV using a secondary
10. Sierra, U. et al. Cokes of different origin as precursors of graphene oxide. Fuel 166,
electron detector. Pieces of coke were directly deposited on the SEM
400–403 (2016).
sample holder with adhesive carbon film. The coke was conductive 11. Botas, C. et al. The effect of the parent graphite on the structure of graphene
enough that no beam charging was observed. oxide. Carbon 50, 275–282 (2012).
Raman spectra were measured using Horiba Jobin-Yvon LabRam HR 12. Sierra, U. et al. New alternatives to graphite for producing graphene materials.
with laser wavelength of 633 nm, laser power of 1.91 mW, exposure time of Carbon 93, 812–818 (2015).
10 s, and three accumulations. The “Auto” baseline correction method in 13. Xing, X., Zhang, X., Zhang, K., Jin, L. E. & Cao, Q. Preparation of large-sized
LabSpec was used for baseline removal. graphene from needle coke and the adsorption for malachite green with its
TGA and derivative thermogravimetric (DTG) traces were recorded using graphene oxide. Fuller. Nanotubes Carbon Nanostruct. 27, 97–105 (2019).
a TA instrument. For recording the TG/DTG traces, a heating rate of 10 °C/ 14. Sierra, U. et al. Coke-derived few layer graphene-like materials by mild planetary
min and a sample size of 3 ± 1 mg were used under an N2 atmosphere milling exfoliation. Fuel 262, 116455 (2020).
(flow rate 60 mL/min). 15. Achee, T. C. et al. High-yield scalable graphene nanosheet production from
Transmission electron microscopy was performed on a JEOL F200 cold compressed graphite using electrochemical exfoliation. Sci. Rep. 8, 14525
emission transmission electron microscope. Coke was ground for imaging (2018).
and suspended in alcohol. Exfoliated material was also suspended in 16. Hope, J. T. et al. Scalable production of graphene nanoplatelets for energy sto-
alcohol. The suspensions were sonicated and a droplet of the solution was rage. ACS Appl. Nano Mater., https://doi.org/10.1021/acsanm.0c02209 (2020).
deposited on a TEM grid with lacey carbon support film. Imaging was done 17. He, M. et al. Mass production of tunable multicolor graphene quantum dots from
at room temperature using 200 keV acceleration voltage. TEM images and an energy resource of coke by a one-step electrochemical exfoliation. Carbon
diffraction patterns were recorded with in situ One View camera (Gatan, 140, 508–520 (2018).
Inc.). Both coke and exfoliated material appeared stable under irradiation 18. Zhamu, A. & Jang, B. Z., Porous graphene/carbon composite balls for an alkali
even at high doses required for high-resolution imaging. metal battery anode (Google Patents, 2020).
Energy loss spectroscopy was performed with a JEOL F200 cold emission 19. Rao, R. et al. Carbon nanotubes and related nanomaterials: critical advances and
transmission electron microscope operated in scanning transmission challenges for synthesis toward mainstream commercial applications. ACS Nano
electron microscopy mode. An annular dark field detector was used to 12, 11756–11784 (2018).
search the sample and identify the appropriate spot for data collection. 20. Awadallah, A. E., Abdel-Hamid, S. M., El-Desouki, D. S., Aboul-Enein, A. A. & Aboul-
The spectrum image was recorded from a uniformly flat part of the Gheit, A. K. Synthesis of carbon nanotubes by CCVD of natural gas using
particle. Data collection was done with a combination of a Digiscan device hydrotreating catalysts. Egypt. J. Pet. 21, 101–107 (2012).
(Gatan Inc), and a Quantum GIF (Gatan Inc) operated in spectroscopy 21. Ibrahimov, H. et al. Carbon nanotubes obtained from natural gas by CVD. J. Surf.
mode. Later, individual spectra from the spectrum image were summed to Investig.: X-ray Synchrotron Neutron Tech. 13, 1244–1247 (2019).
reduce the noise associated with low dose data collection. 22. Wang, I.-W., Kutteri, D. A., Gao, B., Tian, H. & Hu, J. Methane pyrolysis for carbon
The surface chemistry of CK-1d was probed using an Omicron X-ray nanotubes and CO x-free H2 over transition-metal catalysts. Energy Fuels 33,
photoelectron spectrometer employing an Mg-sourced X-ray beam to 197–205 (2018).
irradiate the sample surface. The emitted photoelectrons from the sample 23. Mordkovich, V. et al. Synthesis of carbon nanotubes by catalytic conversion of
surface were collected by a 180° hemispherical electron energy analyzer. A methane: competition between active components of catalyst. Carbon 45, 62–69
takeoff angle of 40° between the sample surface and the path to the (2007).
photoelectron collector was used in all measurements. During all scanning, 24. Rountree, K. S., Shah, S. A., Sweeney, C. B., Irin, F. & Green, M. J. Graphene reflux:
charge neutralization by a dual-beam charge neutralizer was performed to improving the yield of liquid-exfoliated nanosheets through repeated separation
irradiate the low-energy electrons to eliminate the binding energy shifts in techniques. Nanotechnology 27, 505601 (2016).
the recorded spectra. The sample was dried under vacuum for 24 h to 25. Al-Gaashani, R., Najjar, A., Zakaria, Y., Mansour, S. & Atieh, M. A. XPS and structural
prevent any outgassing. High-resolution spectra were recorded at pass studies of high quality graphene oxide and reduced graphene oxide prepared by
energy (constant analyzer energy) of 30.0 eV with a step size of 0.05 eV. different chemical oxidation methods. Ceram. Int. 45, 14439–14448 (2019).
Component peak fitting and quantification of the spectra were carried out 26. Tararan, A., Zobelli, A., Benito, A. M., Maser, W. K. & Stéphan, O. Revisiting gra-
using CasaXPS curve fitting software (version 2.3.16). phene oxide chemistry via spatially-resolved electron energy loss spectroscopy.
Electrical conductivity was measured on buckypapers produced by Chem. Mater. 28, 3741–3748 (2016).
vacuum filtration (Fisher Scientific MaximaDry) using a four-point resistivity 27. Park, M., Zhang, X., Chung, M., Less, G. B. & Sastry, A. M. A review of conduction
probe powered by Keithley 2000, 6221, and two 6514. phenomena in Li-ion batteries. J. Power Sources 195, 7904–7929 (2010).
28. Ashuri, M., He, Q. & Shaw, L. L. Silicon as a potential anode material for Li-ion
batteries: where size, geometry and structure matter. Nanoscale 8, 74–103
DATA AVAILABILITY (2016).
The data sets generated during and analyzed during the current study are available 29. Mochida, I., Fujimoto, K.-i. & Oyama, T. Chemistry in the production and utilization
from the corresponding author upon reasonable request. of needle coke. Vol. 24 (Marcel Dekker, Inc: New York-Basel, 1994).
Published in partnership with FCT NOVA with the support of E-MRS npj 2D Materials and Applications (2021) 75S. Saha et al.
8
30. Franklin, R. E. Crystallite growth in graphitizing and non-graphitizing carbons. ADDITIONAL INFORMATION
Proc. R. Soc. Lond. Ser. A. Math. 209, 196–218 (1951). Supplementary information The online version contains supplementary material
31. Sawarkar, A. N., Pandit, A. B. & Samant, S. D. Petroleum residue upgrading via available at https://doi.org/10.1038/s41699-021-00255-8.
delayed coking: a review. Can. J. Chem. Eng. 85, 1–24 (2007).
32. Mancuso, L. & Arienti, S. in Integrated Gasification Combined Cycle (IGCC) Tech- Correspondence and requests for materials should be addressed to M.J.G. or R.A.H.
nologies. 121–144 (Elsevier, 2017).
33. Wajid, A. S. et al. Polymer-stabilized graphene dispersions at high concentrations Reprints and permission information is available at http://www.nature.com/
in organic solvents for composite production. Carbon 50, 526–534 (2012). reprints
34. Wang, C. W., Yi, Y. B., Sastry, A. M., Shim, J. & Striebel, K. A. Particle compression
and conductivity in Li-ion anodes with graphite additives. J. Electrochem. Soc. Publisher’s note Springer Nature remains neutral with regard to jurisdictional claims
151, A1489 (2004). in published maps and institutional affiliations.
ACKNOWLEDGEMENTS
We acknowledge the TAMU Materials Characterization Facility for the use of SEM
Open Access This article is licensed under a Creative Commons
facilities. We appreciate Julie Oh and Huaixuan Cao of TAMU for help in
Attribution 4.0 International License, which permits use, sharing,
characterization. Funding was provided by the ExxonMobil Chemical Company. adaptation, distribution and reproduction in any medium or format, as long as you give
appropriate credit to the original author(s) and the source, provide a link to the Creative
Commons license, and indicate if changes were made. The images or other third party
AUTHOR CONTRIBUTIONS material in this article are included in the article’s Creative Commons license, unless
Experimental work: S.S., P.L., M.J.M., B.J.C., K.A., S.Y., X.Z. Experimental design and indicated otherwise in a credit line to the material. If material is not included in the
analysis: S.S., P.L., S.Y., S.U., M.J.G., R.A.H. Writing the paper: S.S., P.L., M.J.M., B.J.C., S.Y., article’s Creative Commons license and your intended use is not permitted by statutory
S.U., M.J.G., R.A.H. regulation or exceeds the permitted use, you will need to obtain permission directly
from the copyright holder. To view a copy of this license, visit http://creativecommons.
org/licenses/by/4.0/.
COMPETING INTERESTS
The findings described in this paper are closely related to intellectual property held
by TAMU and ExxonMobil Chemical Company. © The Author(s) 2021, corrected publication 2021
npj 2D Materials and Applications (2021) 75 Published in partnership with FCT NOVA with the support of E-MRSYou can also read