Swimming meets statistics - Lancaster EPrints
←
→
Page content transcription
If your browser does not render page correctly, please read the page content below
Swimming meets statistics
      Harry Spearing applies extreme value theory to personal best swim times to rank swimmers and predict
      future world records

Traditional statistical techniques aim to draw conclusions about “typical” data. For this reason, the start point of
many traditional analyses involves the identification and removal of “outliers” from a data set. But what if the
data of interest are outliers?
   This is a situation we found ourselves in when modelling the extreme performances of athletes: personal best
times, world records, that sort of thing. Our solution was to adopt a theory which, rather than removing
“unusual” or “extreme” values, specifically targets them: extreme value theory (EVT).
   The initial impetus for our work was to create a method for fair and stable ranking in elite swimming. But
this later developed into a model to predict new world records, adjust swim times for differences in swimsuit
technology, and estimate the limits of human performance.1

Extreme value theory

Figure 1: Dummy data with two common methods of analysing extreme values: the block maxima approach (left) and the
peaks over threshold approach (right).

   To explain EVT and how it works, let us start with some dummy data, shown in Figure 1.
This could be data on rainfall on a particular day, or some other application in which we are particularly
interested in the tails, or extreme values, of the data. It turns out that, in general, the bulk of the data really
cannot tell us much about the extreme data points – the peaks in Figure 1. They behave quite differently. So, in
order to analyse these large and comparatively scarce values without having the main bulk of the data
interfering, we can follow two common approaches.
   In Figure 1 (left) we chunk the data into equal blocks of, say, 100 observations, which creates 10 equal-sized
blocks of data. Then we simply use the maximum value in each chunk (the red crosses) and disregard the rest of
the data. As the amount of data increases, either the number of blocks will increase, or we can increase the size
of each block. Once the number of blocks and the size of the blocks become large enough, the distribution of the
red crosses can be described by a particular class of distribution, called the generalised extreme value
distribution.
   An alternative method, Figure 1 (right), is to select a high threshold, such as the horizontal green line, and
only consider data above this threshold. As the number of data points increases, either the amount of data above
this threshold will increase, or we can raise the threshold. Once we observe enough data above a sufficiently
high threshold, the data points above the threshold are described by a different distribution, called the
generalised Pareto distribution. These conceptually simple approaches are the bedrock of EVT, upon which more complex models are constructed. They are not just clever mathematical tricks but can inform us about the real physical properties of the system (or mechanism) from which the data are generated. For example, these models include a parameter which, if found to be negative, tells us that there is a finite limit on how extreme the data can become. This feature is found in applications such as modelling wave height, since there is a limit on how high a wave can be. Interestingly, and somewhat reassuringly, we find the same thing in our analysis of extreme swim times – our model clearly indicates that there is a limit on how fast a human can swim. By simply calculating the value of this limit, our model can therefore determine the fastest swim time that is humanly possible in any particular event, and we can then see how close the current crop of swimmers are to this upper bound. EVT and swim data We were motivated to create a better ranking of elite swimmers because of issues with the existing approach. At present, swimmers are ranked based on the closeness of their personal best swim time to the world record in their event. The problem here is that some world records are considered “better” than others, so it is more challenging for swimmers to rank well in events that have “good” world records. Another issue is that, when the world records change, the rankings reshuffle. To create a fair and stable ranking, we need a consistent measure of the “quality” of a swimmer. The obvious choice would be to compare swim times, but this proves to be inadequate on its own when we want to compare between different swim distances, swim styles (called “strokes”) or swimmers of different gender. In addition, due to changes and improvements in training methods, nutritional science, and even swimwear technology, a fair comparison between swim times recorded many years apart is not feasible without some adjustment for the era in which the swim time was recorded. Fortunately, EVT can help solve these problems. Our data comprised the top personal best (PB) swim times in all 34 individual long-course swimming events (that is, those held in a 50 m pool) between the start of 2001 and the last quarter of 2018. We used a combination of the two modelling approaches previously described – the “block maxima” and “peaks over threshold” approaches – in constructing our model. We also took account of particular features observed in the data set. For example, between 2008 and 2010, we saw an increase in the number of recorded PBs. It was in this period that full-body swimsuits were introduced. These allowed athletes to move much faster through the water, but they were banned after only two years. Using these data and our EVT model, we calculated for each swimmer’s PB the probability that another swimmer could swim a faster time during the same era. This became the basis of our ranking system. The smaller the probability produced by our EVT model, the lower (better) the rank. Figure 2 shows our ranking of the top 20 PBs of the last 20 years, with 95% confidence intervals. The confidence intervals indicate that for a given PB, 95% of the time its true rank would be contained within these bounds. The rankings indicate that Sarah Sjöström and Katie Ledecky are far ahead of the field, with the absence of confidence intervals indicating that we are 95% sure that they have the best and second-best PBs of the past two decades.
Figure 2: Ranking of the top 20 personal best swims (and their swimmers), 2001–2018, with 95% confidence intervals.
Better-ranked swimmers are higher on the y‐axis.
As well as adjusting for era, our ranking also takes account of the years when full-body swimsuits were
allowed. The model includes two “swimsuit parameters”, where we assume any performance in the periods
2008–2009 and 2009–2010 to be swimsuit aided (with different swimsuit designs and materials used in each
period). By removing the swimsuit effects from our model, we are able to find a fair comparison between swim
times of those swimmers wearing a swimsuit and those not. For example, Table 1 shows that of
the 10 world records set by swimsuit-aided performances, most would not stand.
Table 1: World records set with swimsuits, adjusted swim times after removing swimsuit effects, and best corresponding
non‐swimsuit swim times. “Would-be” world records and world record holders, after adjusting for swimsuits, are in bold.
Event World record World record Adjusted world Best non-swimsuit swim time and
holder record swimmer
50 free M Cielo (2009) 20.91 21.18 21.11 Proud (2018)
100 free M Cielo (2009) 46.91 47.99 47.04 McEvoy (2016)
100 fly M Phelps (2009) 49.82 50.83 49.86 Dressel (2017)
200 fly M Phelps (2009) 111.51 113.33 112.71 Milák (2018)
200 back M Peirsol (2009) 111.92 113.47 112.96 Lochte (2011)
200 free F Pellegrini (2009) 112.98 114.99 113.61 Schmitt (2012)
200 fly F Zige (2009) 121.81 123.38 124.06 Jiao (2012)
400 free M Biedermann 220.07 223.13 220.08 Thorpe (2002)
(2009)
400 ind M Phelps (2008) 243.84 245.72 245.18 Lochte (2012)
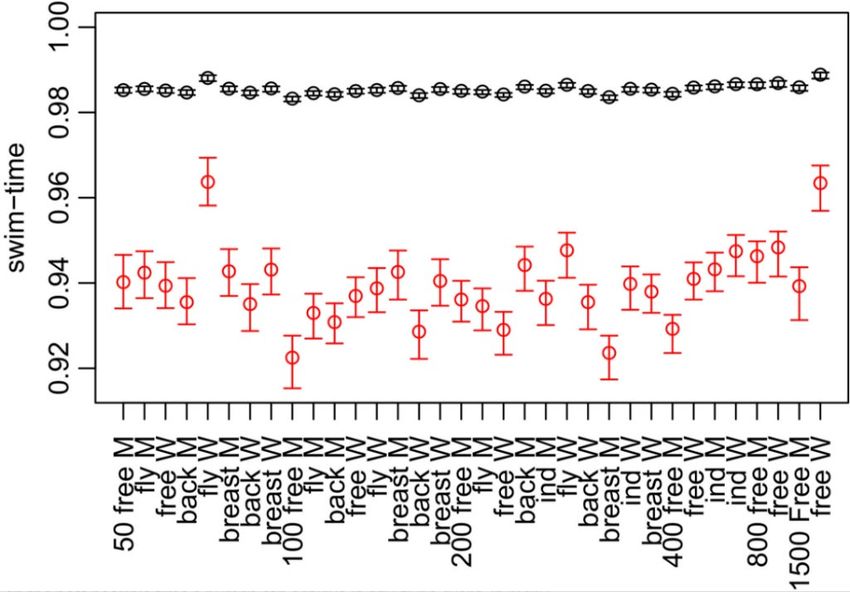
800 free M Lin (2009) 452.12 455.31 458.57 Sun (2011)The limits of performance One of EVT’s key results is the prediction of observations more extreme than those previously recorded, which here translates to predicting future world records. Figure 3 shows (in black) the predicted next world record time as a percentage of the current world record in each event. The events with the two largest values are those corresponding to the world records set by Sjöström (women’s 50 m butterfly) and Ledecky (women’s 1,500 m freestyle), our top-ranked PBs in Figure 2. The red points indicate the fastest times that are humanly possible according to our EVT model. Notice how our top-ranked PBs are within approximately 3% of the fastest possible time for these events, whereas other records, such as the men’s 100 m freestyle, could be reduced by about 8%. Figure 3: Predicted next world record (black) and fastest possible time (red), as a percentage of current world record for each event, according to our model. These are just some of the predictions possible when applying EVT to swim times. Other examples include predicting when new records will be broken and in which event they are likely to be broken next. But as interesting as such predictions are, the main result of our work is our ranking system, which improves on the existing rankings by fairly comparing across all events (and in a non-arbitrary way). With the right data it would be possible to extend our ranking approach to compare the swims and swimmers here with performances in junior swimming, with transgender athletes, or with para-swimming, making it possible for all athletes to compete side-by-side for the first time – which could make for a fairer sport overall.
Adam Peaty’s Project 56
In 2017, British swimmer Adam Peaty set a goal to swim the 100 m breaststroke in less than 57 seconds. He
achieved his “Project 56” with a world record time of 56.88 seconds (bbc.in/3nrQ7Kn). Peaty’s time was set
without the aid of the (now banned) full-body swimsuits. But how much faster might he have been had he been
wearing one? With our model, we can not only remove swimsuit effects but also add them. Applying these
effects to Peaty’s current world record sees it adjusted to 56.25 seconds with a swimsuit from 2008, and 55.96
seconds with a swimsuit from 2009. Even without a full-body swimsuit, a “Project 55” should be achievable.
According to our model, the fastest time humanly possible for the 100 m breaststroke is about 5% faster than
Peaty’s current world record.

Harry Spearing is a final-year PhD student, studying statistics at the STOR-i

Centre for Doctoral Training, Lancaster University. His PhD focuses on ranking

systems and prediction in sport.

Disclosure statement
The author declares no conflicts of interest.

Reference
    1.   Spearing, H., Tawn, J., Paulden, T., Irons, D., & Bennett, G. (2021) Ranking, and other properties, of elite
         swimmers using extreme value theory. Journal of the Royal Statistical Society, Series A, 184, 368–395.
You can also read