Text Annotation Graphs: Annotating Complex Natural Language Phenomena
←
→
Page content transcription
If your browser does not render page correctly, please read the page content below
Text Annotation Graphs: Annotating Complex Natural Language Phenomena

                                                                       Angus G. Forbes∗ , Kristine Lee† , Gus Hahn-Powell‡ ,
                                                                       Marco A. Valenzuela-Escárcega‡ , Mihai Surdeanu‡
                                                                             ∗
                                                                               University of California, Santa Cruz, angus@ucsc.edu
                                                                                †
                                                                                  University of Illinois at Chicago, khlee2@uic.edu
                                                                  ‡
                                                                    University of Arizona, {hahnpowell,marcov,msurdeanu}@email.arizona.edu

                                                                                                       Abstract
                                        This paper introduces a new web-based software tool for annotating text, Text Annotation Graphs, or TAG. It provides functionality for
                                        representing complex relationships between words and word phrases that are not available in other software tools, including the ability to
                                        define and visualize relationships between the relationships themselves (semantic hypergraphs). Additionally, we include a visualization
                                        mode in which annotation subgraphs, or semantic summaries, are used to show relationships outside of the sequential context of the
arXiv:1711.00529v2 [cs.CL] 1 Mar 2018

                                        text itself. These subgraphs can be used to quickly find similar structures within the current document or external annotated documents.
                                        TAG was initially developed to support information extraction tasks on a large database of biomedical articles. However, our software is
                                        flexible enough to support a wide range of annotation tasks for many domains. Examples are provided that showcase TAG’s capabilities
                                        on morphological parsing and event extraction tasks.

                                        Keywords: annotation, event extraction, online NLP tools, text visualization

                                        Figure 1: A screen capture of the annotation panel in the TAG software. Here a single sentence of biomedical text is shown, with both
                                        semantic (top) and syntactic (bottom) relationships toggled on.

                                                             1.    Introduction                                represents the event structure of biochemical reactions.
                                                                                                               Moreover, these approaches can be used to detect predi-
                                        According to systems biologist Arthur Lander, the domi-                cates (triggers), relations, and events within individual ar-
                                        nant icon of our current era is the “hairball” (Lander, 2010),         ticles in order to find connections to other corpora and to
                                        a visual depiction of a network of such complexity that the            draw inferences about relationships between texts.
                                        edges overlap so densely as to obscure the meaning of the
                                                                                                               We introduce a novel web-based annotation software appli-
                                        very relationships it is meant to explain. Part of the rea-
                                                                                                               cation, Text Annotation Graphs, or TAG, that provides a rich
                                        son for this shift from a more straightforward symbol (such
                                                                                                               set of tools for viewing and editing annotations that cap-
                                        as the double helix, which, while still complex, indicates
                                                                                                               ture complex natural language phenomena, such as deeply
                                        a more orderly, and potentially predictable machinery) to
                                                                                                               nested event structures (Figs. 1 and 6), syntactic dependen-
                                        the hairball, Lander writes, is the rise of the computational
                                                                                                               cies (bottom portion of Fig. 1), undirected relations, coref-
                                        tools that make it possible to generate vast amounts of “big
                                                                                                               erence resolution, and morphological parses (Fig. 5). TAG
                                        data,” as well as the realization that thorny problems gen-
                                                                                                               provides easily readable output for complex events and can
                                        erally involve the intersections between data drawn from
                                                                                                               be used to illustrate non-projective representations and even
                                        multiple, interacting systems.
                                                                                                               link predicate-less relations. It supports multiple languages
                                        Contemporary information extraction approaches seek to                 and data formats, allows users to view layers of annotations
                                        capture complex natural language phenomena, such as                    simultaneously, and includes interactive features for filter-
                                        those found in biomedical literature (Björne et al., 2010;            ing and editing annotations. Moreover, TAG implements
                                        Valenzuela-Escárcega et al., 2015). These biomedical arti-            progressive rendering or text annotations, making it pos-
                                        cles present new knowledge regarding biological processes              sible to load in large documents without loss in rendering
                                        which can be usefully described via a semantic graph that              speed.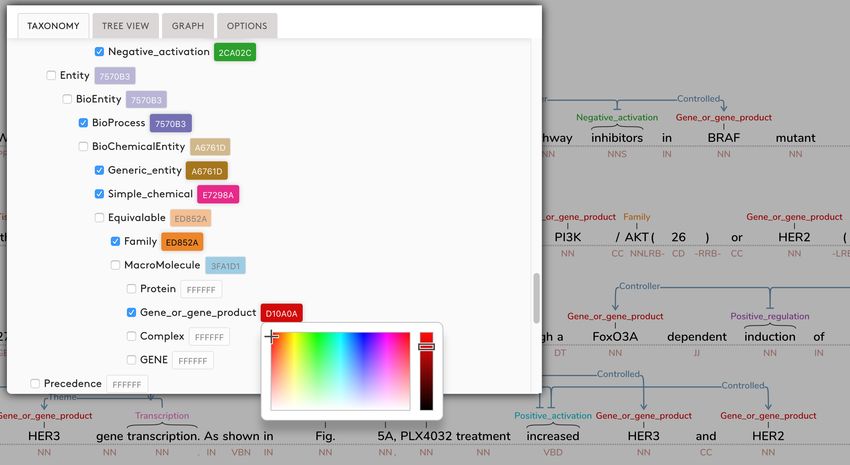
TAG runs on any modern web browser and is available                which also utilizes a container layout to identify linguistic
as open source software from https://github.com/                   structure while maintaining an explicit sequential represen-
CreativeCodingLab/TextAnnotationGraphs.                            tation that is easy to read. Although their approach eschews
                                                                   links that may lead to visual clutter, the WordBricks lay-
                   2.    Related Work                              out can be difficult to read once the container is more than
TAG is inspired by the BRAT rapid annotation tool (Stene-          even a few levels deep, or in cases where the user wishes
torp et al., 2012). BRAT is widely used for representing           to quickly identify relationships between words or phrases
syntactic structure, but can also represent semantic events,       across sentences or within longer passages.
and has been applied to a range of domain-specific NLP
tasks, including biomedical data (Verspoor et al., 2013).                 3.   Text Annotation Graphs (TAG)
BRAT supports a range of useful features that improve the          In this section, we introduce the main visualization and in-
overall efficiency of manual annotation tasks. However,            teraction features of the TAG software application. It con-
BRAT does not support the ability to draw links between            sists of three panels: the annotation panel, the tree panel,
links, which makes it difficult to represent relations link-       and the options panel. Upon opening the software via any
ing several predicate-less relations, a feature necessary to       modern browser, TAG shows the user a main annotation
completely describe complex events. Complex relations are          panel consisting of an example text snippet with both se-
previously explored by the authors in a range of different         mantic and syntactic annotations. A secondary tree panel
visualization projects that represent hierarchically-nested        shows a “semantic summary” of a selected subgraph, in
and/or clustered data derived from the machine reading of          which text is organized using a network layout that empha-
scientific texts describing biochemical events (Dang et al.,       sizes event relationships rather than text sequences. This al-
2015; Dang et al., 2016; Dang and Forbes, 2017; Dang et            ternative representation provides an overview of the event
al., 2017; Forbes et al., 2018; Murray et al., 2017; Paduano       that can augment the more traditional reading of a parse
and Forbes, 2015; Paduano et al., 2016).                           tree. Additionally, it can be used to highlight the results of
In addition to BRAT, a range of newer projects investigate         an event extraction process, and used as input for a struc-
visual encodings for specific annotation tasks. For exam-          tured search across other annotated documents. A third
ple, Sarnat et al. (2017) introduce a web interface for ex-        panel can be displayed on demand that provides the user
ploring a parse tree. By entering in a sentence, an interac-       with a range of options to change the visual appearance of
tive visualization is created that includes expand/collapse        text, to filter out particular annotation types, and to toggle
functionality, positional and color cues, explicit visual sup-     on or off syntactic or semantic annotations.
port for sequential structure, and dynamic highlighting to
                                                                   3.1.   Loading Data
convey node-to-text correspondence. The tool includes an
unusual representation of sequential structure as a container      TAG is meant to be agnostic to data schema and currently
of linked nodes. While this may help a user to distinguish         supports the following formats: BRAT standoff (Stenetorp
relevant structural elements, it demands a large portion of        et al., 2012), CoNLL-X (Buchholz and Marsi, 2006), and
the screen, which can make it difficult to view relationships      bio-C (Comeau et al., 2013). Additional formats can be
over longer sequences of text. TAG also utilizes a range           added as desired by following the import templates for the
of visual encodings to identify relationships and types, and       supported formats. The software looks for files in a spe-
includes an alternative representation of linguistic relation-     cial ‘data’ folder, and populates a drop down list to provide
ships. However, in TAG, a user can fluidly switch between          the option for the user to load in any of those data files.
these representations or view them side by side.                   By choosing an item in this drop down list, which is lo-
                                                                   cated in the top left of the page, the data file is loaded into
Another representation of a parse tree is used in the dis-
                                                                   the TAG application, and populates the annotation panel. A
plaCy software, introduced by Montani (2017). displaCy,
                                                                   taxonomy file can also be associated with a data file, which
however, is not equipped for annotation tasks and does not
                                                                   enables TAG to color annotations based on their taxonomic
provide any interaction beyond the ability to scroll through
                                                                   type, and makes it possible for users to search and filter by
a sentence (although more sophisticated functionality could
                                                                   type.
potentially be built on top of it). By default, the entire body
of text is placed on a single row, making it unwieldy for          3.2.   Annotation Panel
representing longer swaths of text.
                                                                   The annotation panel takes up the majority of the TAG ap-
WebAnno is a flexible tool that supports multiple annotation       plication, filling up the entire page, or only the top two
layers, and includes features to facilitate quality control, an-   thirds of the page if the tree panel is opened. The annotation
notator management, and curation (Yimam et al., 2014; de           panel presents the text from the data file across many rows,
Castilho et al., 2016). The visualrepresentation is similar        requiring the user to scroll down to see text from longer
to BRAT, and the interface focuses mainly on resolving dis-        passages. TAG uses a progressive rendering strategy so that
agreeing annotations between users. WebAnno includes a             it is possible to display even large documents without loss
variety of built-in annotation layers, such as dependency          in rendering speed. In each row, an annotation graph is
relations, co-reference chains, and lemma forms, but in We-        shown both above and below the text. At the bottom, syn-
bAnno annotation expressiveness is limited in that it is not       tactic annotation is shown; At the top, semantic annotation
possible to create nested arcs that link to other arcs.            is shown. Either syntactic or semantic annotations can be
Purgina and Mozgovoy (2017) introduce WordBricks,                  toggled on or off on demand.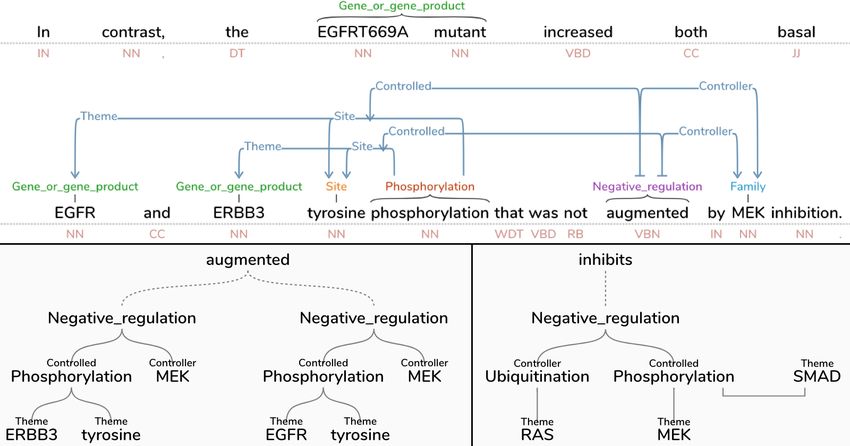
Figure 2: This screen capture shows the layout of a single sentence where annotation data is linked between elements which are presented
on different rows. A user can interactively reposition words and links as desired across multiple rows in order to emphasize particular
sections of text.

Figure 3: This screen capture shows a user updating the color of all nodes of type ‘Gene or gene product’ via the interactive color
picker. In the background, we can see that all examples of this annotation are updated dynamically. Selecting an annotation type that is
a parent of ‘Gene or gene product’, such as ‘MacroMolecule’ or ‘Entity’, would also update the color of ‘Gene or gene product’, along
with all its other children.
appears in the application, displaying a tree whose root
                                                                    node is the element that was clicked on. The tree repre-
                                                                    sentation makes it easier to see the structure of the relations
                                                                    between annotation events, which may be more difficult to
                                                                    read in the annotation panel, especially when related events
                                                                    are spread across multiple sentences or rows, or when a
                                                                    single sequence of text contains multiple events. Of course,
                                                                    the tree representation removes the context from which the
                                                                    events are extracted. However, by presenting both views at
                                                                    once, the user is able to see the summary semantics of the
                                                                    annotation relations alongside the annotations embedded in
Figure 4: The tree panel shows a semantic summary of a selected     the text.
annotation. The top and bottom left show the same annotation in     Fig. 4 shows an example of the tree panel. On the top,
both formats, in the the tree panel emphasizes the negative reg-
                                                                    the annotation panel shows a sentence containing two neg-
ulation events triggered by the word ‘augmented.’ The bottom
right shows the semantic summary of the sentence shown in Fig. 1,
                                                                    ative regulation events whose representation has a some-
highlighting the events triggered by the word ‘inhibits.’           what dense layout, even after the user has repositioned the
                                                                    event so that all involved words are on the same row. On
                                                                    the bottom left, we see the simplified tree representation
                                                                    of the events, which appears when the user clicks on the
TAG supports trigger-free relation mentions, providing the          word “augments.” On the bottom right, we see another tree
ability for the annotation graphs to utilize uni- or bi-            representation— the sentence described in Fig. 1— that
directional links between nodes, links, or a combination of         highlights the annotations related to the word “inhibits,”
nodes and links. The layout of the links is organized using         and which shows an example of a sibling relationship.
a custom algorithm that makes text labels on the graph easy
to read, and minimizes edge crossings. Fig. 1 shows an ex-          3.4.   Option Panel
ample of data loaded into the annotation panel that requires        The option panel provides various ways for the user to cus-
only one row.                                                       tomize the software. The options include: the ability to
A user can interactively reposition the words in the text, in-      toggle on or off the annotations above or below the text;
cluding seamlessly moving words to different rows. This             optimization options, such as the ability to hide the annota-
allows the user to emphasize particular word sequences by           tion graph when repositioning words; and a mechanism for
clustering a series of words closer together. Similarly, the        filtering annotations that contain (or do not contain) a spec-
vertices of links can be repositioned to improve the read-          ified taxonomic type. The user can also change the color
ability of the annotation graph. Fig. 2 show a view of an           of types defined in the taxonomy to highlight particular el-
annotated sentence across two rows. Initially, it was posi-         ements (a biomedical taxonomy can be seen in Fig. 3).
tioned by default along a single row; here we see an exam-
ple of how a user might choose to arrange the sentence in-                                4.   Examples
teractively. In this case, annotation data is linked between        Although TAG can be used for a wide range of annotation
elements which are on different rows and the syntax tree            tasks, here we highlight two examples that showcase situa-
has been toggled on.                                                tions that are difficult to represent using other software.
Annotations can be edited on demand. By clicking on a               4.1.   Morphological Parse
node, the user can select a type from a provided taxon-
omy, or freely type to replace the node’s current annotation.       Fig. 5 shows a pair of examples that demonstrate semantic
Links can be repositioned so that one or more of the con-           differences arising from morphological derivations of “un-
nections can instead connect to different link or node. A           lockable,” which, as noted by Larson and Ludlow (1993),
node or link can also be hidden or deleted, which also hides        could mean either “cannot be locked” (top) or “can be un-
or removes any links directly connected to it.                      locked” (bottom). As we can see, trees such as these can-
                                                                    not easily be visualized in BRAT, but can be represented in
Additionally, a user can change the color of a single node          TAG.
(or all nodes of a particular type) by clicking on a node,
which pops up an option panel, which allows the user to             4.2.   Event Annotation
select a color dynamically. Figure 3 shows a user updating          Fig. 6 shows a comparison of how BRAT and TAG han-
all nodes of type ‘Gene or gene product’ to be colored red.         dle the output of Reach (Valenzuela-Escárcega et al., 2015)
When changing the color of a type, a user can also update           when processing the title text of the paper “Induction of
all of its subtypes as well, if desired.                            p21 by p53 following DNA damage inhibits both Cdk4 and
                                                                    Cdk2” (He et al., 2005). Looking at extracted event E1, we
3.3.   Tree Panel                                                   can see that the Reach system finds that the positive acti-
By default the annotation panel fills up the entire screen,         vation event on the word “Induction” indicates p53 as the
but the bottom third of the application can be used to pro-         controller for p21. In the BRAT representation, the “con-
vide an alternative representation of the annotated text. By        troller” and “controlled” relations are separated, whereas in
double-clicking on any word or annotation, the tree panel           TAG it is easier to see that “induction” links p21 and p53
Figure 5: Two interpretations for “unlockable” arising from dif-
ferences in morphological derivation displayed in both BRAT
(left) and TAG (right). The top parse models the interpretation
“cannot be locked”, while the bottom shows “can be unlocked”.
Figure 6: Here we see screen captures of the same Reach events
(top) in both BRAT (middle) and TAG (bottom). In TAG, it is clear
through a single positive activation trigger. Similarly, TAG
that E2 and E3 both use E1 as a controller of Cdk4 and Cdk2.
is able to recognize that the a single word serves as a trig-
ger for two negative regulation events, and presents it as
a single event with two simultaneous relations. Here, it is
the entire positive activation event (E1) that serves as the the Bill and Melinda Gates Foundation HBGDki Initiative.
controller for the inhibition of both Cdk4 and Cdk2. Gus Hahn-Powell, Marco Valenzuela-Escárcega, and Mihai
Surdeanu declare a financial interest in lum.ai. This inter-
5. Conclusion est has been properly disclosed to the University of Arizona
This paper described the main functionality of the Text An- Institutional Review Committee and is managed in accor-
notation Graph software, showcasing its increased expres- dance with its conflict of interest policies.
sivity for visually representing complex natural language
phenomena for even large text documents. The software
has been used so far to successfully represent events ex-
Bibliographical References
tracted from biomedical articles, but we expect that it could Björne, J., Ginter, F., Pyysalo, S., Tsujii, J., and Salakoski,
prove useful for annotation tasks across a range of domains. T. (2010). Complex event extraction at PubMed scale.
Ongoing work is focused on extending TAG to support Bioinformatics, 26(12):i382–i390.
comparative tasks, for instance, to use both the top and bot- Buchholz, S. and Marsi, E. (2006). CoNLL-X shared task
tom half of each row to present the semantic annotations on multilingual dependency parsing. In Proceedings of
extracted from different systems. We are also investigating the Tenth Conference on Computational Natural Lan-
the use of TAG to provide a human readable visualization guage Learning, pages 149–164.
of an active learning loop, enabled through saving “diffs” Comeau, D. C., Islamaj Doğan, R., Ciccarese, P., Cohen,
between the loaded data and the edited data. Since TAG K. B., Krallinger, M., Leitner, F., Lu, Z., Peng, Y., Ri-
makes it easy to read and edit annotated events, we are ex- naldi, F., Torii, M., et al. (2013). BioC: A minimalist
ploring its use as a front end for crowdsourced user studies, approach to interoperability for biomedical text process-
such as those administered via Mechanical Turk, in order ing. Database, 2013:bat064.
to gather data that can be used to train classifiers. Dang, T. and Forbes, A. G. (2017). CactusTree: A tree
TAG is written in JavaScript and runs in any browser. It drawing approach for hierarchical edge bundling. In
makes extensive use of the SVG.js library,1 which produces Proceedings of the 10th IEEE Pacific Visualization Sym-
PDF quality output that is suitable for embedding in both posium (PacificVis), pages 210–214, Seoul, Korea, April.
online and printed documents. The software is open source Dang, T., Murray, P., Aurisano, J., and Forbes, A. G.
and freely available from our GitHub code repository.2 (2015). ReactionFlow: An interactive visualization tool
for causality analysis in biological pathways. BMC Pro-
Acknowledgements ceedings, 9(6):S6, August.
This work was funded by the DARPA Big Mechanism Dang, T., Pendar, N., and Forbes, A. G. (2016). TimeArcs:
program under ARO contract W911NF-14-1-0395 and by Visualizing fluctuations in dynamic networks. Computer
Graphics Forum, 35(3):61–69, June.
1
http://svgjs.com/ Dang, T., Murray, P., and Forbes, A. G. (2017). BioLinker:
2 Bottom-up exploration of protein interaction networks.
https://github.com/CreativeCodingLab/
TextAnnotationGraphs In Proceedings of the 10th IEEE Pacific VisualizationSymposium (PacificVis), pages 265–269, Seoul, Korea, Annotating the biomedical literature for the human vari- April. ome. Database, 2013:bat019. de Castilho, R. E., Mújdricza-Maydt, E., Yimam, S., Hart- Yimam, S. M., Biemann, C., de Castilho, R. E., and mann, S., Gurevych, I., Frank, A., and Biemann, C. Gurevych, I. (2014). Automatic annotation suggestions (2016). A web-based tool for the integrated annotation and custom annotation layers in webanno. In Proceed- of semantic and syntactic structures. In Proceedings of ings of 52nd Annual Meeting of the Association for Com- the LT4DH workshop at COLING 2016. putational Linguistics: System Demonstrations, pages Forbes, A. G., Burks, A., Lee, K., Li, X., Boutillier, P., 91–96. Krivine, J., and Fontana, W. (2018). Dynamic influence networks for rule-based models. IEEE Transactions on Visualization and Computer Graphics, 24(1):184–194, January. He, G., Siddik, Z. H., Huang, Z., Wang, R., Koomen, J., Kobayashi, R., Khokhar, A. R., and Kuang, J. (2005). Induction of p21 by p53 following DNA damage inhibits both Cdk4 and Cdk2 activities. Oncogene, 24(18):2929. Lander, A. D. (2010). The edges of understanding. BMC Biology, 8(1):40. Larson, R. K. and Ludlow, P. (1993). Interpreted logical forms. Synthese, 95(3):305–355. Montani, I. (2017). displaCy Dependency Visualizer. https://github.com/explosion/displacy, accessed Sept. 24, 2017. Murray, P., McGee, F., and Forbes, A. G. (2017). A taxon- omy of visualization tasks for the analysis of biological pathway data. BMC Bioinformatics, 18(2):21–1–13. Paduano, F. and Forbes, A. G. (2015). Extended LineSets: A visualization technique for the interactive inspection of biological pathways. BMC Proceedings, 9(6):S4, Au- gust. Paduano, F., Etemadpour, R., and Forbes, A. G. (2016). BranchingSets: Interactively visualizing categories on node-link diagrams. In Proceedings of the 9th Interna- tional Symposium on Visual Information Communica- tion and Interaction (VINCI), pages 9–16, Dallas, Texas, September. Purgina, M. and Mozgovoy, M. (2017). Visualizing sen- tence parse trees with wordbricks. In Proceedings of the 3rd IEEE International Conference on Cybernetics (CY- BCON), pages 1–4. Sarnat, A., Joshi, V., Petrescu-Prahova, C., Herrasti, A., Stilson, B., and Hopkins, M. (2017). Interactive visu- alization for linguistic structure. In Proceedings of the Conference on Empirical Methods in Natural Language Processing (EMNLP). Stenetorp, P., Pyysalo, S., Topić, G., Ohta, T., Anani- adou, S., and Tsujii, J. (2012). BRAT: A web-based tool for NLP-assisted text annotation. In Proceedings of the Demonstrations at the 13th Conference of the European Chapter of the Association for Computational Linguis- tics, pages 102–107. Valenzuela-Escárcega, M. A., Hahn-Powell, G., Hicks, T., and Surdeanu, M. (2015). A domain-independent rule- based framework for event extraction. In Proceedings of ACL-IJCNLP 2015 System Demonstrations, pages 127– 132. Verspoor, K., Jimeno Yepes, A., Cavedon, L., McIntosh, T., Herten-Crabb, A., Thomas, Z., and Plazzer, J.-P. (2013).
You can also read