The cost of floods: how rising waters will reshape our lives and our economy - M. Tedesco - AIR Centre
←
→
Page content transcription
If your browser does not render page correctly, please read the page content below
The cost of floods:
how rising waters will reshape our lives and our economy

                                  M. Tedesco

        Columbia University, NASA GISS and Sant’Anna School of Advanced Studies

                                February 5th, 2021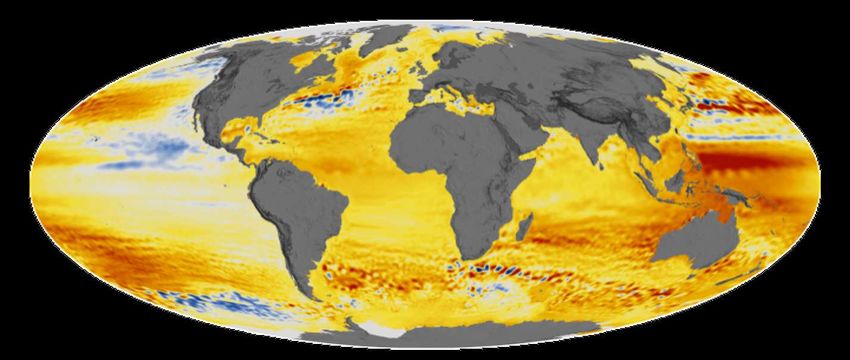
Outline
 •   Current state of climate and global temperatures

 •   General introduction on impacts of climate on economical and financial sectors

 •   Floods and sea level rise: Greenland, Antarctica and warming up the oceans

 •   Not just sea level rise: the compounding effect of storm surges, SLR, rain and
     other extreme events

 •   Examples of previous impacts of floods on economic and financial sectors

 •   Results from our current and previous projects

 •   Issues and recommendations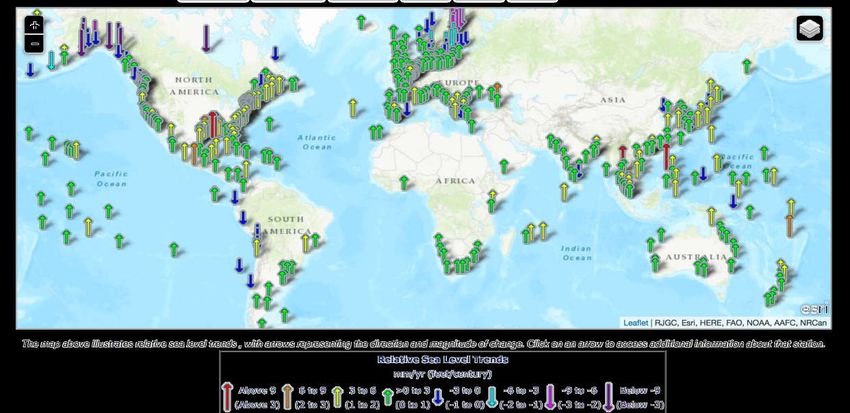
My Journey
   1999 ME
   Electrical
  Engineering

  (Microwaves)
My Journey
   1999 ME
   Electrical       2002
  Engineering    PhD, Physics
  (Microwaves)   (Electromagnetic
                 waves and snow
                     particles)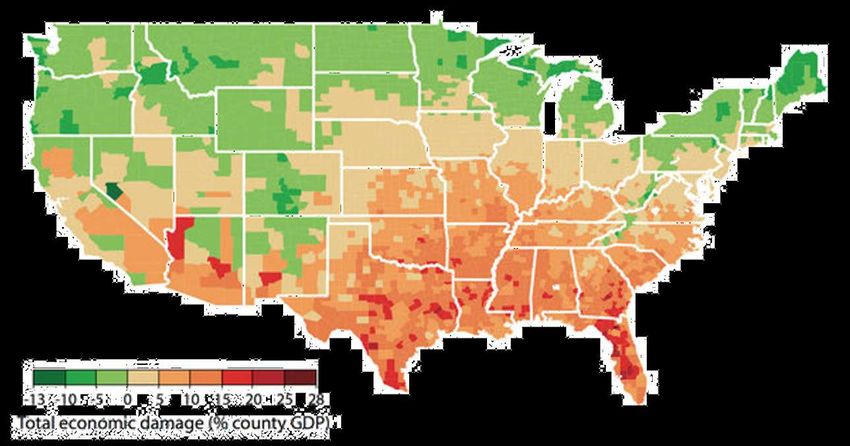
My Journey
   1999 ME
   Electrical       2002
  Engineering    PhD, Physics
                                      2003 - 2008
  (Microwaves)   (Electromagnetic
                                      NASA GSFC
                 waves and snow
                     particles)         (operational
                                    algorithms for snow)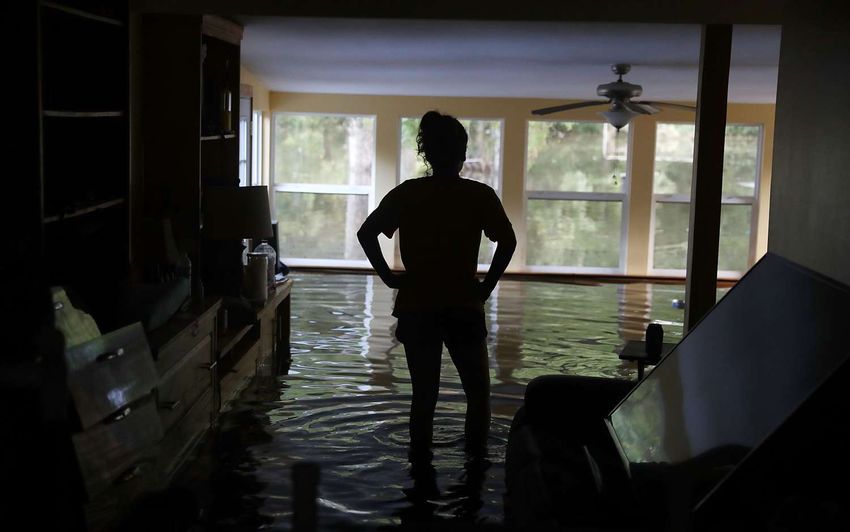
My Journey
   1999 ME
   Electrical       2002
  Engineering    PhD, Physics
                                      2003 - 2008
  (Microwaves)   (Electromagnetic
                                      NASA GSFC                  2007
                 waves and snow                                NASA GSFC
                     particles)         (operational
                                    algorithms for snow)   (algorithms for melting
                                                              of Greenland from
                                                                  satellites)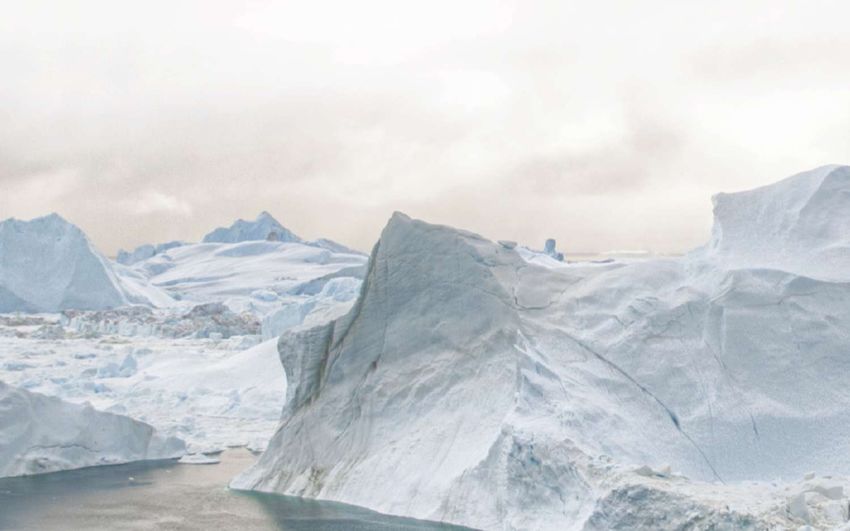

                                                                                       2008 - 2013
                                                                                      CCNY, Ass. Prof

                                                                                         (fieldwork in
                                                                                     Greenland, Antarctica
                                                                                        and models for
                                                                                            melting)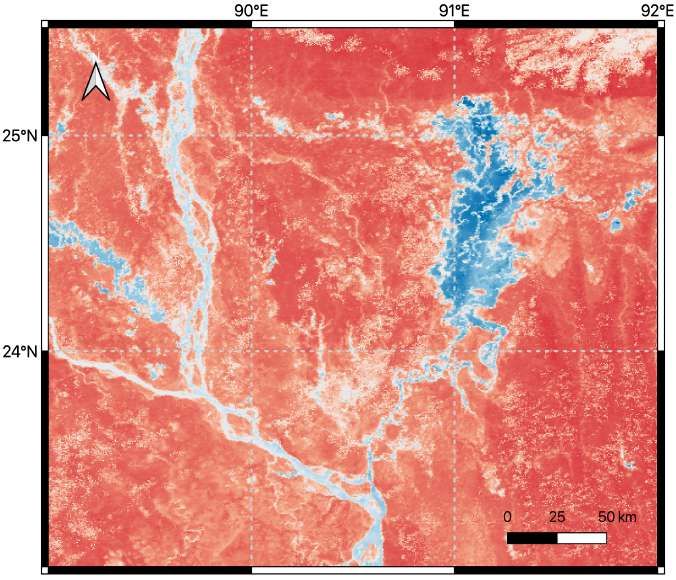
                                                              2013 - 2015
                                                              NSF Program
                                                               manager

                                                                   (Polar,
                                                            cyberinfrastructure)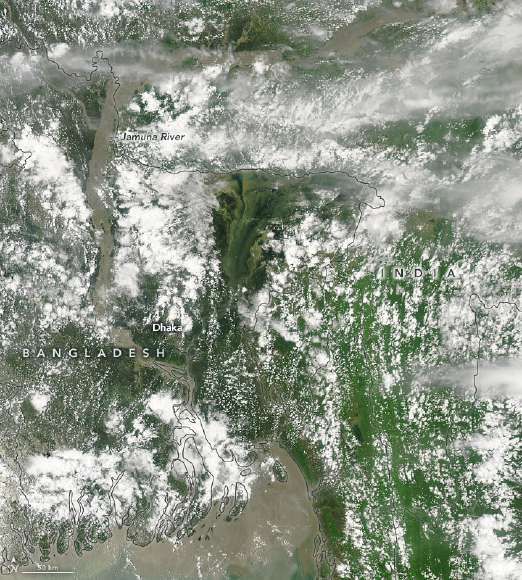
My Journey
   1999 ME
   Electrical             2002
  Engineering          PhD, Physics
                                                         2003 - 2008
  (Microwaves)         (Electromagnetic
                                                         NASA GSFC                  2007
                       waves and snow                                             NASA GSFC
                           particles)                      (operational
                                                       algorithms for snow)   (algorithms for melting
                                                                                 of Greenland from
                                                                                     satellites)

                                                                                                          2008 - 2013
                                                                                                         CCNY, Ass. Prof

                                                                                                            (fieldwork in
                                                                                                        Greenland, Antarctica
                                                                                                           and models for
                 NOW                                                                                           melting)
                                                                                 2013 - 2015
                                             2015 - now                          NSF Program
                                           Columbia/NASA                          manager

                                             Socio-economic                           (Polar,
                                            impacts of floods +                cyberinfrastructure)
                                          Arctic atmosphere and
                                              global changes
Where are we now ?
   Surface temperatures have been increasing since 1880s with the recent
                  years breaking records, year after year

                                                               Source: NASA GISS
Impacts and likelihood of events
“For the first time in the history of the Global Risks Perception Survey,
environmental concerns dominate the top long-term risks by likelihood
among members of the World Economic Forum’s multistakeholder
community; three of the top five risks by impact are also environmental”
Global Risk Report 2020, World Economic forum.. LET US TAKE A QUICK STEP BACK AND LET US LOOK AT DRIVERS FOR FLOODS …
The ocean is not a bathtub

           SLR is different in different places
Where does the heat go ?
The ocean is not a bathtub
        22 years SLR anomaly

                                  Nerem et al., 2018
                           [cm]
… and it is accelerating
GMSL from satellites show a rate of ~ 3 ±0.4 mm / yr
and an acceleration of 0.084±0.025 mm/yr2
16Relative contribution to SLR
Current Future (Bus. As usual)
Source: Mengel et al., PNAS, 2016
17SLR : what to expect ?
Sea level not only increasing but acceleratingLearning from the book of Earth about the past
to understand the future
Sea level could
rise between 6
and 15 m (18
and 40 feet)
based on
historical data
Sea level in the past
was much higher
than today, despite
similar CO2 and
temperatures levels
PAST
Source: Dutton et al., 2015Factors driving floods, not just sea level rise !
- Coastal erosion
- Extreme events (rain)
- High tides
- Stronger and more frequent
storms
- Sea level rise
- Hurricanes
The combination of the factors above is already creating
storm surges of several feet
(see Florence hurricane test case study next slides).Estimated $600 billion/yr loss by 2100
Cost: 1.2% GDP per °C warming
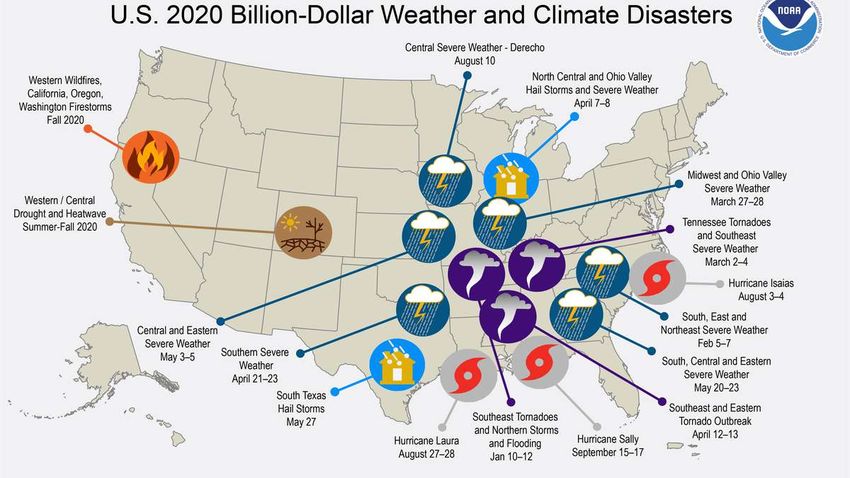
Hsiang et al., 2017$300 billion loss in 2017
2020 tied with 2017 and 2011
Flooding  is a is
      Flooding CURRENT        socio-economic
                  a current socio-economic threat threat

          The number of events related to flood with more than 1 Billion dollar impact over the recent
                decade has been considerably increasing with respect to the previous decade

                                                                                    https://www.ncdc.noaa.gov/billions/mapping/
Not only in the US …
Impacts of climate change on real estate investment
trusts (REITs): an example

                                                                                        •   35 percent of REITs properties globally
                                                                                            are currently exposed to climate
                                                                                            hazards

                                                                                        •   Of these, 17 percent of properties are
                                                                                            exposed to inland flood risk, 6 percent
                                                                                            to sea level rise and coastal floods, and
                                                                                            12 percent to hurricanes or typhoons.

                                                                                        •   U.S. markets most exposed to sea level
                                                                                            rise include New York, San Francisco,
                                                                                            Miami, Fort Lauderdale, and Boston.

                                                                                        •   37 Japanese REITs have their entire
                                                                                            portfolio exposed to the highest risk for
                                                                                            typhoon globally, representing $264.5
                                                                                            billion at risk in properties in Tokyo and
                                                                                            other Japanese cities.

     Source: https://geophy.com/insights/climate-risk-real-estate-and-the-bottom-line
                                                                                                                                26
The Thailand 2011 flood on two stocks …
Thailand 2011 Flooding
27Some outstanding issues we have identified …
q Lack of consistent metrics and spread of tools
q What is the role of man-built infrastructure on the exposure (e.g., number of buildings, location,
etc.) vs. the physical one ?
q Satellite data is great but what about “temporal” coverage ?
q Linking socio-economic vulnerability with climate impacts
q Access and acquisition of financial data (e.g., property values, rentals, managers portfolios)
q Lack of inter- and trans-disciplinary collaboration to “converge” towards common goals and
actions
2
8Some outstanding issues we have identified …
q Lack of consistent metrics and spread of tools
q What is the role of man-built infrastructure on the exposure (e.g., number of buildings,
location, etc.) vs. the physical one ?
q Satellite data is great but what about “temporal” coverage ?
q Linking socio-economic vulnerability with climate impacts
q Access and acquisition of financial data (e.g., property values, rentals, managers portfolios)
q Lack of inter- and trans-disciplinary collaboration to “converge” towards common goals and
actions
2
9What is the role of man-built infrastructure on the exposure (e.g.,
number of buildings, location, etc.) vs. the physical one ?
Test case # 1: Exposure of properties to Hurricane
Florence (2018) based on urbanization rate
30The “Bull-eye” expanding effect
Exposure of properties to Florence
Map of inundated areas estimated by FEMA (red) and through Distribution of properties and the Hurricane Florence when it
the Sentinel1 radar images (blue). The inset in the top left corner landed
shows the footprint of the several radar images to create the Property data provided by ATTOM ®
composite water extent map.
Formed August 31, 2018
Dissipated September 18, 2018
Highest winds 1-minute sustained: 150 mph (240 km/h)
Lowest pressure 937 mbar (hPa); 27.67 inHg
Tedesco et al., NHESS, 2019 Fatalities 24 direct, 30 indirect
Damage $24.23 billion (2018 USD)
Areas affected West Africa, Cape Verde, Bermuda, East Coast of the United States (especially
The Carolinas), Atlantic CanadaExposure and urbanization
1800 - 1900
Estimated property value (in 2018 US Billion$) exposed to the flooding generated
by Florence based on the distribution of properties
Tedesco et al., NHESS, 2019Exposure and urbanization
Exposure and infrastructure development
1900 - 1950
Estimated property value (in 2018 US Billion$) exposed to the flooding generated
by Florence based on the distribution of properties
Tedesco et al., NHESS, 2019Exposure and urbanization
1950 - 2000
Estimated property value (in 2018 US Billion$) exposed to the flooding generated
by Florence based on the distribution of properties
Tedesco et al., NHESS, 2019Exposure and urbanization
2000 - 2018
Estimated property value (in 2018 US Billion$) exposed to the flooding generated
by Florence based on the distribution of properties
Tedesco et al., NHESS, 2019Exposure and urbanization
Estimated property value (in 2018 US Billion$) exposed to the flooding generated
by Florence based on the distribution of properties
Tedesco et al., NHESS, 2019Addressing “coverage” issue of satellites …
Test case # 2: Using passive microwave data for
filling spatio-temporal gaps
37Satellite coverage (spatial and temporal)
• Satellites can provide crucial information for floods management
and mapping but limitations exist due to clouds or repeat time
• Despite recent advances in satellite data availability and
technology, limitations still exist
1. Optical Data limited by passing time and clouds
2. Radar data limited by narrow spatial coverage and repeat time
Passive microwave data can help in this regard
1. Longer satellite data record (since 1979)
2. Global daily coverage (99.9 % coverage daily)
3. No impact by clouds and small impact by rain
4. Can see “through” vegetation and other “obstacles”
5. Highly sensitive to waterPMW spatial resolution
[K]
Passive microwave has been historically delivered at
coarse spatial resolution (e.g., tens of Km)
This has made difficult its use in flood mapping and
servicesPMW spatial resolution
[K]
Passive microwave has been historically delivered at
coarse spatial resolution (e.g., tens of Km)
This has made difficult its use in flood mapping and
services
We have addressed this issue by employing a
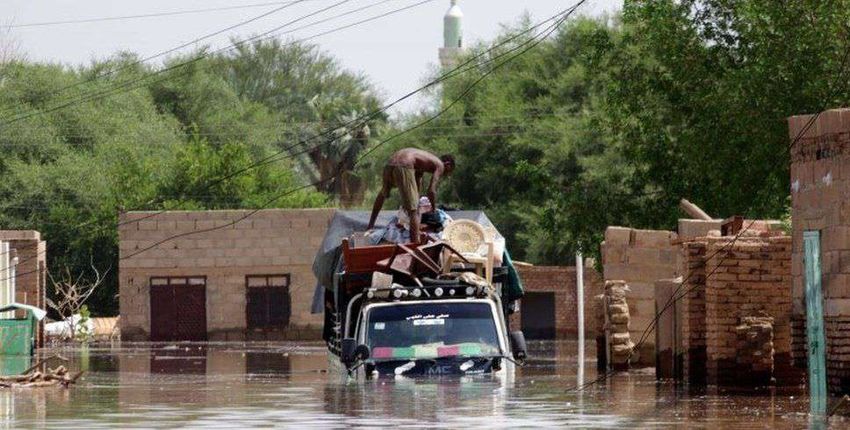
spatially enhanced product [K]Sudan flood of August 2019
Sudan area case study
KHARTOUM, 23 AUGUST 2019 - Heavy rains and floods across Sudan have affected
over 190,000 people in 15 different states in the country including Khartoum. 60 people
were reportedly killed in affected areasSudan flood of August 2019
Sudan area case study
FloodApplication to 2005 Bangladesh flood
Optical imageApplication to Bangladesh flood
Inundated area = 9777 Km2
Optical image Passive microwave
Passive microwave data can “see” through cloudsLinking socio-economic vulnerability with climate impacts
Test case # 3: Climate gentrification and floods in Florida
45Climate gentrification due to floods CG is based on a simple proposition: climate change impacts arguably make some property more or less valuable by virtue of its capacity to accommodate a certain density of human settlement and its associated infrastructure. The implication is that the price volatility associated with rent seeking, speculative investment, or superior purchasing power is either a primary or a partial driver of the patterns of urban development that lead to displacement (and sometimes entrenchment) of existing populations consistent with conventional framings of gentrification.
The little River/Little Haiti case
A Climate gentrification/flood tool
                                    Name              Variables                 Sector         Spatial        Temporal            Source

                                    Rental Price      Price                     Real Estate    Zip Code       2014 – 2020         Zillow

                                    Demographics      Poverty,                  Socio-         Census tract   2010 - 2018         CDC
                                    and socio-        unemployment, PCI,        Economic
                                    economic data     minority, etc.            Exposure
                                    Evictions         -       Number of         Real Estate    Census tract   2010 - 2018         Evicitionlab.org
                                                              requested and
                                                              performed
                                                              evictions
                                                      -       Demographics
                                                              and ethnicity
                                    % of rental       Percentage of rental      Real Estate    Census tract   2014 - 2018         County
                                                      properties in the area

                                    National Risk     -       Risk Exposure     Exposure       Census tract   2014 - 2018         FEMA
                                    Index (NRI)               to Riverine and   Socio-
 A tool to identify and address                               Coastal           Economic
                                                              flooding
 drivers of climate
 gentrification associated with     Seal Level Rise   Projection of             Exposure       Shapefile      N/A (1 ft through   FEMA
 floods and real estate market                        inundated areas for
                                                      different SLR
                                                                                                              10 ft)

 (specifically rent in this case)                     scenarios
                                    Opportunity       Boundaries of areas       Real           Census tract   2017                HUD
                                    Zones             designated as             Estate/Expos
                                                      Opportunity Zones         ure
GC “Score” Little River / Little Haiti is properly identified by the tool as exposed to GC associated with rent increase exceeding national average
GC “Score”

                                                           High percentage of    LOW PCI (e.g.,
                                                           people living below   between 5k and 10k
                                                           poverty level         US$/year)

   Little River / Little Haiti is properly identified by
   the tool as exposed to GC associated with rent
   increase exceeding national average
                                                           High concentration
                                                                                 Low Education
                                                           of African-american
Gentrification between 2014 and 2018 Reduction of percentage of people below poverty level and in number of people with only high school diploma
Total evictions
                                              Evictions
                                              Low number of evictions in
                                              Biscayne

   High number of evictions in Little River
Total evictions
Evictions
High number of evictions in Little River (gentrifying area) vs an almost
absent number of evictions for the contiguous area (non gentrifying)
300.00
250.00
200.00
TOTAL NUMBER
Little River
150.00
100.00
50.00
Miami shore
0.00
01
02
03
04
05
06
07
08
09
10
11
12
13
14
15
16
Cumulative evictions between 2014 and
20
20
20
20
20
20
20
20
20
20
20
20
20
20
20
20
2018
Low number of evictions in
BiscayneThe house sale market supports GC process
• Average prices for home
Little Haiti sales begins increasing
(gentrifying area) in Little Haiti in 2014,
where we identify the
gentrification process
starting
• House prices
skyrocketed in the
Biscayne gentrifying region.
(not gentrifying)
• This did not happen in
the contiguous area ,
where gentrification is
not occurring.Some final thoughts …
• Floods are currently impacting many sectors of the financial, social and economic
systems and this will increase in the future
• Remote sensing technologies can provide data at daily (or sub-daily) temporal
scales globally, paving the way to service-oriented products through the merging
with models, in-situ data and machine learning technologies
• Properly quantifying the role of urbanization on exposure is key to plan future
cities accordingly
• Socially vulnerable people are already impacted by floods in direct and indirect
ways and quantitative information is crucial for, for example, advocacy groups
• Inter-disciplinary and cross-disciplinary collaborations are crucial for the necessary
“convergence” toward implementation of solutions for local communities or
governments for undertaking proper measures towards increasing resiliency and
developing adaptation measures (please contact me if you are interested in being
involved in an ongoing effort in this regard)Thank you !
mtedesco@ldeo.columbia.edu
Or
cryocity@gmail.com
@cryocityYou can also read