The Cost of Inequality - putting a price on health - Les Mayhew - Centre for the Study of Financial Innovation - International ...
←
→
Page content transcription
If your browser does not render page correctly, please read the page content below

The Cost of
Inequality -
putting a price
on health
Les Mayhew

                  CSFI
                  Centre for the Study of
                  Financial Innovation
CSFI

The Centre for the Study of Financial Innovation is a non-profit think-tank, established in 1993 to look at future
developments in the international financial field – particularly from the point of view of practitioners. Its goals include
identifying new areas of business, flagging areas of danger and provoking a debate about key financial issues. The
Centre has no ideological brief, beyond a belief in open markets.

                                Trustees
                                David Lascelles                                    Sir Malcolm Williamson
                                John Hitchins                                      Carol Sergeant
                                Mark Robson

                                Governing Council
                                Giles Andrews                                      Alex Fraser
                                Farmida Bi                                         Jonathan Ford
                                David Birch                                        Paul Greatbatch
                                Roger Bootle                                       Tim Jones
                                Philip Brown                                       Angela Knight
                                Alex Brummer                                       Karel Lannoo
                                Ben Caldecott                                      Simon Lewis
                                Alexandra Carn                                     Michael Mainelli
                                Nick Carn                                          Les Mayhew
                                Rob Churcher                                       David Pitt-Watson
                                Michael Cole-Fontayn                               John Plender
                                Andy Davis                                         Neil Record
                                Margaret Doyle                                     Peter Wilson-Smith
                                Alexander Evans

                                Staff
                                Director – Andrew Hilton
                                Co-Director – Jane Fuller
                                Events and Office Co-ordinator – Alex Treptow
                                Funding and Publications Co-ordinator – Jack Kunkle
                                Programme Co-ordinator – Leighton Hughes

               This CSFI publication is available through our website www.csfi.org

Published by Centre for the Study of Financial Innovation (CSFI)

Email: info@csfi.org
Web: www.csfi.org

ISBN: 978-1-8381398-2-7

Printed in the United Kingdom by Heron Dawson & Sawyer

CSFI – 73 Leadenhall Market, London EC3V 1LT – Tel: 020 7621 1056 – E-mail: info@csfi.org – Web: www.csfi.org            I
CSFI

Contents

Foreword ................................................................................................................................................. iv

Preface ..................................................................................................................................................... v

Summary ..................................................................................................................................................1

Introduction ..............................................................................................................................................3

Chapter 1: Life, health and working lives defined ......................................................................................6

Chapter 2: Drilling down to district level ....................................................................................................9

Chapter 3: Results ..................................................................................................................................12

Chapter 4: Effects of changes in LE, HLE and WLE on public expenditure and GDP ..............................16

Conclusions ............................................................................................................................................19

Appendix ................................................................................................................................................21

About the author.....................................................................................................................................23

CSFI – 73 Leadenhall Market, London EC3V 1LT – Tel: 020 7621 1056 – E-mail: info@csfi.org – Web: www.csfi.org                                               III
CSFI

Foreword
The UK Government is planning a ‘levelling up’ White               Les tackles the problem head-on by analysing the
Paper for the autumn, so this new research by Les                  fundamental causes of inequalities in a refreshingly
Mayhew is very timely.                                             innovative way, using basic demographic concepts like
                                                                   health and life expectancy, and then linking them to
Much of the White Paper will be focused on narrowing               basic economic variables such as economic activity, GDP,
regional inequalities. But will that be enough? Listening          public spending and taxes. By quantifying the link
to the debate on inequalities, one will be forgiven for            between good health, life span and economic output
thinking that “levelling up” is just about pumping                 in a simple way, this means that we can now say what
investment into an area, and hoping that everything                the economic value would be of an increase in healthy
will be alright. Sadly, it is not as easy as that. Yes,            life expectancy on working lives, and on life expectancy
infrastructure - such as new hospitals and schools and             itself. Les then uses his findings to test scenarios aimed at
better transport connectivity - and jobs are important.            quantifying the economic value of health improvements.
But so also is human capital, and if that capital is
not up to scratch there will be greater mismatches in              In principle, his approach means we can address such
productivity between rich and poor areas, more ill-health          questions as whether life extensions are affordable
and shorter working lives.                                         without improvements in health, the central role of
                                                                   productivity in paying for an ageing society, and wider
This is only part of the story, because the proportion of          questions such as the future of work and remuneration
life spent in good health is negatively correlated with            in the information age. Although his approach is still
lifespan to an economically devastating effect. We know,           experimental, he sets out clearly his findings thus far,
for example, that life expectancy varies by up to 12               their implications for policy and also the next stages in
years between top and bottom deprivation percentiles.              the research. Les joined the ILC in October last year as
For those living in the most deprived areas, it leads to           head of global research, but has had a long association
shorter working lives, earlier exit from the workforce,            with the ILC over many years. We look forward to
higher health and welfare spending - and very often also           working with him in the next stages of this work, and
to economic hardship. The sadness is that just throwing            applying the findings and insights in our wider work.
money at the problem, while welcome, will not cure
it. Inequalities in society are deeply embedded – they
have been around for as long as we have been measuring
them, and probably since the dawn of time. More
importantly, they have been getting worse, as all the                                                        David Sinclair
latest research suggests.                                                    Director, International Longevity Centre (ILC)

IV                              CSFI – 73 Leadenhall Market, London EC3V 1LT – Tel: 020 7621 1056 – E-mail: info@csfi.org – Web: www.csfi.org
CSFI
Preface
This is the fourth paper by Professor Les Mayhew that various communities of which England is composed.
the CSFI has published. All four have looked at health (Les looks at 150 English districts for which data is
and ageing as they affect UK society and the economy available.) And second, it proposes a hypothetical local
– and, indeed, the tough financial choices that the tax as a way to reflect the degree of local deprivation and
government will have to make going forward. to predict the impact that government interventions
might have.
This paper, however, differs in two important ways.
The paper is aimed squarely at policy-makers who will
First, it is very much an ‘early harvest’ of work that have to make tough decisions on health and well-being
Les is currently undertaking. Indeed, it could be – decisions that go beyond simple promises to boost
seen as a prospectus for a much more comprehensive life expectancy. Obviously, I want to thank Les for
study that (I hope) he will be able to carry out. And, producing the paper – and to urge him to take the work
second, it is directly addressed to the ‘levelling up’, further. I also want to thank the Business School at City
post-Covid agenda to which this particular government University (soon to be the Bayes School) for its support.
is committed. Potentially, it gives politicians and
government officials a new way of looking at the causes And, I want to thank my colleague, Jane Fuller, who
of inequality – and a metric by which they can assess the worked hard with Les on the paper. That it reads very
efficacy of various policy interventions. well is testimony to her.
It is also new in two ways. One is that it makes a very
clear distinction between overall life expectancy, working
life expectancy and healthy life expectancy – and
illustrates how they do not move in lockstep, but are Andrew Hilton
greatly affected by the relative level of deprivation in the Director
CSFI – 73 Leadenhall Market, London EC3V 1LT – Tel: 020 7621 1056 – E-mail: info@csfi.org – Web: www.csfi.org VCSFI
Number 138 July 2021
The Cost of Inequality – putting a
price on health
Les Mayhew
Summary
One of the UK’s great achievements is that people are points based on current data and policies. Although early
living longer than they did just a few decades ago. But results are only indicative, they speak to the simplicity of
an ageing population has its cost: it increases pressure the approach and to its potential applications as the UK
on health and social care, on welfare payments and tries to ‘build back better’ after Covid-19 and to ‘level
on pensions – and hence on taxes. At the same time, up’ deprived areas.
however, it is recognised that older people can make a
big contribution to the economy, although poor health We also show that it is generally more efficient to focus
remains an obstacle to them doing so. The inequalities policy on increasing healthy life expectancy than on
can be seen in different parts of the UK, manifesting
extending the total life span. The latter would tend
themselves in shorter working lives, higher healthcare
to shunt more health and care costs to the end of life
costs, higher welfare payments and income poverty.
without extending working lives. In principle, these costs
At present, there is no simple measure that links health could be met by, say, increasing the state pension age and
on the one hand to economic disadvantage on the by higher taxes, but there are diminishing returns and a
other – and so to the tax burden that is needed to pay heavy price would have to be paid. Productivity growth,
for health and welfare services. Nor is there adequate long the Achilles’s heel of the UK economy, would help,
understanding of how working lives respond to health but is not guaranteed and could widen inequalities
improvements, or of the efficacy of focusing spending on further.
treating the sick versus policies designed to maintain and
improve health. This paper challenges the conventional What is new about the methodology applied in this
wisdom by proposing a novel way of thinking about study is the way we measure the scale of this inequality.
inequalities that links health to wealth and to the We do this by imagining a situation in which each
economy. local area is responsible for financing its own public
services and that the tax base is people’s earnings. In
We show, for example, that a one-year extension in other words, we hypothesise that a local tax is levied to
healthy life expectancy would add around 3.4 months to cover healthcare costs, welfare benefits for those sick and
working lives and 4.5 months to overall life expectancy – unable to work, and state pensions. Areas in good health
and that is could reduce income taxes by 0.6 percentage and with high levels of economic activity would require
CSFI – 73 Leadenhall Market, London EC3V 1LT – Tel: 020 7621 1056 – E-mail: info@csfi.org – Web: www.csfi.org 1CSFI
lower tax rates to support the sick and elderly; the reverse nearly two years – but working life by less than one year.
would be true for areas of poor health, lower economic The latter, relatively modest, effect suggests that other
activity and an ageing population. measures are also needed, such as an increase in the state
pension age.
Differences in these hypothetical tax rates between
districts provide a summary measure of inequality. The report urges the government’s new Office for Health
They also indicate how this might be mitigated by Promotion2 to support joined-up research that offers
policies aimed at improving health and productivity. real solutions. This means working not only with bodies
Our approach means that we can quantify the scale that promote improvements to healthy life expectancy
of disadvantage suffered by any local area, identify and longevity, but also with those focusing on raising
the causes of that disadvantage and improve decision- productivity and levels of economic activity as part of
making on what needs to be done to reverse it. the ‘levelling up’ agenda.
To do this, a total of 150 districts in England were
2 The new Office for Health Promotion, announced in March 2021, will
analysed and divided into 27 categories according to lead national efforts to improve and level up the health of the nation by
three ratings – high, medium and low – for each of tackling obesity, improving mental health and promoting physical activity.
It will sit within the Department of Health and Social Care.
the three key life spans: life expectancy, healthy life
expectancy and working life expectancy. For the majority
of districts, average healthy life expectancy falls short
of the state pension age. Indeed, as noted in a previous
CSFI report, The Dependency Trap1, economic activity
rates start to decline from the age of 50 and the trend
accelerates into old age.
Applying measures of average earnings and state pension
and benefit payments, an imputed tax rate can be
worked out for each district – as if it were making these
payments itself out of local earnings. These tax rates
range from 21% to 33% – with the highest rates in the
districts that would least be able to afford them. This
both captures the need for redistribution of tax revenues
and points to the economic advantages of levelling up.
The research also considered the impact of changes in
healthy life expectancy. For instance, an addition of
five years to HLE would increase life expectancy by
1 Mayhew. L.D. (2018) The Dependency Trap – Are we fit enough to face
the future? Centre for the Study of Financial Innovation (CSFI). Special
CSFI report in conjunction with the Business School (formerly Cass), City
University, London.
1 Mayhew. L.D. (2018) The Dependency Trap – Are we fit enough to face the future? Centre for the Study of Financial Innovation (CSFI). Special CSFI report
in conjunction with the Business School (formerly Cass), City University, London.
2 The new Office for Health Promotion, announced in March 2021, will lead national efforts to improve and level up the health of the nation by tackling
obesity, improving mental health and promoting physical activity. It will sit within the Department of Health and Social Care.
2 CSFI – 73 Leadenhall Market, London EC3V 1LT – Tel: 020 7621 1056 – E-mail: info@csfi.org – Web: www.csfi.orgCSFI
Introduction
Successive studies have shown that inequalities are deeply We can be sure that focusing on improving HLE will
embedded in the UK economy. Even though closing the make a positive difference. People would be able to work
gap, or ‘levelling up’, is now high on the political agenda, and save for longer, and health services would be under
these inequalities manifest themselves in different ways – less pressure. What is missing is the interaction between
through educational attainment, incomes, health, wealth HLE, economic activity and income levels, and how to
and so on. One particularly telling indicator is the gulf put a value on the related causes of disadvantage – or
in life expectancy of 12 years between the top 1% of the on the benefits of tackling them. This risks repeating
population, who live in the least deprived districts, and the mistake of designing policy with too narrow a focus.
those in the bottom 1%, who live in the most deprived.3 The crucial question is how to deliver this ambition in a
more integrated way.
How to count the cost of inequality is more complicated
than simply cherry-picking a few statistics on why some An unhelpful trend is that income inequalities are firmly
areas perform better or worse. Is it due to poor health, entrenched and, indeed, have increased slightly in recent
economic deprivation or other factors? This paper years. There has long been evidence of the downward
offers more meaningful measurements in an inclusive trend in labour’s share of GDP, with globalisation
framework that builds on actual evidence. and technological change as the oft-cited causes (e.g.
OECD, 20155). The higher share accruing to capital
Why is this important? In 2018, the Secretary of State has been associated with higher income inequality - and
for Health and Social Care stated an ambition to increase by extension with inequality of health outcomes (e.g.
healthy life expectancy (HLE) in England by at least Thomas Piketty 20136).
five years by 2035, while also reducing the gap in life
expectancy between the richest and the poorest groups. Inequality in sharing the benefits of GDP growth has
A delay in providing the details is not surprising given affected geographic areas and socio-economic groups
the intervention of Covid-19; however, the pandemic differently. We can see this, for example, among the
also highlighted public health inequalities. large number of adults aged over 50 but yet to reach
state pension age who are economically inactive through
Others have added their voice. For example, the All redundancy, long-term sickness or disability, or as a
Party Parliamentary Group (APPG) on longevity, in result of skill gaps. Such disadvantages are felt most
a report published in April 20214, asserts that the UK acutely in ‘left behind’ areas – especially where wages
has the worst health outcomes in Europe and that this and benefits are the main sources of income.
is a drag on economic growth. It argues for a political
commitment to level up health and says that “whatever In this paper, we introduce a new way of measuring
the evidence shows” needs to be done should be done. the scale of this disadvantage. We imagine a situation
The newly established Office for Health Promotion is in which each local area is responsible for financing its
expected to play a major role in this. own public services out of taxes, and that the tax base
3 Mayhew, L. , G. Harper, G. and A.M. Villegas (2020) An investigation 5 Keeley, B. (2015) Income Inequality-The gap between rich and poor.
into the impact of deprivation on demographic inequalities in OECD
adults , Annals of Actuarial Science, 14, pp. 358–383 doi:10.1017/ 6 Piketty, T. (2013). Le Capital au XXIe siècle (Paris: Seuil).
S1748499520000068
4 All Party Parliamentary Group for Longevity. Levelling Up Health (April,
2021).
3 Mayhew, L. , G. Harper, G. and A.M. Villegas (2020) An investigation into the impact of deprivation on demographic inequalities in adults , Annals of
Actuarial Science, 14, pp. 358–383 doi:10.1017/S17484995200000682
4 All Party Parliamentary Group for Longevity. Levelling Up Health (April, 2021).
5 Keeley, B. (2015) Income Inequality-The gap between rich and poor. OECD
6 Piketty, T. (2013). Le Capital au XXIe siècle (Paris: Seuil).
CSFI – 73 Leadenhall Market, London EC3V 1LT – Tel: 020 7621 1056 – E-mail: info@csfi.org – Web: www.csfi.org 3CSFI
is local people’s earnings. A local tax would be levied to four main arguments for this approach:
cover healthcare costs, welfare benefits for those sick and
unable to work, and state pensions. Clearly, areas where • Identifying the main contributors to the cost
the general level of health is good and where economic of inequality provides a rigorous basis for the
activity levels are higher would require lower tax rates to ‘levelling up’ agenda.
support the sick and elderly. Equally, the reverse would
be true for areas of poor health, lower economic activity • Human capital is a primary driver of well-being
and an ageing population. and wealth, and so priority should be given to
promoting productivity, healthy behaviour and
The differences in these hypothetical tax rates are an investment in education and skills.
important proxy for the underlying financial pressures
on public services and pensions, and for the inequality • Reducing the wealth gap between different areas
between areas. It is, we believe, the first time anyone has of the UK should reverse the phenomenon of
attempted to produce this kind of metric. people, resources and investment gravitating to
more affluent areas.
Putting a value on longevity and health
It might seem cold-blooded to put a price on poor • Assuming one can establish a direct relationship
health, rather than simply to call for more spending on between output and health, the use of a tax metric
services. But by measuring the financial impact of poor provides a better basis for redistribution.
health on welfare payments, pensions and earnings,
policy-makers can turn their attention to preventative An underlying assumption is that people are
action, as well as reacting more effectively to immediate independent actors who engage with and react to the
needs. To give an illustration, higher labour participation environment in which they live and work. In our model,
generates more output, more consumption and a larger we make health the focus of attention. For example, we
tax base, but only if the workforce is in good health. In know that ill health correlates with adverse lifestyles,
an ageing population, this is challenging since declining shorter healthy life expectancy, higher mortality and
health limits participation rates and has a negative effect shorter working lives. Structural economic changes, such
on healthcare costs and welfare payments. as the decline in manufacturing, have contributed to ill
health through redundancy, long-term unemployment
We can think of the cost of inequality as the required and income loss. In the new digital economy, the same
size of the tax base 7 to fund these essential services. If might occur in sectors such as retail, as shopping habits
this were funded locally, inequality would be exacerbated change and jobs are automated.
by the adverse impact of high taxation on living
standards. Equally, there would be a financial, as well as Figure 1 shows the hypothesised interactions between
social, ‘dividend’ if inequalities could be eliminated and life, health and working life expectancy. If healthy life
the savings re-invested. The analytical approach used for expectancy is improved, we would expect this to feed
this study estimates what the hypothetical local tax rates through into both longer life expectancy and longer
would need to be to pay for pensions, disability benefits working lives. If it falls, we would expect the opposite to
and healthcare based on the earnings of a representative happen.
population over its life course. To summarise, there are
7 Modelled tax rates are an indicator of this process but not the solution.
This is because economies rely on other sources of income such as rents
and dividends accruing to landlords, business owners and ordinary savers.
Although wealth creation is not just about jobs, jobs sustain families and
communities especially in the early stages of the life cycle.
7 Modelled tax rates are an indicator of this process but not the solution. This is because economies rely on other sources of income such as rents and dividends
accruing to landlords, business owners and ordinary savers. Although wealth creation is not just about jobs, jobs sustain families and communities especially
in the early stages of the life cycle.
4 CSFI – 73 Leadenhall Market, London EC3V 1LT – Tel: 020 7621 1056 – E-mail: info@csfi.org – Web: www.csfi.orgCSFI
Figure 1: Impact (positive or negative) of rising or falling healthy life expectancy on life expectancy and
working life expectancy
+ve
Positive +ve
Negative
Life Healthy life Working life
expectancy expectancy expectancy
-ve
Positive -ve
Negative
It is important to remember that increases in life providing healthcare, social care and financial support
expectancy are not always matched by health to the elderly, relative to the rest of the population,
improvement. Indeed, there is evidence that the will increase. Furthermore, economic resources will be
gap between overall life expectancy and healthy life diverted from wealth creation into care provision.
expectancy is widening. This means that the cost of
CSFI – 73 Leadenhall Market, London EC3V 1LT – Tel: 020 7621 1056 – E-mail: info@csfi.org – Web: www.csfi.org 5CSFI
Chapter 1:
Life, health and working lives defined
Life expectancy (LE) is defined as the number of years Activity rates slowly decline from about age 50 – in other
a person is expected to live, and is usually measured words, long before 65 – for reasons such as poor health,
at birth. However, since we are interested in working redundancy and age discrimination in staff recruitment
lives, it is more appropriate for us to use a starting age and retention. This trend continues into old age and
of 20. Healthy life expectancy (HLE) is defined as accelerates, so that that the availability of potential
the number of remaining years that an individual can workers falls sharply beyond age 70.8 To give an example,
expect to have in “very good” or “generally good” health. suppose the average activity rate between 20 and 65 is
HLE is strongly correlated with the number of years 0.8, this would equate to 0.8 x 45, or an average 36-year
an individual can expect to live without a long-term working life in the steady state. In theory, labour market
limiting illness. Although it is theoretically possible for data could be extended to whole life with some small
HLE and LE to be the same, in practice most people die tweaks to current labour market statistics, but the extra
after a long or short illness. The gap between LE and working years generated post-65 would be quite small in
HLE is the number of years spent in greater or lesser ill this numerical example owing to the much lower activity
health at the end of life. rates in old age.
Working life expectancy (WLE) is the expected number 2.1 A worked example
of years spent being economically active between It will be recalled that we calculate LE, HLE and WLE
entering work and retirement. If we assume, for the sake from age 20; therefore, to determine the expected ages
of argument, a post-education starting age of 20 with of death, the onset of ill health or when work ceases,
a conventional end point of 65, then a person who is we need to add 20 years to our data. We call the new
active for the whole of that period has a working life of figure ‘life span’ or ‘expected age of death’, which is
45 years. For many, the age of 65 corresponded with the simply LE at age 20 plus 20 years. Its main purpose is to
UK’s state pension age (SPA), but with the raising of enable us to present results in chronological age, rather
the SPA to 66 (and further increases planned), this no than in terms of future years of life. Thus, if LE at age
longer applies. Because of the scrapping of the default 20 is 60 years then the expected age of death would be
retirement age, SPA is increasingly redundant as a proxy 80; if HLE at 20 is 50 years, then the expected age at
for retirement age although it remains a reference point which poor health kicks in would be 70; if WLE is 40
for welfare and other administrative purposes. years then the expected age when a person ceases to be
economically active is 60.
There are practical reasons why any single ‘retirement’
age should be treated with caution. Labour force data To analyse local variations in LE, HLE and WLE,
shows that economic activity reaches a maximum of we need a dataset that covers each domain in every
between 80% and 90% between the ages of 20 and 55. local authority area in England, without overlap.
8 Mayhew, L.D. (2018) The Dependency Trap – Are we fit enough to face
the future? Centre for the Study of Financial Innovation (CSFI). Special
CSFI report in conjunction with the Business School (formerly Cass), City
University, London.
8 Mayhew, L.D. (2018) The Dependency Trap – Are we fit enough to face the future? Centre for the Study of Financial Innovation (CSFI). Special CSFI report
in conjunction with the Business School (formerly Cass), City University, London.
6 CSFI – 73 Leadenhall Market, London EC3V 1LT – Tel: 020 7621 1056 – E-mail: info@csfi.org – Web: www.csfi.orgCSFI
Fortunately, there is such a set, made up of unitary • Variations within percentiles are also wide. For
authorities, metropolitan boroughs, London boroughs example, there is a 19.9-year gap between life and
and counties.9 In total, our list comprises 150 districts health spans in the lowest 5% compared with a
covering the whole of England. Extending this to the rest 13-year gap in the 95th percentile. This means that
of the UK would be an obvious next step in the research. only 74% of lifespan is spent in good health in the
While health data and labour market statistics are not former, compared with 85% in the latter.
always consistent between geographic areas, the data is
good enough to produce meaningful results. • More years are spent being economically inactive
in the bottom 5% than in the 95th percentile, even
Table 1 splits districts into five-percentile steps, from though life span is lower in the former. In the 5th
districts with the shortest life span to those with the percentile, 96% of a much lower health span is spent
longest. For illustrative purposes, the analysis is based on in work compared with 88% in the 95th percentile,
males, but it would be straightforward to include females indicating a longer period of healthy retirement for
in further work. It shows: the latter.
• A widening gap in life, health and work spans
between the lowest 5% of districts and the 95th
percentile. The differences are indicative of shorter
working lives and higher health costs over the life
course in the lowest percentiles.
9 ONS gives a 9 character code to each every administrative area. In our
Table
cases 1:
theyLE, HLE and
are pre-fixed E06, WLE byandpercentile
E08, E09 E10 using the of districts
national GSS ranging from the 5th percentile (lowest) to the 95th
system. For example, Portsmouth is E06000044, Liverpool E08000012,
percentile (highest) (Note: bold figures are the median lower and upper quartile values)
Islington E09000019 and E10000019 Lincolnshire
Percentile
Indicator 0.05 0.1 0.25 0.5 0.75 0.9 0.95
A Life span (yrs) 76.7 77.2 78.0 79.2 80.3 81.2 81.6
B Health span (yrs) 56.9 58.0 59.8 62.9 65.4 67.9 68.6
C Work span (yrs) 54.5 55.1 56.3 57.6 58.7 59.7 60.1
A-B Life-health (yrs) 19.9 19.1 18.2 16.3 15.0 13.3 13.0
A-C Life-work (yrs) 22.3 22.1 21.7 21.5 21.6 21.5 21.5
B-C Health-work (yrs) 2.4 3.0 3.5 5.3 6.7 8.2 8.5
B/A Health/Life % 74 75 77 79 81 84 84
C/A Work/Life % 71 71 72 73 73 73 74
C/B Work/Health % 96 95 94 92 90 88 88
9 ONS gives a nine character code to each every administrative area. In our cases they are pre-fixed E06, E08, E09 and E10 using the national GSS system. For
example, Portsmouth is E06000044, Liverpool E08000012, Islington E09000019 and E10000019 Lincolnshire
CSFI – 73 Leadenhall Market, London EC3V 1LT – Tel: 020 7621 1056 – E-mail: info@csfi.org – Web: www.csfi.org 7CSFI
There are other important implications that can be • Increasing the number of years spent in good health
drawn from this table. For example, it is reasonable to following exit from the labour market is good for the
conclude the following: economy because healthy people consume more and
are available for other activities, such as volunteering
• A widening gap between health and life expectancy and providing care within the family. They also
is bad for the economy because it implies that more consume less in benefits and NHS resources.
years of life are spent in ill health and economic
inactivity, with negative implications for health, These patterns are also borne out, virtually without
social care and welfare costs. exception, if we drill down to individual local authority
level.
• Work span is lowest in districts with the shortest
health spans, and is always less than healthy life
span. The gap tends towards zero in the lowest
percentiles, but in the highest percentile it is 8.5
years and trending higher. We may infer that
short healthy life spans are a key obstacle to longer
working lives.
8 CSFI – 73 Leadenhall Market, London EC3V 1LT – Tel: 020 7621 1056 – E-mail: info@csfi.org – Web: www.csfi.orgCSFI
Chapter 2:
Drilling down to district level
Which combinations of life, health and work span are tax solely on income, although this could be changed
most advantageous? If we knew this we should be able to include other taxable revenue streams in future
to devise policies that accentuate positive rather than applications. An obvious criticism of this approach is
negative outcomes. For example, policies that require that it does not take into account the value of other
people to spend their whole lives working would be outputs, such as profits and rents, and non-remunerated
hugely unpopular. Policies that prioritise life span over activities such as care and volunteering. However, our
health span would bankrupt the healthcare system aim is more limited in this early stage of the research – it
by subsidising poor health – a sensitive issue, but one is to understand a set of financial effects based on a few
that puts a clear value on the cost of poor health to important factors, so that we can isolate the economic
the economy. Similarly, policies that do not look after value of healthy ageing and working longer.
the welfare of workers would be disastrous for the
economy. If it were possible to show that the most Although we can treat each district separately, in this
successful districts are also the healthiest, methods could paper we have chosen to put each district into sub-
be developed to weight life, health and work spans to groups. This simplifies the presentation of the results
promote the most favourable outcomes for society. and enables us to observe patterns and trends. We assign
to each district a code according to whether life, healthy
One mechanism is needed to compare districts based life or working life expectancy is high (H), medium
on LE, HLE and WLE, and a second to put a value (M) or low (L) using quartile cut-off values (these are
on inequalities. Since there are 150 districts in our emboldened in Table 1). For example, a district with the
database, it makes sense to group like with like. How code ‘HML’ has a life span in the top quartile (>80.3
we do this is explained below. In the introduction, we years), health span between the 25th and 75th percentile
posed the hypothetical question of what tax rates would (between 59.8 and 65.4 years) and work expectancy in
be required if each district (or group of districts) were the bottom quartile (CSFI
and higher output. Higher output, in turn, increases the would, of course, have the reverse effect – fewer goods
tax base to pay for healthcare, welfare and pensions, and and services, and higher taxes.
so the tax rate would accordingly be lower. Lower output
Figure 2: The positive/negative relationship between activity rates, output and taxes
+ve
Positive -ve
Negative
Activity Output Tax
rate rate
The next step is to put values on each of the variables model uses the conventional age of 65). This seems
in the framework in order to estimate outcomes in tax reasonable since pension age is determined by a range
terms. A person could be in good health or bad, pre- or of factors averaged out over the population, the costs of
post-SPA, in work or not. It is known that health costs which vary by health and disability as well as by age.
rise significantly in old age, so we approximate this by
assuming different rates of expenditure depending on We then split remaining life into the following quantities
whether someone is aged above or below the SPA (the expressed in this identity:
Expected remaining life
=
Expected healthy working life + Expected unhealthy working life
+ Expected healthy retired life + Expected unhealthy retired life
The next step is to attach financial quantities to each minus health span) multiplied by the going rates for
element of the relationship. Lifetime income is defined each cost category. We can also calculate a representative
as being equal to working life expectancy times average local, hypothetical tax rate for an individual in any of
earnings. In the same way we can calculate lifetime adult our districts over his or her life (or remaining life span),
healthcare costs and the cost of disability benefits using as follows:
the expected number of years in ill health (i.e. life span
10 CSFI – 73 Leadenhall Market, London EC3V 1LT – Tel: 020 7621 1056 – E-mail: info@csfi.org – Web: www.csfi.orgCSFI
Tax rate = lifetime consumption of health, welfare and pensions ÷ lifetime earnings
Where
1. Lifetime earnings (output) = average earnings x work span
2. State pension received = (life span-SPA) x average value of state pension
3. In-work disability benefits received = (SPA-years spent in good health from age 20) x average
in-work disability benefit rate
4. Post-SPA disability benefits received = (life span-SPA-healthy years post SPA) x average
post-SPA disability benefit rate
5. Healthcare costs pre-SPA from age 20 = years spent in poor health x average health costs
per annum
6. Healthcare costs post SPA = years spent in poor health to the end of life
For long periods, the representative tax rate is likely to Table 2: Values of each variable used in the
be fairly stable. Assuming a broadly constant number of illustrative case
births and deaths, the tax rate for the population will be
the same as for the representative individual at any point Variable Value
in time. We exploit this result later when we link output SPA (state pension age) 65 years
to GDP and productivity. Adult working life (start age) 20 years
Most of these definitions are easy to comprehend. State Variable Value £ per annum
pension age was set at 65 in the base case, its value pre- (‘000)
December 2018, but it is a parameter that can be varied Earnings 25.0
to show the effects not only of changes in health and life State pension 8.0
span but also taxes.
Working age disability benefits 10.0
Disability benefits post-SPA 5.0
The final step is to insert values for each parameter
such as average earnings. These values are summarised Health care costs pre-SPA 1.0
in Table 3 below. They are assumed for the purposes Health care costs post- SPA 2.5
of illustration but are consistent with actual UK
averages. Note that in further research these would be
disaggregated by district – a step that is feasible but
involves a large amount of prior work to assemble the
data.
CSFI – 73 Leadenhall Market, London EC3V 1LT – Tel: 020 7621 1056 – E-mail: info@csfi.org – Web: www.csfi.org 11CSFI Chapter 3: Results The results are set out in Table 3. This table allocates ‘H’ such as rows 9, 21 and 25 and so on. These cases each district to one of the 27 district types using the H, signify, for example, the incompatibility of having long M and L convention. Each row includes the number life expectancy coupled with poor health and shorter of districts allocated to each category and the imputed work spans. In other words, a person with low health tax rate, based on the methodology set out above. A expectancy will tend to have a low or medium life span final column provides examples of districts allocated and vice versa. If we test the hypothesis that work and to particular categories. The most common categories health spans are correlated, we find this to be highly are HHH, MMM and LLL, accounting for 42% of the statistically significant (p
CSFI
Table 3: Districts ranked on life, health and work span
No. Category a Number of Implied Examples
districts income tax
in each rate % b
category
1 HHH 14 23.0 Wokingham, Bromley, Oxfordshire, Windsor and Maidenhead
2 HMH 6 25.9 Wiltshire, Ealing, Sutton, Hertfordshire
3 HLH 0 n.a. Null category
4 HHM 8 24.2 Surrey, Richmond upon Thames, Solihull, North Yorkshire, Poole
5 HMM 6 26.7 Suffolk, Leicestershire, Redbridge
6 HLM 0 n.a. Null category
7 HHL 1 29.7 Kensington and Chelsea
8 HML 3 30.4 Solihull, Camden, Westminster
9 HLL 0 n.a. Null category
10 MHH 7 22.5 Northamptonshire, Essex, Warrington
11 MMH 8 24.7 Swindon, Slough , Shropshire, Trafford
12 MLH 2 30.2 Tower Hamlets, Lambeth
13 MHM 8 23.4 York, Reading, Cheshire East
14 MMM 31 25.8 Leeds, Medway, Calderdale, Greenwich, Cornwall
15 MLM 6 29.2 Telford, Bristol, Plymouth, Sheffield
16 MHL 0 n.a. Null category
17 MML 9 28 Bournemouth, Brighton, Isle of Wight, Sefton, Coventry
18 MLL 3 32 Durham, Redcar and Cleveland, Hackney
19 LHH 0 n.a. Null category
20 LMH 1 25.6 Derby
21 LLH 0 n.a. Null category
22 LHM 0 n.a. Null category
23 LMM 6 25.8 Darlington Bury, Bradford
24 LLM 9 29.0 Salford, Newcastle, Doncaster, Barnsley, Barking and Dagenham
25 LHL 0 n.a. Null category
26 LML 4 26.7 Stoke, Portsmouth, Wirral
27 LLL 18 30.0 Hartlepool, Manchester, Liverpool, Birmingham, Nottingham
Total 150 26
Note a: Letter order is life, and then health followed by work expectancy; note b, see also next section
Turning to the imputed tax rates in the next column, cities such as Hartlepool, Birmingham and Manchester
we see that these range from 22.5% to 30.4% with an in the LLL category have tax rates at the high end of the
all-district average of 26%10. Areas taxed at higher rates range while those at the head of the table in the HHH
are effectively paying the price for poor health and work category have the lowest tax rates. Reported tax rates
spans relative to other areas. For example, towns and are based on the average of rates for individual districts
10 At the individual district level the rates range from 20.7% in West
Berkshire to 33.2% in Tower Hamlets
10 At the individual district level the rates range from 21.3% in Warrington (MHH) to 33.7% in Tower Hamlets (LLL)
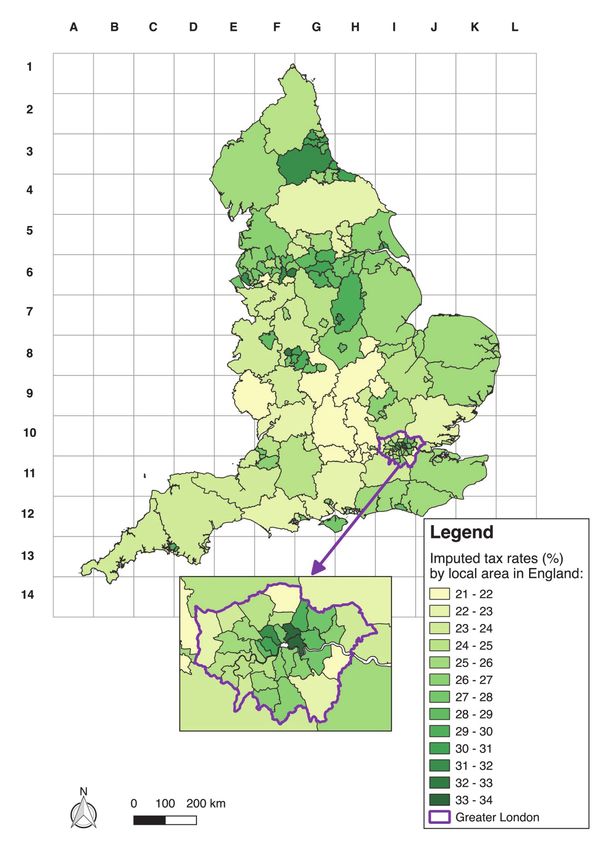
CSFI – 73 Leadenhall Market, London EC3V 1LT – Tel: 020 7621 1056 – E-mail: info@csfi.org – Web: www.csfi.org 13CSFI in each sub-group and so may not follow in exact rank category. Derby, for example, with a tax rate of 25.6% is order. This is usually due to that fact that there may the only representative in the LMH category. be only a small number of districts in any particular Figure 3: Map of England showing imputed tax rates by district The map in figure 3 shows the tax rates by individual West Midlands (F8 to G8), Hull (I5), Isle of Wight (G12 district: the darker the colour, the higher the to H12) and parts of central and east London (see map hypothetical tax rate applying. The values range from inset). There are also sporadic clusters elsewhere such as 21-22% (cream) to 33-34% (dark green). Prominent Plymouth (C13), Telford (F8) and Stoke-on-Trent (F7). clusters of imputed high tax rates are the north-east For the most part, these tend to be in or near urban (cells F3 to H3), north-west (E5 to F6), West and South areas, though sometimes they are on the coast. If it were Yorkshire (G6 to H6), Nottinghamshire (H6 to H7), available, more granular data would be able to pinpoint 14 CSFI – 73 Leadenhall Market, London EC3V 1LT – Tel: 020 7621 1056 – E-mail: info@csfi.org – Web: www.csfi.org
CSFI

sub-districts better. But, in general, the map gives a good                  65.) The chart shows, for example, in which districts
picture of deprivation.                                                      inhabitants are more likely to reach pension age in
                                                                             good health (Windsor and Maidenhead and Richmond
Figure 4 shows six individual districts from four                            upon Thames), and in which they are not (i.e. the
categories – three in the LLL group, and one each from                       rest). In all cases, the average age at which economic
MMM, HHM and HHH. It shows average periods                                   activity ceases is lower than the SPA – and, in the case
spent by inhabitants in each state – working lives,                          of Hartlepool, there is hardly any difference between
inactive healthy years and unhealthy years. (A hatched                       health and work span.
line from left to right shows the base pension age of

Figure 4: Examples comparing individual districts based on work, health and life-span. The
hatched horizontal line shows state pension age.

To summarise, characterising districts on this basis is                      greater inequality and low value the opposite. In our
a powerful way of representing inequalities. This is                         illustration, the mean is 26% and the standard deviation
important for applications in which it would be handy                        is +/- 3%. If tax rates are distributed normally – which
to have such a measure to compare with a dashboard of                        approximately they are – it means that 68% of all values
other outcomes. One common measure for capturing                             fall within one standard deviation of the mean – in
inequality is the standard deviation, which is a measure                     this case 26% +/- 3% i.e. between 23% and 29%. This
of dispersion relative to the mean: high value signifies                     method is used in a later illustration.

CSFI – 73 Leadenhall Market, London EC3V 1LT – Tel: 020 7621 1056 – E-mail: info@csfi.org – Web: www.csfi.org                       15
CSFI
Chapter 4:
Effects of changes in LE, HLE and
WLE on public expenditure and GDP
There are several ways to use this analytical framework. tell from the data.) Clearly, the policy goal of improving
Broadly, these entail investigating changes in LE, HLE HLE by five years speaks directly to the issues addressed
and WLE and their impact on the imputed tax rate, in this paper, but current policy does not appear to
productivity and the cost of providing pensions and build from an empirical base. New policies are needed
welfare. How will tax rates alter if any or all of these that explicitly draw the link between health, work and
variables change? The framework makes this easy to economic growth.
calculate. Take the impact of a future rise in longevity
on tax rates. In this case (and with no other changes), we As long as rises in life expectancy are accompanied by an
would expect taxes to increase to pay for pensions and increase in HLE, prospects are much better – especially if
higher spending on health and disability benefits. This they create headroom for longer working lives. Empirical
is because the years spent in ill health would increase, evidence suggests that a one-year increase in HLE would
causing higher health and welfare payments, unless there translate, on average, into an approximate 4.5 month
was a compensating improvement in health span. increase in LE. A one-year rise in HLE would, in turn,
generate an increase in WLE of roughly 3.4 months. To
Mitigating steps from the Exchequer to avoid tax achieve the government’s five-year aim would be a bigger
increases could include a reduction in the value stretch; it would translate into an approximate 23-month
of pensions or benefits, or an increase in the SPA. increase in life expectancy and an approximate 17-month
Regression analysis based on the 150 English districts increase in WLE, based on current labour market and
shows that the impact of a two-year increase in life economic activity data.
expectancy with no other changes would increase the
average tax rate from 26% to 29%. It would be possible Table 4 shows the estimated effect on life and work span,
to lower that by increasing the SPA by a whopping seven taxes and inequality, contingent on changes to health
years, or by reducing the average state pension from expectancy. The scenarios show the effect of a change in
around £8,000 to £6,000 a year, or by some combination HLE ranging from -2 to +5 years, with no other changes
of the two. This example shows that policies aimed only to framework parameters (such as pension age, health
at extending life without extending health are likely to be costs or welfare payments). Given an HLE baseline of
expensive and counterproductive – as well as unpopular. 62.7 years, the results show that life span increases as
expected, but by less than the rise in HLE. WLE also
It is true that increases in life expectancy have faltered increases, but by less than LE. The net effect is for tax
in recent years, and that immediate prospects for rates to fall, but only slightly. Inequalities are reduced less
further increases have been negatively affected by the than taxes, suggesting that improving general levels of
Covid pandemic. However, a two-year increase in life health may require more targeted measures in individual
expectancy over the next 15 years is a reasonable working districts.
assumption based on past performance. (It is possible
that the death toll from Covid 19 may have altered the The impact on taxes would be considerably greater
relationship between LE and HLE, but it is too early to if there were accompanying changes in the SPA. For
16 CSFI – 73 Leadenhall Market, London EC3V 1LT – Tel: 020 7621 1056 – E-mail: info@csfi.org – Web: www.csfi.orgCSFI
example, assume that the improvements in HLE in costs are shunted forward and re-deployed as end-of-life
Table 3 were matched by increases in the SPA. A one- care. That said, the full benefits of increases in HLE are
year improvement in HLE, along with a one-year not all measurable in fiscal terms – healthy, economically
increase in the SPA, would reduce the tax rate to 25.3%, inactive older people are more likely to engage in
a three-year improvement to 23.0% and a five-year voluntary work and social activities as well as spend more
improvement to 20.8%. Healthcare costs are predicted on consumption. That needs to be borne in mind.
to fall pre-SPA, but increase post-SPA as more health
Table 4: Illustrative examples of changes in life and work span, tax rates and inequalities from general
increases in HLE based on figures from birth
Change in Average age at end of: Change in Change in Tax% Inequality
HLE at age LE from WLE from (standard
20 (years) baseline baseline deviation
LE HLE WLE +/- %
-2 78.4 60.7 57.1 -0.8 -0.4 27.67 3.04
-1 78.8 61.7 57.3 -0.4 -0.2 27.03 2.98
Baseline 79.2 62.7 57.5 0.0 0.0 26.42 2.90
1 79.6 63.7 57.7 0.4 0.2 25.86 2.80
2 79.9 64.7 57.9 0.8 0.4 25.35 2.69
3 80.3 65.7 58.0 1.1 0.6 24.88 2.59
4 80.7 66.7 58.2 1.5 0.7 24.44 2.49
5 81.1 67.7 58.4 1.9 0.9 24.04 2.40
5.1 Economic activity, be viewed as a kind of enabler to capture the higher
productivity potential of experienced older people who
productivity and GDP would like to work for longer.
We have seen that a rise in HLE tends, on its own, The same sort of analysis can be applied to GDP –
to have only a modest effect on work span and, defined as the final value of the goods and services
therefore, on tax rates, without accompanying fiscal produced during a specified period of time, normally
measures (such as increasing the SPA), which would a year.
reduce pension costs and taxes by greater amounts.
For increases in HLE to have a more substantial effect, The GDP growth rate is an important summary measure
especially on output, there would need to be incentives of how well an economy is performing. It can be split
to convert more of the extra healthy years into work. into two components – one generated by earnings and
Sluggish productivity growth and early retirement have the other representing income generated by profits,
long been seen as the Achilles’s heel of the UK economy dividends and rents. Assuming GDP is represented only
and are a priority for review. An increase in HLE can by wages and salaries, we have the further identity:
GDP= Proportion of adults in work x average earnings x adult population
CSFI – 73 Leadenhall Market, London EC3V 1LT – Tel: 020 7621 1056 – E-mail: info@csfi.org – Web: www.csfi.org 17CSFI
The first term on the right is another way of expressing GDP per capita is a measure of economic well-being and
work span and equates to levels of economic activity; is found by dividing both sides of the equation by the
the second term is a measure of productivity; and the adult population. It implies that the population becomes
third term is related to life expectancy in a steady state better off the higher the proportion of adults that are in
population. For GDP to increase, one or more terms work and the higher productivity is. This is a gross figure
to the right must also increase – for example, a 10% before taxes are levied, and the imputed tax rates rise
increase in productivity without any other changes with the cost of welfare, healthcare and pensions. The
would raise GDP by 10%. The same applies to increases tax rate is determined as follows:
in the proportion of the population in work and in the
size of the adult population.
Tax rate = Total cost of health, welfare and pensions ÷ total value of output
The relationship is, therefore, one in which output per of GDP, based on profits, dividends and rents, has
capita depends on work span and productivity, but in remained relatively steady since 2000 at around 50%,
which net earnings depend on the cost of healthcare, which implies a total GDP of £2 trillion, close to the
welfare and pensions – all of which are met through 2020 value of £2.1 trillion according to the ONS. This
taxes as set out above. correspondence means that our demographic accounting
framework can be considered reasonably realistic. The
Putting the above into context, assume that two thirds key point is that by making each local area accountable
of adult life is spent in work and that annual earnings for its own taxes, we are now able to shine a spotlight on
are £25,000, plus 20% employer’s social contributions. the cost of inequality.
With an adult population of 50m people this produces
a reasonably accurate value of the share of labour in UK
GDP of around £1 trillion. The second component
18 CSFI – 73 Leadenhall Market, London EC3V 1LT – Tel: 020 7621 1056 – E-mail: info@csfi.org – Web: www.csfi.orgCSFI
Conclusions
There is intense interest in tackling the scourge of health than areas with higher LE. Areas with the lowest
inequality in society and closing the gap between richest WLE also have the lowest HLE, meaning that poor
and poorest areas in terms of income, health, housing, health is likely to be the biggest obstacle to working
education and job prospects. It is increasingly accepted longer. Such areas enjoy far less time spent in healthy
that narrowing the current discrepancy in healthy life retirement than healthier districts, and they face more
expectancy is a necessary step forward. This is a tough health challenges and income deprivation in later years.
challenge and, if anything, the gaps are growing wider. Healthier areas gain from more social capital – for
At the moment, all these considerations – work, health, instance for the purposes of volunteering or caring for
pensions and welfare – subsist in different policy silos. relatives – as well as offering inhabitants the flexibility to
Thus, it is hard to calculate the effect of one on another. work up to and beyond the SPA.11 Areas with fewer years
For example, what would be the economic value of spent in good health show more people needing social
a one-year increase in HLE on GDP versus a one- care as well as healthcare and financial support. This
year increase in LE? Would this increase or decrease exacerbates labour shortages in the care sector.
inequalities?
Overall, the analysis suggests that good health is a
The aim of this research has been to put a price on necessary (although not sufficient) condition for
inequality and an economic value on good health. This reducing inequality. We show that improvements in
has two implications – the first is that good health is HLE translate into longer working lives and also longer
a precondition for a longer working life and healthy life expectancy. A one-year increase in HLE would lead
retirement, and the second is that good health reduces to an approximate 3.4-month increase in WLE and a
the cost of services such as health and social care. If each 4.5-month increase in LE. The increase in HLE should
district is treated as autonomous and responsible for result in more retirement years spent in good health, a
funding its own health, welfare and pension provision, smaller gap between HLE and LE and hence reduced
we can quantify these effects explicitly. Those districts demand for health and social care.
with the fewest working years would pay most taxes
and those with the best health and longest working lives However, the impact on inequality does not change pro
the least. Based on simple assumptions we estimated rata. Therefore, more targeted methods are needed to
the national average hypothetical tax rate to be 26% address the most left behind areas. Still, there would be
of earnings, but this varied by 10 percentage points more healthy retirees than previously, which would be
between the richest and poorest areas, demonstrating better for the economy and contribute to other beneficial
the way in which some districts subsidise others through activities such as volunteering and caring.
fiscal transfers.
To address the potentially negative link between an
The results show consistently that people in areas with ageing population and economic sustainability three
the lowest LE spend more years, on average, in poor actions are needed:
11 Mayhew, L. D. 2020.On the Postponement of Increases in State Pension
Age through Health Improvement and Active Ageing. Appl. Spatial
Analysis. https://doi.org/10.1007/s12061-020-09359-y
11 Mayhew, L. D. 2020.On the Postponement of Increases in State Pension Age through Health Improvement and Active Ageing. Appl. Spatial Analysis.
https://doi.org/10.1007/s12061-020-09359-y
CSFI – 73 Leadenhall Market, London EC3V 1LT – Tel: 020 7621 1056 – E-mail: info@csfi.org – Web: www.csfi.org 19You can also read