THE DIAGRAMS OF AI (IMAGE) - Jussi Parikka - Tidsskrift.dk
←
→
Page content transcription
If your browser does not render page correctly, please read the page content below
THE DIAGRAMS OF AI (IMAGE)

Jussi Parikka

A history of images about images is as mesmerising in its own
right as images themselves are. This is not merely a history of
the copy— the attempt to reproduce an image through an image —
but also of the various guides and diagrams that tell a story of
production of images. This is also the entry point for my argument
about the changing ontology of the image.
   This argument about ontology concerns then not merely what
an image is in its essence, but how images function as as operative
ontologies1: described, drawn, pictured, instructed, guided, and
diagrammed into existence. Such diagrams are an educational
arm of knowledge about images, but obviously they are also
images already in themselves.
   Diagrams occupy a central role as a modern form of
knowledge about images. Diagrams that describe the operations
and insights of image geometry are a special case in point,
where the linear perspective in (and since) the Renaissance
period has given rise to a long line of commentary, in the art-
historical way of tracking the changing ontologies of the image.
How to calculate image surfaces, lines, and ratios becomes
instrumentalised into a productive machinery and subsequently
into an analytical machinery, as is the case in the various
techniques of reading the geometric data packed into an image.
From Johan Heinrich Lambert’s Die freye Perspective, oder
Anweisung Jeden Perspektivischen Aufriß Von Freyen Stücken Und
Ohne Grundriß Zu Verfertigen (1759) to Colonel Aimé Laussedat’s
works on photogrammetry (or “metrophotography”) toward the
latter part of the 19th century, the work of descriptive geometry
becomes crucial to the diagram of the technical image and image
as data.2 They are manuals of “this is how that operates” and take
on a second order quality themselves: a cultural technique that
recursively images an image. One can also observe a similarity
with the function of the metapicture, as per WJT Mitchell’s term
that refers to such images that “might be capable of reflection on
themselves, capable of providing a second-order discourse that
tells us — or at least shows us — something about pictures.”3
   In terms of the contemporary image, the shift from questions
on the ontology of digital images (do they capture reality? Do

The Nordic Journal of Aesthetics, No. 61–62 (2021), pp. 148–153       148
they fabricate reality? Do they simulate it?) to the centrality of
image as data, as well as the image classification and preparation
pipeline, is significant and exhibits analogous relation to the
diagram. While AI and machine vision are often described in
terms of “invisibility” (as Trevor Paglen or Hito Steyerl in their
different ways have proposed) or “invisuality,”4 the images about
AI imaging are inscribed as diagrams. Or, even more precisely:
the diagrams describe how the invisible image is made visible.
According to John Bender and Michael Marrinan’s history of the
diagram (that for them starts with the 18th-century Encyclopedia
by Diderot and D’Alembert): “A diagram is a proliferation of
manifestly selective packets of dissimilar data correlated in an
explicitly process-oriented array that has some of the attributes
of a representation but is situated in the world like an object.”5
Diagrams are process-oriented and relational, and particularly
well suited to the task of describing material ontologies of
engineering and technical construction (including that of images).
The diagrams that populate various contemporary papers and
publications about machine learning and image processing (and
datasets) are found images. These images form the backbone of
a different set of “experimental images” than the found images
of 20th century avant-garde. They emerge in the technical grey
literature (even an informational genre perhaps) that populates
ML as its theoretical-administrative backbone, while articulating
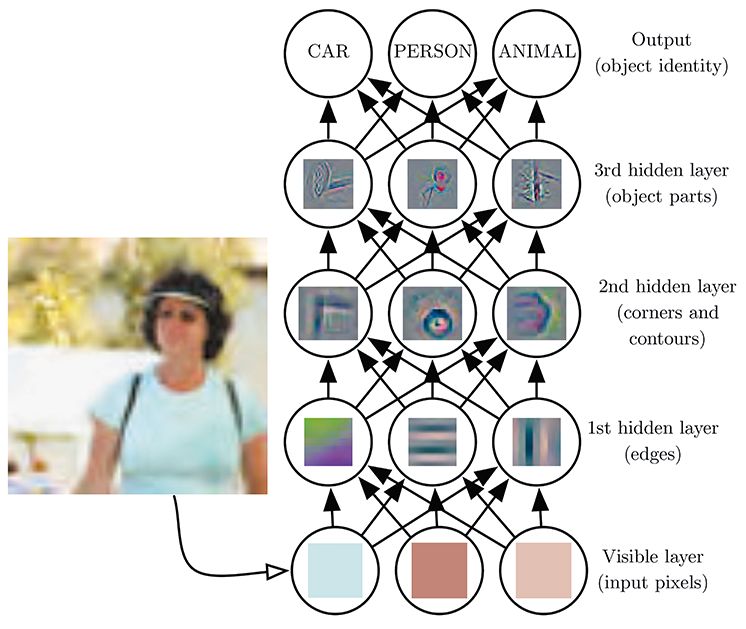
what images are and how they operate. (Fig. 1)
These are the diagrams that describe what has happened to
images (and image collections in their millions) as they are pushed
through the pipeline of dataset production, ML algorithms, and
creation of models from training data. Diagrams show what
happens to images in different machine learning techniques —
how convolutional networks or deep image reconstruction works.
The diagrams do not mimic but demonstrate an operation of
an image.6 Quoting Rosemary Lee, we can argue that this is a
“form of visual literacy in which assessments of images exceeds
their visible attributes and entails the consideration of how a
knowledge of the technical processes behind images adds to the
way they are understood.”7
To double up the take on diagrams and the AI image, the former
also feature as critical visual techniques through which the
distributed infrastructure and labour of the AI image becomes
visible. For example, Vladan Joler’s visual design on the Anatomy
of an AI System in collaboration with Kate Crawford (anatomyof.ai)
149 The Diagrams of AI (Image)Fig. 1
An image of a deep learning model as diagrammed in Goodfellow,
Bengio and Courville’s Deep Learning.8
as well as similar collaboration on the Nooscope with Matteo
Pasquinelli (nooscope.ai) stand out as exemplary. Also, David
Benqué’s creative work on speculative diagramming (Institute of
Diagram Studies) addresses contemporary algorithmic culture.9
Thus, to reinstate the point: considering the massive scale
of the contemporary image as it features in AI techniques and
planetary infrastructures, the diagrammatic visualisation
presents both the transformation (of ontology) of technical
images and is itself an image in that very same mix. Diagrams
recursively help to understand the operations of images, while
simultaneously featuring as prominent epistemic images across
different institutional uses.
The research for this text has been supported by the Operational
Images and Visual Culture project (2019-2023), funded by the Czech
Science Foundation, 19-26865X.
Jussi Parikka 150JUSSI PARIKKA is Professor of Technological Culture and Aesthetics at University of Southampton and Visiting Professor at the Academy of Performing Arts, Prague where he leads the project Operational Images and Visual Culture. His most recent books include the co-edited Photography Off the Scale (2021, with Tomas Dvorak) and co-authored The Lab Book (2021, with Darren Wershler and Lori Emerson). In January 2022 he will join Aarhus University as Professor in Digital Aesthetics and Culture. 151 The Diagrams of AI (Image)
NOTES

1   Sybille Krämer, “Die Rettung des Ontologischen                6   See also Rebecca Uliasz, “Seeing like an algorithm:
    durch das Ontische? Ein Kommentar zu ‘operativen                  operative images and emergent subjects” in AI & Society,
    Ontologien,” Zeitschrift für Medien – und                         2020, https://doi.org/10.1007/s00146-020-01067-y.
    Kulturforschung 8 no. 2 (2017): 125-141.                      7   Rosemary Lee, Machine Learning and Notions of
2   Cf. Friedrich Kittler, Optical Media: Berlin Lectures 1999,       the Image, PhD Thesis, Center for Computer Games
    trans. Anthony Enns. (Cambridge: Polity 2010), 94.                Research Department of Digital Design IT – University of
3   WJT Mitchell, Picture Theory: Essays on Verbal and                Copenhagen 2020, 138.
    Visual Representation (Chicago: University of Chicago         8   Ian Goodfellow, Yoshua Bengio, and Aaron Courville,
    Press 1994), 38.                                                  Deep Learning. (Cambridge, MA: The MIT Press 2016), 6.
4   Adrian Mackenzie and Anna Munster, “Platform Seeing:          9   See davidbenque.com.
    Image Ensembles and Their Invisualities” in Theory,
    Culture & Society, 36 no. 5 (2019): 3-22.
5   John Bender and Michael Marrinan, The Culture of
    the Diagram. (Stanford, CA: Stanford University Press
    2010), 7.

Jussi Parikka                                                                                                           152
You can also read