THE ECONOMY A ND THE PANDEMIC - 27 JULY - 9 AUGUST 2020
←
→
Page content transcription
If your browser does not render page correctly, please read the page content below
THE ECONOMY A ND THE PANDEMIC
                         27 JULY – 9 AUGUST 2020
                                         KEY FINDINGS
On the pandemic
•   South Africa appears to have succeeded in cutting the transmission of COVID-19 sharply over
    the past month, although reported new cases per 100 000 are still far higher than in early June.
    Known active cases declined 45% from their peak in mid-July through 9 August.
•   The reasons for the decline are not obvious. The critical factor has likely been the willingness
    of millions to wear masks and socially distance as far as possible, reinforced by government
    action to discourage high-risk activities in mid-July.
•   Despite the improvement, six out of nine provinces still reported more than 10 new cases per
    100 000 residents as of 8 August. According to recommendations by the Harvard Global Health
    Institute and the Safra Centre for Ethics, that means they should maintain strict limits on social
    and recreational gatherings. An OECD study found that if South Africa permits another peak in
    infections this year, it will shave 2% off the GDP forecast for 2020 and 2021.
On the economy
•   The available data suggest that economic growth is still recovering slowly.
•   The pandemic has had a particularly harsh impact on women in South Africa, as internationally.
    They are more likely to work in jobs that directly serve the public, where the risks of both
    infection and job losses are highest. They are also less likely to have paid work at all, and so
    benefit less from relief efforts tied to employment and income. And they face increased
    domestic violence during the lockdown. The increase in social grants goes only a small way to
    offsetting these disadvantages.
•   The social and political stresses resulting from the long-running pandemic have begun to
    emerge in rising protests as well as the corrosive discourse on corruption in procurement.
    Nonetheless, proposals for recovery from economists and business organisations continue to
    focus on long-run demands rather than ways to cushion the immediate economic impacts of
    the pandemic. Opportunities include setting up systems to limit workplace outbreaks;
    developing a just transition for industries that cannot open safely in the short run (notably
    entertainment venues, tourism and liquor stores) while identifying new opportunities;
    expanding public employment and other programmes to relieve the devastation wrought on
    poor communities; and finding more progressive ways to fund state programmes.

                    THE TIPS TRACKER: THE ECONOMY AND THE PANDEMIC
                               IS PUBLISHED EVERY TWO WEEKS
TRENDS IN THE PANDEMIC
Reported new cases continued their downward trend in the past two weeks. As of 9 August,
they were over 40% lower than at their peak in mid-July. The national figures obscure
substantial differences in regional trends. Still, every province has seen some decline in
diagnoses in the past week. The numbers are dominated by Gauteng, as reflected in Graph 1.
Using seven-day rolling averages, new cases there climbed slowly to around 50 a day in mid-
May; escalated to over 5 000 daily in mid-July, starting a few weeks after the move to Level
4; but then fell to under 2 000 on 9 August.
Graph 1. Reported new cases by province, 3 April to 9 August
6 000
5 000
4 000
WC
GT
3 000
KZN
EC
2 000 NW
Other provinces
1 000
-
03-Apr
10-Apr
17-Apr
24-Apr
01-May
08-May
15-May
22-May
29-May
05-Jun
12-Jun
19-Jun
26-Jun
03-Jul
10-Jul
17-Jul
24-Jul
31-Jul
07-Aug
Source: Calculated from data accessed at www.sacoronavirus.co.za on relevant dates.
The sharp fall in cases meant that the incidence per person of new cases fell fairly sharply,
although it remained far higher than during the Level 5 lockdown.
As Graph 2 shows, South Africa saw a sharper rise than most other countries for much of July,
but then a faster fall. Three weeks ago, it ranked fifth in the world in new cases per 100 000
people.
In the week to 8 August, in contrast, it ranked 16th. Moreover, of the nine countries with the
highest levels of transmission (excluding those with under five million population), South
Africa saw the steepest decline in new diagnoses per 100 000 people over the past four
weeks.
TIPS Tracker: The economy and the pandemic compiled by Neva Makgetla
2Graph 2. Reported new cases per 100 000 people for countries with highest contagion levels
(excluding countries with under five million inhabitants), seven-day rolling averages
13 June 2020 20 June 2020 27 June 2020
04 July 2020 11 July 2020 18 July 2020
25 July 2020 01 August 2020 08 August 2020
2.5
2.0
1.5
1.0
0.5
-
Peru Brazil Colombia United Israel Argentina Costa Rica Bolivia South
States Africa
Source: Calculated from COVID-19 Data Repository by the Center for Systems Science and Engineering at Johns
Hopkins University, accessed at https://github.com/CSSEGISandData/COVID-19 in August 2020.
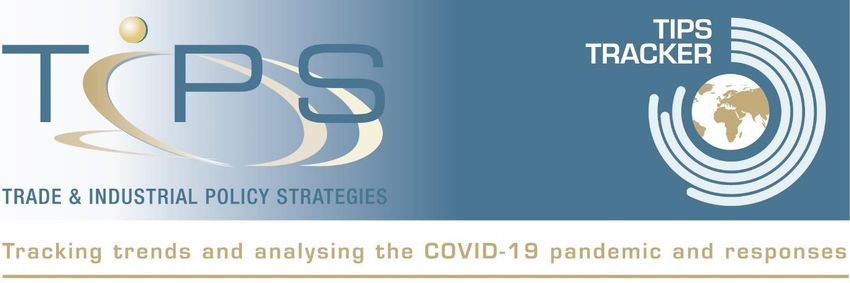
Although the number of new diagnoses dropped, the incidence remained high overall. That
raised the risk that the contagion could again surge out of control.
As Graph 3 shows, on August 8 the incidence of new cases per 100 000 exceeded 10 in five
provinces that hold three fifths of the population. According to a dashboard developed by the
Harvard Global Health Institute and the Safra Centre for Ethics,1 this level of new infections
indicates that community spread is at “dangerous levels.” They advise that regions with 10 to
25 new cases per 100 000 residents consider “stay-at-home orders” unless they have strong
testing and tracing capacity. They do not, however, define stay-at-home orders, which
internationally vary from a full lockdown to permitting economic activity while requiring
people to avoid gatherings for social or entertainment purposes.
The Harvard dashboard suggests that areas like the Free State, with over 25 new cases per
100 000 residents, have no alternative to stay-at-home orders because they have such a high
level of community spread. It argues that areas with under 10 new cases per 100 000 should
focus on behavioural changes but do not need stay-at-home requirements.
1
Harvard Global Health Institute and Edmond J. Safra Centre for Ethics. “Key Metrics for COVID Suppression: A
Framework for policy makers and the public.” July 1, 2020. Downloaded from https://globalepidemics.org/wp-
content/uploads/2020/06/key_metrics_and_indicators_v4.pdf in August 2020.
3Graph 3. Number of new cases per 100 000 residents by province, seven-day rolling
averages
07-Jun 14-Jun 21-Jun 28-Jun 05-Jul 12-Jul 19-Jul 26-Jul 02-Aug 09-Aug
35.0
30.0
26.1
25.0
20.0
20.0
16.9
15.0 12.8
11.5
10.0
6.4 6.5 6.7
5.0 3.6
-
LP EC WC NW GT MP NC KZN FS
Source: Calculated from data accessed at www.sacoronavirus.co.za on relevant dates.
Because deaths lag new cases by around three weeks, they continued to climb rapidly.
Nationally, deaths increased by over 50% in the past two weeks, reaching 10 408, and they
more than doubled in KwaZulu-Natal. Still, according to the Minister of Health, a new study
has found that the introduction of dexamethasone as a treatment on 16 June (following
successful randomised tests in the UK) led to a 25% decline in mortality in intensive care units.
Graph 4. Deaths in the two weeks to 9 August, by province
3 500
524
3 000
2 875
2 500 1 015
2 000 752
Two weeks to 24 July
1 500 1 564
1 457 795
Cumulative as of 26 July
1 000
500 614 553
259
-
WC GT EC KZN Other
provinces
Source: Calculated from data accessed at www.sacoronavirus.co.za on relevant dates.
The South African Medical Research Council (SAMRC) report on excess deaths continues to
find that actual fatalities far outstrip both anticipated numbers and the reported deaths from
COVID-19. For the week to 28 July, the estimated excess death figure was twice the forecast
4norm (which is based on past years but reduced to account for lower flu deaths) and four
times the reported deaths from COVID-19. Not all countries have adequate death reporting
to provide estimates of excess deaths, and most of those are in the high-income group. Of
the countries that do estimate the figure, virtually all find that when transmission is high
excess deaths significantly exceed reported COVID-19 deaths. Still, in most cases excess
deaths are only twice as high as COVID-19 deaths at peak transmission. That said, most
countries that provide data are higher income, which means they have better access to
COVID-19 tests. The National Department of Health is trying to check the actual extent of
deaths by requiring tests for COVID-19 in sudden deaths and those that occur at home.
Graph 5. Reported COVID-19 deaths and SAMRC estimates of excess deaths as percentage
of historic norm, and reported COVID-19 deaths as percentage of SAMRC excess death
estimates, week to date, 9 June to 28 July
excess deaths as % of actual
reported COVID-19 as % of actual
ratio of estimated excess to reported COVID-19 deaths (right axis)
percentage of actual natural deaths
100% 8.0
ratio of eproted COVID-19 deaths to
90% 7.2 7.0 7.0
80% 87% 88%
6.0
estimated excess
70% 75%
5.3 5.0
60% 4.8
50% 4.0
3.5 3.6
40% 45% 3.0
30% 33%
1.9 2.0
20% 13%
10% 4% 5% 18% 4% 5% 7% 6% 7% 1.0
1% 9%
0% 0.2 -
09-Jun 16-Jun 23-Jun 30-Jun 07-Jul 14-Jul 21-Jul 28-Jul
Source: Calculated from SAMRC. Report on weekly deaths in South Africa. Accessed on 10 August 2020 at
https://www.samrc.ac.za/reports/report-weekly-deaths-south-africa.
According to news reports, funeral parlours (which are disproportionately located in cities,
many of which have unusually high contagion rates) have seen a significant increase in
demand. Avbob said funerals climbed by 60% in July. Funeral parlour owners in Soweto and
Pietermaritzburg told reporters they had seen numbers more than double in June and July.
The reason for the decline in new cases over the past month is not obvious. It does not appear
to be related to changes in the number of tests or how they were allocated. The number of
new tests plateaued at a daily average of just over 30 000 in the month to 9 August, while the
number of positive results fell. As a result, the share of tests coming back positive dropped
from an average of 29% in mid-July to 22% on 9 August. For comparison, the World Health
Organization considers the contagion is under control when this positivity rate is under 5%.
If the fall in new cases does not result from changes in testing, then it must follow from
behavioural changes. There is no consistent measure to track how behaviour is changing,
however, or why. That said, on 13 July the government introduced new restrictions on social
behaviour, and the incidence of new cases began to drop a week later.
5The effect of the new restrictions may be as much about signalling as about direct effects on
behaviour. The new regulations were fairly modest – a renewed ban on alcohol and a curfew
– but they communicated clearly that the government saw rising risks. Internationally, a
challenge in reopening the economy has been to avoid signalling, inadvertently and wrongly,
that the risk of contagion had become negligible. The renewed tightening of regulations may
have been sufficient to encourage stronger behavioural changes, especially around wearing
masks and avoiding unnecessary contact with people. It is noteworthy that similar moderate
restrictions by US states, mostly to close down bars and gyms, have also been followed by
falling transmission.
Despite the apparent coincidence with falling case numbers, the high-risk industries still
facing restrictions are lobbying fiercely for their removal, as discussed in more detail below.
If new measures lead to a reversion to risky behaviour and, by extension, faster spread of
COVID-19, however, the economic costs seem likely to far outweigh the benefits promised by
lobby groups. The Organisation for Economic Co-operation and Development (OECD)
estimates that a second wave of contagion will reduce economic growth by almost a full
percentage point. Under its forecasts, if the contagion continues to decline, the South African
economy will shrink by 7,5%. If there is a second spike, however, it will shrink by 8,2%. Even
more worryingly, the OECD projects that it would cut the growth rate for 2021 from 2,5% to
only 0,6%.
Over the past two weeks, the government has strengthened its emphasis on the need for
behavioural change. There has been a visible increase in the amount of information available
on how to prevent infections. A digital tracing system, COVIDConnect, has been activated,
and 16 400 participants in public employment schemes were deployed as part of the
Department of Health Promotion of Hygiene Strategy interventions.
TRENDS IN THE ECONOMY
The available indicators suggest that economic recovery remained slow over the past two
weeks, although they are affected by the regular uptick for the end of the month, when most
people are paid. By most measures, economic activity gained only a few percentage points
on last month. Internationally, most studies show that high transmission levels are associated
with slower growth. For the economy, the key questions now are whether transmission will
continue to decline, and if that in turn will bolster its recovery despite continued global
headwinds.
The Yoco small business turnover index suggest that economic activity barely improved over
the end of July. By this measure, economic activity remained more than 20% lower than
before the lockdown. The Western Cape remained the hardest hit, but saw greater
improvement than the rest of the country over the past month. The index also recovered
relatively strongly in KwaZulu-Natal.
6Graph 6. Small business turnover relative to the first two weeks of January, average for
week to Saturday through 8 August
EC WC KZN GT SA
100%
90%
80%
70%
60%
50%
40%
30%
20%
10%
25 April 23 - 29 30 May - 6 - 12 13 - 20 21 - 27 28 June - 5 - 11 12 - 18 19 - 25 26 July 2 - 8
- 1 May May 5 June June June June 4 July July July July to 1 August
August
Source: Calculated from Yoco Small Business Recovery Monitor. Downloaded at www.yoco.co.za on relevant
dates.
In late July, electricity use rose to just 2% below 2019 levels, pointing to a recovery especially
in the metals value chain.
Graph 7. Electricity sent out in GWh, weekly, 24 March to 3 August, and percentage
difference from the same week in 2019
GWh sent out change from previous year (right axis)
15.0%
4 000
Percentage change over previous year
4 238 4 162 4 203 4 093 4 230 4 240 4 187
3 000 9.5% 3 672 3 191 3 808 3 867 3 936 4 025 4 139 10.0%
3 072 3 120 3 276 3 382 3 660
2 000
5.0%
1 000
4 207
- 0.0%
-1 000 -4.4% -4.9% -3.8% -3.7% -2.7% -5.0%
GWh
-2 000 -6.4% -6.8% -7.2%
-3 000 -8.9% -10.0%
-12.0% -13.2%-12.0%-12.6%
-4 000 -14.6% -15.0%
-5 000
-6 000 -19.4% -20.0%
-21.3%
-7 000 -24.2%
-25.9% -25.0%
-8 000 -27.8%
-9 000 -30.0%
16-22 March
23-29 March
31 March-5 April
6-12 April
13-19 April
18-26 April
27 April-3 May
4-10 May
11 May-16 May
17 May-23 May
24 May-31 May
1 June-7 June
8 June - 15 June
15 June - 21 June
22 June - 28 June
28 June - 5 July
6 July - 12 July
13 July - 19 July
20 - 26 July
27 July - 3 August
Source: Calculated from Eskom System Adequacy Reports for relevant weeks. Accessed at
http://www.eskom.co.za/Whatweredoing/SupplyStatus/Pages/SupplyStatusT.aspx
Figures for travel by type of destination suggest that consumer demand was recovering more
rapidly than travel to work. Travel to workplaces has declined since mid-June, and in the last
week of July was 30% below pre-lockdown figures. Public transport also showed a relatively
slow recovery, with virtually no improvement over the past month. In contrast, both essential
and non-essential retail and recreation showed a modest recovery, with an uptick at the end
of each month as with the Yoco data.
7Graph 8. Percentage change in travel by type of destination, weekly average from 8 March
to 3 August, compared to January 2020
Workplace Grocery/chemists Transit hubs Other retail/recreation
10%
percentage decline relative to January
0%
-10%
-20%
-30%
-40%
-50%
-60%
-70%
-80%
-90%
March
March
March
29 March-
5-11 April
12-18 April
19-25 April
26 April-
3- 9 May
10-16 May
17-23 May
24-29 May
1-6 June
8-14 June
15-21 June
22-28 July
29 June-
6-12 July
13-19 July
20-26 July
2 August
15-21
22-28
28 July-
8-14
2 May
5 July
4 April
(a)
before Level 5 Level 4 Level 3
lockdown
Source: Calculated from Google COVID-19 Community Mobility Reports. Accessed on 25 June 2020 at
https://www.google.com/covid19/mobility/.
By province, the travel data also show the weakest recovery relative to pre-lockdown days in
the Western Cape, with Gauteng in second-worst place for travel to work. Still, the recovery
in retail and recreation in the past month was centred on the Western Cape.
Graph 9. Percentage change in travel by type of destination, by province, weekly average
from 26 April to 19 July, compared to January 2020
27 March - 2 April (lockdown starts) 1 - 7 June (Level 4 starts)
29 June - 5 July (Level 3 starts) 28 July - 2 August
20%
10%
0%
-10%
-20%
-30%
-40%
-50%
-60%
-70%
-80%
-90%
WC
GT
KZN
EC
FS
NW
MP
NC
LP
WC
EC
KZN
NC
NW
GT
LP
FS
MP
WC
KZN
GT
EC
FS
MP
NW
NC
LP
WC
NC
KZN
EC
GT
FS
NW
LP
MP
workplaces essential retail recreation & other retail transit stations
Source: Calculated from Google COVID-19 Community Mobility Reports. Accessed at
https://www.google.com/covid19/mobility/ on relevant dates.
8The economic effects of the pandemic on women
The economic impacts of the pandemic weigh particularly heavily on women, and especially
black women. They are more likely to have lost their jobs, be in risky occupations, and
end up with childcare responsibilities. Women are far less likely to benefit from the
employment-dependent COVID-19 temporary employee/employer relief scheme (TERS)
programme, which pays far more than social grants. Domestic violence reportedly increased
during the pandemic, and women without their own source of income find it hardest to
escape.
The biggest employment and income losses from the pandemic have been in personal
services, non-essential retail, and some cleaning jobs. The highest health risks for essential
workers have emerged in healthcare (especially for nurses), retail and mining. As Graph 10
shows, except for mining, these occupations are all disproportionately filled by women, and
particularly black women, often at lower pay than for occupations with similar education and
skills levels that traditionally go to men. In effect, that means many women have lost their
jobs, while the ones who have been able to remain at work have often been more likely to
catch COVID-19.
Graph 10. Women’s employment by race and gender, 2018
black women white women black men white men
3 000
2 500 189
2 000
thousands
158
1 500 872
2 030
289 1 017 249
1 000 580
1 007 993 438
283
500 147 164 208 524 624
211 254
523 511 504 355
397 394 372 327 321 321
271 230 221 202
-
Retail other than
domestic workers
manufacturing
other services (a)
education
cleaners (b)
health
financial/profes-
accomodation
construction, util-
agriculture
security (c)
government
home-based care (d)
Petrol and
mining
auto sales
sional services
ities, logistics
general
Catering/
auto/petrol
Notes: (a) Includes managers and auxiliary workers in cleaning and security. (b) Data do not separate out
commercial cleaning as an industry; figures here are for cleaners and “sweepers” in non-professional business,
community and personal services. (c) Both private security guards and public security services. Data do not
separate out private security as an industry; figures for private sector relate only to security guards in
non-professional business services. (d) Includes childcare. Figures distinguish between domestic workers, who
are presumably employed directly by a family, and childcare and home-based care workers in community and
personal services. Source: Calculated from Statistics South Africa. Labour Market Dynamics 2018. Downloaded
from Nesstar site at www.statssa.gov.za in February 2020.
On the plus side, 8% of black women and 3% of white women were educators, so they have
mostly kept their jobs, and until schools reopen face relatively limited risk of contagion. That
said, a quarter of all women with paid employment work in the public sector, compared to
between a seventh and a tenth of men and white women – and National Treasury plans to
reduce the pay of all public servants, including healthcare workers and educators, over the
next few years in real terms.
9Figures for workplace transmission of COVID-19 by gender are not available. As of 2 August,
24 100 healthcare workers had been infected, with 181 fatalities. That gives a rate of over
3 500 infected per 100 000 healthcare workers in both the public and private sector, or more
than three times the national average. In mining, as discussed below, there were 2 400 cases
per 100 000 as of 7 August. In 2018, of the 650 000 healthcare workers, 60% were black
women and 9% were white women.
As Graph 10 shows, white women were also disproportionately employed in finance and in
private professional business services, especially as lawyers. That means they were more
likely able to work from home during the pandemic.
Given the current government programmes, black women will receive less financial support
than other groups during the pandemic. The reason is that they are far less likely to be
employed for pay than other groups. In 2018, 38% of African women had paid employment
(up from 26% in 2003), compared to 50% of African men, 57% of white women, and 76% of
white men. When black women have paid jobs, their wages are generally substantially lower
than for men or for white women, even if controlled for education and age, as the following
graph shows. The gaps tend to be larger for older people with lower formal qualifications.
Graph 11. Median earnings from employment and self-employment by gender, education
and race, 2018
Men Women
20 000
20 000
20 000
20 000
20 000
19 600
18 000
18 500
18 000
16 000
16 000
14 000
14 000
12 000
12 000
10 000
11 000
10 500
10 500
10 000
8 000
9 000
8 000
7 500
6 000
7 000
7 000
2 400
6 500
2 036
6 000
5 800
5 500
4 000
5 100
5 000
3 000
4 000
3 466
3 500
3 200
2 000
-
black white black white black white black white black white black white black white black white
less than matric matric plus university less than matric matric plus university
matric diploma degree matric diploma degree
18 to 34 35 to 64
Source: Calculated from Statistics South Africa. Labour Market Dynamics 2018. Downloaded from Nesstar site at
www.statssa.gov.za in February 2020.
The main source of relief during the pandemic has been the Unemployment Insurance Fund
(UIF) COVID-19 TERS programme, which by the end of July had paid over R35 billion to cushion
workers against job losses. The average COVID-19 TERS payment is around R3 500 a month.
But only one in seven black women is employed in the formal private sector, compared to just
over a quarter of black men, a third of white women and half of white men.
In theory, domestic workers are eligible for the COVID-19 TERS programme. But they are less
likely to be registered for UIF and to receive the COVID-19 TERS grant. In 2018, a million black
women, or one black woman in 20, was a domestic worker, but only 35 000 domestic workers,
or about 3%, received COVID-TERS relief, compared to around a third of other formal workers.
10While it is not clear how many domestic workers lost their jobs and incomes during the
pandemic, they were only allowed to return to work in Level 3.
In contrast to the COVID-19 TERS grant, women are more likely to benefit from social grants
than men, mostly because they are more likely to be primary caregivers for children. The child
support grant, however, is only R440 a month, or approximately half the Statistics South
Africa poverty line for a single person. Until September, to provide relief during the pandemic,
it will be increased by R500 per caregiver (not child), which raises the amount for a single child
to the lower poverty line. In addition, for six months women who do not have paid work and
do not receive any other social grant or UIF support are eligible for the special COVID-19 grant.
It is worth only R350 a month, however, or a tenth of the average for COVID-19 TERS.
Women who have retained paid jobs have had to figure out childcare without much social
support. The situation was hardest during lockdown, as childcare workers were not allowed
to commute to private homes and schools were closed. In contrast to some other countries,
childcare was shut down even for essential workers, who had to go to work. Schools will
remain largely closed for on-site learning until the end of August.
Finally, the police have reported an increase in gender-based violence in recent months as
economic and healthcare stresses have piled up. Women with little or no income of their own
find it particularly difficult to escape abusive situations.
In short, the measures to cushion households and workers against the economic impacts of
the pandemic have generally not done much to overcome the disadvantages faced by women,
especially black women. Unless more tailored solutions are found, women will likely end up
losing more from the pandemic in economic terms than men.
Company developments
Infections
Reports on workplace infections in the private sector, outside of mining, remain sparse.
The National Union of Metalworkers (NUMSA) said that 120 workers have been infected at
Volkswagen South Africa, of whom one died. On 17 July, workers walked out on the grounds
that the employer was not abiding to COVID-19 safety regulations. In response, Volkswagen
suspended 14 shopstewards. Over the past few months, it has publicised its efforts to
introduce infection-prevention measures. Still, under the regulations, workers are allowed to
stop work if they think conditions are unsafe.
The chemicals company AECI reported that 183 of its workers in South Africa tested positive
as of the end of July. Three of these workers died.
Mining remains the only industry to publish consolidated figures on infections. The industry
continues to report a relatively rapid increase in cases. Gold and platinum, which have
the largest underground mines remain at most risk, but more cases are emerging in coal and
other mining.
11Graph 12. Reported cases in mining by commodity, 8 May to 24 July
platinum gold coal other new cases
12 000
10 000 1 273
1 731
8 000 992
620 1 248
2 384
1 059
6 000 2 010
400 1 783
693
4 000 289 1 450
459
1 117
245
2 000 859 2 133
1 772
703 1 220 1 437
600 1 141
500 789
299 307 410 1661
022 1 490 2 094 2 853 4 067 4 420 5 054
- 8 8 62 188
8 May
15 May
22 May
29 May
5 June
12 June
19 June
26 June
3 July
10 July
17 July
24 July
31 July
7 August
Source: Minerals Council. COVID-19 Dashboard. Downloaded on relevant dates from
https://www.mineralscouncil.org.za/minerals-council-position-on-covid-19.
As of 7 August, the mines reported over 10 000 cases, or 2 370 per 100 000 miners. That was
more than twice the national incidence. They had tested 35 000 employees, or nearly 9 000
for every 100 000 employed, compared to a national average of 5 300. Nonetheless, they had
a higher rate of positive cases than the national average. As of 7 August, according to their
weekly dashboard, 27% of all tests conducted on the mines had returned positive, compared
to 17% for the country as a whole.
The Mine Health and Safety Agency told the portfolio committee that it had conducted
1 681 safety audits for COVID-19 on the 385 mines at the end of June. It did not, however,
report on its findings.
The public sector reports occasionally on infections for its main frontline services – that is,
healthcare, education and policing.
As noted, as of 2 August 24 100 healthcare workers had been infected, accounting for 5% of
all cases. In response to protests from the healthworkers’ unions, the Minister said he would
require every hospital to set up an Occupational Health and Safety Committee, which should
meet weekly, by the middle of August. Establishing this kind of committee was, however,
already agreed in April. The media reported stoppages in healthcare facilities in
KwaZulu-Natal, the North West and the Free State in the past 10 days because of workers’
concerns about inadequate cleaning or protective equipment.
Residential facilities are particularly high risk. At Witrand psychiatric hospital in the North
West, which has space for almost 900 patients, 100 tested positive in July, as did six staff
members. In correction centres, through 26 July there were almost 5 000 confirmed cases,
but two thirds were corrections officers. Some 18 inmates and 37 officers had died.
12In Gauteng, as of 5 August, 2 099 schools were affected by Covid-19. Some 714 learners and
1 671 educators had tested positive. On 3 August, the Minister of Basic Education told
Parliament that over 10 000 recent graduates and fourth-year education students were
available to substitute for educators who have COVID-19 or comorbidities that raise the risk
of infection. The national department estimated that would be sufficient. A few days later,
however, Gauteng said it needed to replace 6 750 teachers who had comorbidities, which
was substantially higher than the national department had estimated. Substitutes are,
however, only provided if departments cannot deploy their existing capacity to cover for
absent teachers.
Industry and company developments
Mining
The Minerals Council now expects a 15% to 20% decline in output for the year, compared to
its estimate of around 10% a few months ago. The industry now has 440 000 employees back
at work. However, the Council still expects to lose jobs until 2024, mostly due to stagnant
international prices combined with relatively high costs by international standards for some
commodities. In this context, the diamond-mining companies reported unprecedented low
sales in the second quarter of 2020.
The Council argues that South Africa mining has seen a structural decline over the past
decade, and that government should provide support by improving its infrastructure and
licensing rules. Arguably, however, mining is not suffering primarily from domestic
shortcomings. In 2011, the international metals price boom that began in the early 2000s
ended, with an abrupt fall of around 50% in the international prices of South Africa’s main
minerals exports.
Chemicals
Sasol was facing headwinds before the pandemic as a result of problems with its huge
investment in new plants in the US. It now estimates that COVID-19 has cost it R1 billion in
revenue and R500 million in profits. As a result, its dividends will be down by a third from
last year.
Sasol has committed to disposing non-core assets to improve its liquidity in the face of the
crisis. As part of the process, it has contracted to outsource its oxygen production capacity to
another company, which promises to reduce emissions there by 30% by 2030. Overall, as
noted below, Sasol plans to reduce its emissions by 10% over the coming decade. It will,
however, remain one of the most emissions-intensive companies in the world, since its core
coal-to-liquid-fuels process emits extraordinary levels of greenhouse gases.
South Africa’s other major basic chemicals plant, AECI, says COVID-19 reduced its revenues
by just 6%, but its profits are down by a third. Of its 7 600 workers, 90% are at work on site or
at home, but its production has been slowed by lower demand for many products, although
it has increased production of disinfectants.
Energy
On 28 July, a high court judgement required the National Energy Regulator of South Africa
(Nersa) to allow Eskom to increase its tariffs by the full amount of its reported costs even
though it received a subsidy from the state. The result could be an additional 10% increase in
13the electricity tariff above inflation. A week later, Nersa announced that it would appeal the
judgment.
The process underscores the unwieldy and often unclear nature of the price-setting processes
for Eskom. In particular, the law says that Nersa should ensure it has a reasonable rate of
return after taking only necessary costs into account. It does not, however, define the
required rate of return or how far Nersa can go in challenging Eskom’s costs. For its part,
Eskom historically claimed that all of its costs are immutable at least in the medium term. In
the past decade, whenever Nersa has granted Eskom an increase that does not match up to
its claims, it simply ran up a loss, putting pressure on the rest of society to accept another
above-inflation price hike. At the same time, technical faults in its plants, both newly built
and old, have led it to repeatedly ration supply.
That said, the new Eskom CEO has admitted that its costs had increased by 30% a year for the
past five years. At the end of July, the company cancelled a five-year R14-billion contract for
oil and diesel that was awarded in 2019, on the grounds that it involved inflated prices.
The combination of soaring prices and unreliability have led major companies to go off grid
as far as they can, as well as shifting away from electricity-intensive production
processes. Electricity demand fell by 10% over the past 10 years, and the rate is likely to
accelerate as government has made it easier for big plants to generate their own power. In
May, Sasol issued a request for information for 600 MW, and based on the responses it
expects to issue requests for proposals totalling up to 300 MW. In the past two weeks, it
issued a request for proposals for two solar plants to provide 10 MW each at Secunda
and Sasolburg. For its part, AMSA now says that, given low steel demand, it will delay plans
to develop its own generation, but will seek to improve efficiency in electricity use. Over
the past decade it already closed its electric-arc furnaces because of the rising cost
of electricity.
According to news agency Bloomberg, an agreement on how to cut Eskom’s debts has been
reached in principle, but not signed as of Friday despite an original commitment to 3 August.
Government guarantees to Eskom equal almost a tenth of the national debt. Apparently the
new agreement will not mandate loans from retirement funds.
Auto
The National Association of Automobile Manufacturers of South Africa now expects a decline
of almost a third in production compared to 2020. It expects South Africa to produce 435 500
vehicles, down from a record 630 000 units in 2019. Production dropped almost two thirds in
the second quarter of 2020, largely due to the lockdowns in South Africa and in the auto
companies’ home countries (mostly Germany, Japan and the US). That means it fell twice as
fast as in the worst quarter of the 2008/9 global financial crisis. In the longer run, the very low
interest rates in South Africa and abroad should help boost demand, but will largely be offset
by the anticipated fall in GDP and household incomes.
New vehicle sales in July climbed by over 500 units, or 1,7%, compared to June, reaching
32 400. That means they were down by 29,6% compared to July 2019; in June, they were
down 30,7% on the previous year.
14Tourism
The Department of Tourism published a recovery plan for the sector on 4 August, following
extensive consultation with (and lobbying by) the industry. Unfortunately, it relies on
forecasts for the industry that were mostly completed in May. As a result, it explicitly projects
that South Africa would control the contagion like South Korea, Australia and Singapore, that
cases would plateau in the US, and that Europe would not face a second wave. In practice,
after May cases climbed extraordinarily steeply in South Africa; Australia and Singapore have
seen substantial outbreaks; the US returned to relatively rapid spread; and many European
countries have seen at least isolated outbreaks.
Based on its forecasts, the recovery plan suggests that opening up to international flights
would lay the basis for a full recovery in South African tourism by 2022. It argues that “The
priority for tourism is to resume operations as early as it is safe to do so”, and that “Tourism
recovery depends on early, responsible resumption”. Its proposals explicitly rely on its most
optimistic projections for international recovery, which would see travel from most of Europe,
the US and India resuming in the second half of 2020.
This approach represents something of a triumph of hope over realism. In practice, the high
levels of contagion in South Africa, the US and India – which admittedly emerged largely after
the plan was drafted – make a recovery in international tourism unlikely at least for the rest
of 2020. A particular challenge is that, as a long-haul destination, travel to South Africa is
expensive and requires a willingness to sit in a crowded venue for many hours. That has
become a significant deterrent given an economic decline in overseas markets as well as fears
of the pandemic. In this context, it is noteworthy that the plan was consulted widely with local
and foreign suppliers of tourism services, but apparently did not include an effort to evaluate
how travellers would respond to higher levels of contagion in South Africa.
A second area of optimism relates to resourcing for the plan. It estimates that the industry
will require R15,4 billion in “blended finance” to maintain capacity despite the lockdown. That
equals two months’ working capital. The (anonymous) authors recognise that government
funds on that scale are unlikely to be available, but hope that the state will assist in accessing
other sources, including the national credit-guarantee scheme, multilateral funds, resources
from global conservation non-profits, and private investment. In this context, the plan
requests that government explore tax incentives and assist in pressuring insurance companies
to pay out on business-interruption policies. It also implies that government should privatise
public tourism assets like accommodation at the national parks as a way to mobilise
investment.
As a reality check, last week the Department of Arts and Culture announced a second wave
of relief for cultural workers worth R77 million. It will provide R2 200 apiece for around 12 000
beneficiaries between September and November. It will only provide support to people who
did not benefit from the earlier round.
The recovery plan does not discuss the impact on profitability of measures to prevent
infection in entertainment, accommodation and recreational venues. For instance,
restaurants internationally find that they often cannot return to profitability as long as they
have to operate at low capacity. Many cultural events have been unable to reopen at all, in
large part because demand remains suppressed as potential participants fear getting
infected. Last week, the events industry organised to ask for more financial support from
government, since it recognised that it cannot open safely under the current circumstances.
15Finally, the plan identifies the problems facing the local aviation industry, especially South
African Airways (SAA), as a crucial challenge. In response, it proposes that the tourism
industry partner with foreign airlines to maintain adequate flights.
The overall outlook for air travel remains bleak. The International Air Transport Association
(IATA) expects that air travel in Africa will be 50% down for the year, and recover fully only in
2023. At its lowest point, in April, air travel was at 4% of January levels; in the first half of July,
it had recovered to around 25%. International flights were reopened or planned to reopen
only in Benin, Ethiopia, Ghana, Kenya, Rwanda, Senegal and Tanzania, which account for a
fifth of the continent’s flights. Internationally, half of all airlines have downsized, and the
remainder have mostly avoided it only thanks to government support. More downsizing is
expected in the rest of the year as a result of continued depressed demand.
In this context, SAA’s financial position remains unclear. On 28 July, the business rescue
practitioners said it had fulfilled all the conditions required to avoid liquidation, and put off
an anticipated creditors’ meeting. As of 5 August, however, the government had not
announced how it would fund the rescue plan. The business rescue practitioners hope to
finalise planned retrenchments for around 2 500 employees by 18 August, while another
1 000 will go into a training lay-off scheme (at reduced pay) and 1 000 will remain with the
airline in hopes that it will be revived in some form.
Liquor
In the past two weeks, the liquor industry intensified lobbying to be allowed to restart sales.
As noted above, however, the renewed ban in mid-July likely helped contain the spread of
the contagion, although it is not clear if it worked mostly by reducing liquor consumption or
by signalling that the risk of contagion was severe. Internationally, bars and restaurants have
repeatedly been sites for super-spreader events for COVID-19. Given the persistence of a
relatively high level of new cases and the OECD’s estimates of the cost of letting the contagion
get out of control again, the risk of reversing the ban now seems disproportionate to the
benefits.
Still, the major players in the industry have initiated what seems to be a coordinated campaign
to argue that the ban on liquor sales, including in bars, will lead to a fall in investments. They
have even said they will not undertake planned maintenance and upgrades. South African
Breweries said it will cut its capital expenditure by R2,5 billion for the coming year. Heineken
cancelled a planned R6 billion expansion in Durban, which it said would create 400 jobs at
R5 million apiece. Consol announced it would delay a R1,5 billion expansion at its factory in
Nigel, which would have replaced imported containers for some major beverage producers.
It also says it will halt R800 million in planned maintenance. Consol argues that alcohol
accounts for 85% of glass container sales, and that 55% of liquor is consumed on site. It
expects that the South African glass industry will shrink by 15% as of mid-2021.
SOCIO-ECONOMIC STRAINS
The combination of an economic decline and the risk of infection inevitably leads to rising
tensions and conflict, especially given South Africa’s profound economic inequalities and
social divisions. In the past two weeks, these tensions have emerged in rising protests as well
as anger at corruption in procurement of healthcare inputs.
A study by Lizette Lancaster and Godfrey Mulaudzi at the Institute for Strategies
Studies reported a startling increase in protest action in the past few weeks. In July, they
16identified 232 demonstrations, for an average of eight a day, up from six a day in June and
the highest number recorded since the Institute began keeping track in 2013. For most of the
past seven years, the number of protests has fluctuated around two a day. A third of the
protests were in the Western Cape, although it accounts for only around a tenth of the
national population. A quarter took place in Gauteng, which is in line with its population size,
while KwaZulu-Natal and the Eastern Cape each saw a seventh of the total. Protesters gave a
variety of reasons for taking action, with issues mainly around workplace concerns (including
about failure to protect them against COVID-19), municipal services and electricity shut offs,
and the need for housing.
Given growing economic need, the use of state power to protect property rights seems
doomed to provoke conflict. This has emerged around both urban housing and electricity.
Cape Town saw 90 protest actions from mid-July to 5 August, largely linked to land invasions
for informal settlements. Cape Town’s government has noted that the pressure on land has
grown because informal landlords push out renters when they can’t pay, despite the legal ban
on evictions during the lockdown. In effect, an asymmetry has emerged, where the state does
not prevent illegal evictions of renters from informal housing, but does use its power to
prevent the newly homeless people from taking over land. Moreover, the cities say they
mostly tear down residences that are empty or new, even though the owners claim otherwise.
They argue that the owners can lay a case if they feel the law has been broken, but of course
few informal residents have the resources, time or knowhow to pursue legal remedies.
Meanwhile, the Western Cape housing department has a waiting list of 600 000 and the
average wait is 15 years.
Evictions happened in other metros. A report in June said that eThekwini had evicted
900 people in 18 actions during the lockdown. In early August, the spokesperson for the
municipality told New Frame that the city had to control “land invaders” who were taking
advantage of the crisis. As usual, the city said it was only knocking down unoccupied shacks,
which residents disputed. At the end of July, 200 residents were evicted from an informal
settlement near the East London airport.
While it strongly resisted land invasions, from the start of the pandemic the government said
it would seek to fast-track new housing for people in informal settlements to reduce density,
which makes it harder to prevent outbreaks. In practice, the process has proven very slow
and reached only hundreds out of the 1,2 million households living in informal housing. In the
North West, for instance, a settlement of 40 tin shacks was built at a cost of R64 000 apiece.
Other provinces and municipalities plan prefab houses, but so far few have been constructed.
Again, the pandemic has brought to a head the long-standing housing problems in South
Africa’s urban areas. They in turn are rooted in apartheid policies that for decades prevented
most Africans from building homes in urban areas, requiring many to live in impoverished and
underserved labour-sending regions. The elimination of these restrictions with the creation
of a unitary country from 1994 let loose the pent-up demand to move, or often to return, to
the country’s economic centres. In the late 1980s, around half of the population officially lived
in the so-called “homeland” areas; today, the figure is about a quarter. As a result, Quantec
estimates that while the population as a whole has climbed some 45% since the early 1990s,
Johannesburg has seen its population grow by 125%, and Cape Town by 80%. In both cities, a
fifth of the households lives in informal housing, split between self-standing and backyard
shacks. The latter are mostly rentals.
17Electricity has been another source of protests, especially in Gauteng. During the lockdown,
Eskom adopted a policy of shutting off electricity for densely populated areas that it serves
directly and that have many illegal connections – in effect, historically black townships and
informal settlements. Eskom claimed that the aim was to avoid overloading its substations,
but the effect was that people faced hours without electricity even if they had paid their
electricity bills, in mid-winter, during a lockdown. On 6 August, protestors shut down the main
roads leading out of Mamelodi in protest against the electricity shut offs. They were
particularly angry because turning off the electricity makes cable theft possible, which in turn
leads to more prolonged outages. Tembisa has seen repeated cut offs of electricity and
protests against them. At the end of July, protests over electricity cuts reportedly sparked
xenophobic attacks in Phola Park.
Again, the situation underscores the contradictory role of the state. As a state-owned
company, Eskom is trying to shift the burden of ending illegal connections to communities. It
could have found other solutions – for instance, investing in security guards for its stations or
setting up units to track down illegal connections. Instead, it has externalised the cost onto
communities that have little power to stop people from tapping into power lines, and so end
up turning to protest action.
Corruption in the procurement of protective equipment for healthcare workers has also led
to rising conflict. Among others:
• The Western Cape paid R32 million to a construction company that charged R2 300 for a
thermometer, although the price had been benchmarked by the National Treasury at just
under R1 000, and R16 per pair for gloves that the Treasury had benchmarked at R11,50.
• In Gauteng, the MEC for health stepped aside because his wife was friends with the owner
of a company that reportedly got an irregular tender for protective equipment. The
province is instituting action against two high-level public servants and is instituting
lifestyle audits for the entire executive council. The Special Investigating Unit is
investigating 90 companies that allegedly benefited from Gauteng tenders related to the
pandemic.
• The KwaZulu-Natal department of social development has opened criminal cases around
the corrupt procurement of R30 million worth of protective equipment and blankets. The
department procured 50 000 blankets at an excessively high price. Then it distributed only
5 000, with the remainder left in a warehouse.
Large sums are involved in the COVID-19 response. As of July, the National Treasury reported
that total expenditure on the effort came to R7 billion, with R3,5 billion by the provincial
departments of health. Almost half of the provincial health spend was by Gauteng.
Furthermore, to fast-track procurement as the pandemic hit, Treasury relaxed some reporting
requirements. As the scandals began to emerge, it announced that departments would be
required to return to normal practice. It will also publish the names of all suppliers and analyse
procurement data across the provinces. More broadly, the national government announced
that it would set up an inter-departmental committee to co-ordinate anti-corruption work,
arguing that an effective effort required greater co-ordination especially within the criminal
justice system.
In the event, virtually every country that has been hard hit by COVID-19 has suffered
substantial inefficiencies in procurement, and in some cases outright corruption. The nature
18of emergencies is that procuring the required inputs often seems more important than getting
the paperwork right and quality assuring suppliers. That often opens the door to corrupt
officials and businesses. In South Africa, however, public anger runs particularly deep because
of the recent history of state capture.
The social, political and economic strains arising from the pandemic and the associated
economic downturn point to the need for stronger measures to reduce the impacts on
households, communities and working people. The discourse on recovery and reconstruction
has tended to focus on rebuilding the economy when the pandemic is over. More work is
needed, however, on how to moderate its impacts before then – that is, in practice, during
the coming year.
In this period, economic activities will continue to be limited by the need to prevent
infections. Still, opportunities to minimise the economic impact of COVID-19 even in the short
run arise in four areas:
• Setting up learning systems at industry level that can continually improve measures to
prevent workplace transmission;
• Identifying projects to meet new requirements to prevent infection (for instance digital
platforms to provide services and entertainment, more extensive e-delivery services, and
personal transport to enable people to avoid the risk of taxis), and to replace imports that
have become more expensive or unavailable;
• Ensuring that unemployment support is provided promptly to people who lose their jobs
and that the COVID-19 TERS programme is extended for people with comorbidities, which
should help sustain household demand, while fast-tracking the establishment of
community-based public employment schemes and plans to cushion workers and
small businesses in industries that will recovery only slowly, such as entertainment and
catering; and
• Redirecting the stock of financial savings across the economy toward more targeted
and active expenditure to maintain economic growth as well as to provide relief for
low-income households.
See TIPS policy brief Towards a reconstruction programme
TIPS TRACKERS
TIPS Tracker: The economy and the pandemic highlights important trends in the
COVID-19 pandemic in South Africa, and how they affect the economy.
TIPS FDI Tracker monitors inward foreign direct investment projects. It reports on new
FDI projects, analyses these, and adds them to an ongoing list of investment projects.
TIPS Export Tracker provides updates on export trends and identifies sectors and
products that are performing well and those that are lagging.
TIPS Import Tracker provides an overview of import patterns and looks at the causes of
surges in imports, and their likely impact on industry.
Trade & Industrial Policy Strategies (TIPS)
info@tips.org.za I +27 12 433 9340 I www.tips.org.za
19You can also read