The Effect of Inulin and Sucrose Addition - Atlantis Press
←
→
Page content transcription
If your browser does not render page correctly, please read the page content below

The Effect of Inulin and Sucrose Addition
      on the Number of Colonies L. acidophilus and B.
      bifidum in the Soyghurt After the Freeze-Drying
                           Process

    Eka Noneng Nawangsih1(B) , Apen Apgani2 , and Bintari Rizkia Sekar Tirani3
   1 Department of Microbiology, Faculty of Medicine, Universitas Jenderal Achmad Yani,
                                     Cimahi, Indonesia
                       eka.noneng@lecture.unjani.ac.id
 2 Department of Internal Medicine, Faculty of Medicine, Universitas Jenderal Achmad Yani,
                                     Cimahi, Indonesia
  3 Bachelor of Medicine Study Program, Faculty of Medicine, Universitas Jenderal Achmad

                                 Yani, Cimahi, Indonesia

       Abstract. The freeze-dried soyghurt generally will be last much longer. However,
       the reduction of L. acidophilus and B. bifidum (LAB) colonies during the freeze-
       drying process could be occurred and it could be minimized by adding inulin
       as a prebiotic and sucrose as a cryoprotector. This research aimed to determine
       whether or not the colonies number in freeze-dried soyghurt with the SNI and to
       analyze the effect of inulin and sucrose addition to the growth of the LAB in the
       freeze-dried soyghurt. This experimental laboratory study with pretest- posttest
       design consists of 1 negative control group, 1 group of soyghurt, and 4 groups
       of soyghurt with the addition of 10% sucrose and 0.5%, 1%, 3%, 5% inulin. The
       bacterial growth was calculated using the TPC method. All data were tested using
       the Saphiro Wilk test, followed by the Kruskal Wallis and Mann Whitney Post
       Hoc test. The conclusion of this research was that the number of colonies in each
       experimental groups decreased after the freeze-dried process and only the group
       of soyghurt without any additions did not meet the standard of SNI. Statistical
       tests showed a significant distinction between groups, giving a conclusion that the
       addition of inulin and sucrose gave a better incretion of the LAB significantly. 10%
       sucrose and 3% inulin was the best combination which has 2.34 × 1029 CFU/ml
       as the highest TPC. It means that the higher of sucrose and inulin addition to
       the soyghurt, does not guarantee the number of LAB colonies inside will also be
       higher.

       Keywords: B. bifidum · Inulin · L. acidophilus · Soyghurt · Sucrose

1 Introduction
The freeze-dried yoghurt generally will be last for 6 months to 2 years [1]. One of the
most commonly used methods to make yogurt last much longer is the freeze-drying

© The Author(s) 2023
Y. Y. Kumala et al. (Eds.): ASCMF 2022, AHSR 53, pp. 65–75, 2023.
https://doi.org/10.2991/978-94-6463-060-2_11
66      E. N. Nawangsih et al.

process or lyophilization [2]. However, this process can cause damage to bacterial cells
so that the number of LAB colonies can decrease [3, 4]. The number of bacterial colonies
in yogurt products recommended by the Indonesian National Standard (SNI) is 106 to
108 CFU/ml [5]. To overcome this, inulin as a prebiotic and sucrose as cryoprotectant as
well as prebiotics need to be added [4, 6]. According to research, an inulin concentration
of 0.5% is the most effective concentration [7]. While the maximum concentration of
sucrose is best used is 15% [8]. Because the research will be conducted this time using
two types of prebiotics, the concentration of sucrose selected is 10% so that the osmotic
pressure balance of bacterial cells can be maintained [3, 4].
    The study aimed to determine the appropriate number of BAL colonies in soyghurt
after the dry freeze process with SNI and analyze the effect of the addition of inulin
and sucrose on soyghurt after the dry freeze process on the growth of L. acidophilus
and B. bifidum. The hypothesis of this study amounts to two points, namely 1) there is
a significant difference between the group that contains only soyghurt and the group
added inulin and sucrose (H1); 2) The higher the concentration of inulin and sucrose
added, the higher the number of BAL colonies in it (H2).

2 Materials and Methods

The subjects of the study were Lactobacillus acidophilus ATCC 4356 and Bifidobac-
terium bifidum ATCC 29521. The study was conducted at the Microbiology Laboratory
of the Faculty of Medicine, Jenderal Achmad Yani University from August 2021 to
January 2022. The research design used is pretest-posttest design. There were 6 groups
tested, consisting of 1 negative control group, 1 soyghurt group without any additions,
and 4 groups of soyghurt with sucrose 10% and inulin 0.5%, 1%, 3%, 5% which were
successively named KK (−). K1, K2, K3, K4, and K5. The ingredients used in the study
were soy milk, Lactobacillus acidophilus ATCC 4356, Bifidobacterium bifidum ATCC
29521, MRSA, MRSB, NaCl physiological, violet crystal solution, sodium bicarbonate
solution, PVP-iodine solution, safranin O solution, 96% acetone-alcohol solution, and
emersi oil.
    After all the tools are sterilized using autoclaves at a pressure of 1 atm and a temper-
ature of 121 °C for 15 min, the reidentification of L. acidophilus and B. bifidum bacteria
is carried out. Both bacteria are inoculated on the surface of MRSA and incusted at
37 °C in a CO2 incubator with CO2 levels of 7.5% for 2 × 24 h which are then identi-
fied macroscopically by looking at the shape of the colony on the surface of MRSA as
well as microscopically with Gram staining. Furthermore, the two bacteria are dissolved
separately into the physiological NaCl until a turbidity of 0.5 McFarland is achieved
which means the number of bacteria in it has reached 107 CFU/ml. The starter culture
of each bacterium is then mixed with a ratio of 1:1. Soy milk that has been made from
U.S. soybeans poured as much as 225 ml into each bottle of the trial group that has
been labeled the group name. Furthermore, inulin and sucrose are poured into K2 to K5
bottles according to the specified concentration and the entire group is sterilized with
autoclaves. Mixed starter cultures that are ready to be mixed into soy milk in K1 to K5
with a ratio of 1:9 or as much as 25 ml and incredied at 37 °C in a CO2 incubator with
CO2 levels of 7.5% for 1 × 24 h. Once the soyghurt is ready, each group is diluted
The Effect of Inulin and Sucrose Addition on the Number of Colonies       67

repeatedly and calculated the number of colonies by the Total Plate Count method and
the repetition of calculations duplo. A total of 60 ml from each group of soyghurt is then
made dry frozen preparations. Dried frozen soyghurt from each group was taken 0.03
g to mix with a physiological NaCl of 1.5 ml so that multilevel dilution could be done.
Furthermore, the number of colonies on the dried frozen soyghurt is recalculated by the
same method.
    The number of colonies that have been obtained is analyzed using the SPSS statistics
program version 25. All data is tested for normality with Saphiro Wilk test. Then contin-
ued with the Kruskal Wallis test and the Post Hoc Mann Whitney test so that differences
between groups can be assessed for their significance.

3 Results and Discussion
3.1 Reidentification of L. acidophilus
Bacterial reidentification is done macroscopically and microscopically. Macroscopically,
the L. acidophilus colony in Fig. 1 looks milky white and round with uneven colony
boundaries and a slightly convex surface. When compared to the parameters next to it, it
can be seen that the colonies formed in this study are larger in diameter which is likely
to occur because between inoculation strokes are too tight. Microscopically, in Fig. 2
can be seen the presence of a picture of bacteria in the form of a rod (basil) and purple
that gives the meaning that the bacteria are Gram positive bacteria. The picture is in
accordance with the parameters in addition to the results of research and literature that
mentions that L. acidophilus is a rod-shaped gram positive bacteria that is anaerobic and
does not form endospores [9].

3.2 Reidentification of B. bifidum
The results of the reidentification of B. bifidum ATCC 29521 are macroscopic can be seen
in Fig. 3. Colony B. bifidum looks colorless and its shape follows the direction of the ose
scratch. The colony is strictly limited to the surface of the colony that is slightly raised.
The picture of the colony is similar to the parameters of colony B. bifidum. According
to Li et al., the B. bifidum colony looks smooth round, white, and each measures about

                 Fig. 1. Colony L. acidophilus ATCC 4356 on MRSA media.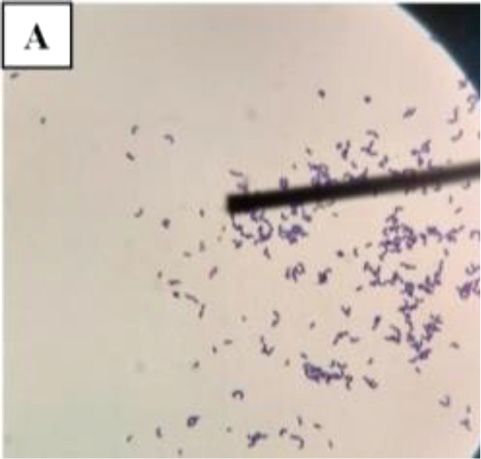
68      E. N. Nawangsih et al.

                   Fig. 2. L. acidophilus ATCC 4356 on Gram staining.

                 Fig. 3. Colony B. bifidum ATCC 29521 on MRSA media.

                     Fig. 4. B.bifidum ATCC 29521 on Gram staining.

1–1.5 mm. The difference may be due to differences in culture techniques, where B.
bifidum in Li et al. was planted with pour plate method, while B. bifidum in this study
was planted with streak method [10]. In Fig. 4 can be seen the presence of a picture of
dark purple bacteria and a short rod shape with several bacterial formations forming the
letter Y, according to the image of B. bifidum in the existing literature [11].
The Effect of Inulin and Sucrose Addition on the Number of Colonies 69
Table 1. Comparison of the number of BAL colonies on soyghurt before and after dry freeze
Group TPC results Difference
trial Before freeze- drying After freeze- drying (CFU/ml) decrease (CFU/ml)
(CFU/ml)
KK (−) 0 0 0
K1 2,53 × 10⁹ 3,45 × 10⁴ 7,30 × 10⁴
K2 3,64 × 10¹³ 2,39 × 10¹¹ 1,52 × 10²
K3 6,35 × 1026 1,55 × 10²³ 4,09 × 10³
K4 8,29 × 1032 2,34 × 1029 3,54 × 10³
K5 3,80 × 10¹⁹ 6,35 × 10¹⁴ 6,00 × 10⁴
Description: KK (−) (soy milk), K1 (soyghurt), K2 (soyghurt + inulin 0.5% + sucrose 10%), K3
(soyghurt + inulin 1% + sucrose 10%), K4 (soyghurt + inulin 3% + sucrose 10%), K5 (soyghurt
+ inulin 5% + sucrose 10%).
3.3 Number of Bacterial Colonies in Soyghurt Before and After the Dry Frozen
Process
Based on the results of the calculation of TPC values before freezing dry in Table 1 below,
the number of colonies L. acidophilus and B. bifidum is lowest in the group that contains
only soyghurt without any addition (K1), which is 2.53 × 10⁹ CFU/ml. The value meets
the minimum standard recommended by the SNI for the number of bacterial colonies in
yogurt products, which is 106 to 108 CFU/ml. Research conducted by Al-Ansari et al. [8]
showed that the number of colonies of L. acidophilus in imported soy milk without added
sugar was 1.8 × 10⁷ CFU/ml. This shows that the carbohydrate components contained
in US soy milk are actually enough to produce a minimum amount of TPC probiotic
drinks, especially if the probiotic drink contains two types of bacteria as in this study
whose colony number has a difference of 102 CFU/ml higher than the Al-Ansari et al.
[8] which only contains one type of bacteria. However, the number of colonies in K1
decreased to 3.45 × 10⁴ CFU/ml, indicating that K1 in dry frozen form is not eligible
for consumption.
The p value of 0.000 (p < 0.05) was obtained for the Saphiro Wilk test on TPC results
data before the dry freeze process indicating that the distribution of the data is not normal.
Then the data analysis continued with the Kruskal- Wallis test and obtained a p value
of 0.007 (p < 0.05) which means there is a meaningful relationship in the addition of
sucrose and inulin to the increase in the number of colonies in soyghurt before dry freeze.
Mann Whitney’s Post Hoc test was conducted and there was a significant difference in
each group with a value of p 0.025 (p < 0.05) (See Table 2).
The highest bacterial growth rate is found in K4 when viewed from Table 1. The
number of K4 colonies before the dry freeze process is 8.29 × 1032 CFU/ml, while
after the dry freeze process it becomes 2,34 × 1029 CFU/ml. These results do not fit the
hypothesis that the highest number of bacterial colonies should belong to the group with
the highest concentrations of sucrose and inulin, K5. The number of colonies in K5,
both before and after dry freeze, is lower than K4. According to research conducted by70 E. N. Nawangsih et al.
Table 2. Mann Whitney’s Post Hoc test results before freezing dry and after freezing dry
Group 1 Group 2 Value P Interpretation
KK (−) K1 0,025 Significant
K2 0,025 Significant
K3 0,025 Significant
K4 0,025 Significant
K5 0,025 Significant
K1 K2 0,025 Significant
K3 0,025 Significant
K4 0,025 Significant
K5 0,025 Significant
K2 K3 0,025 Significant
K4 0,025 Significant
K5 0,025 Significant
K3 K4 0,025 Significant
K5 0,025 Significant
K4 K5 0,025 Significant
Description: KK (−) (soy milk), K1 (soyghurt), K2 (soyghurt + inulin 0.5% + sucrose 10%), K3
(soyghurt + inulin 1% + sucrose 10%), K4 (soyghurt + inulin 3% + sucrose 10%), K5 (soyghurt
+ inulin 5% + sucrose 10%).
Setiarto et al. (2016), of the three concentrations of inulin tested, namely 0.1%, 0.3%,
and 0.5%, the concentration of 0.5% as the highest concentration is the most effective
concentration in increasing the growth rate of L. acidophilus [7]. Danirmala in his study
consisting of four test groups with sucrose concentrations of 0%, 5%, 10%, and 15%
respectively stated that the group with a 15% sucrose concentration was the group that
had the most number of colonies [8]. This indicates that the higher the concentration of
inulin and sucrose given, the higher the number of colonies obtained.
The two studies above only used one additional type of prebiotic, while this study
used two additional types of prebiotics, such as research conducted by Tari et al. [3].
Tari et al. [3] in his research on the viability of S. thermophillus, L. bulgaricus, and L.
plantarum in dried frozen purple yam yogurt made four test groups that each contained
10% skim milk with different concentrations of sucrose, namely 0%, 2.5%, 5%, and
7.5%. Tari et al. [3] stated that the largest number of bacterial colonies were found in
groups containing 5% sucrose and skim milk 10%. In addition, there is a study on the
viability of probiotic bacteria L. casei, L. acidophilus, and L. plantarum in soy milk
conducted by Nisa et al. [4] using sucrose (5% and 10%) and 10% detrines. It was noted
that the number of BAL colonies in the group containing a mixture of 10% sucrose and
10% dextrin was even lower. The equation of the two studies is that the largest number
of colonies was not owned by the test group in which sucrose concentrations containedThe Effect of Inulin and Sucrose Addition on the Number of Colonies 71
Table 3. Mann Whitney’s Post Hoc test results difference in TPC results
Group 1 Group 2 Value P Interpretation
KK (−) K1 0,025 Significant
K2 0,025 Significant
K3 0,025 Significant
K4 0,025 Significant
K5 0,025 Significant
K1 K2 0,025 Significant
K3 0,025 Significant
K4 0,025 Significant
K5 0,025 Significant
K2 K3 0,025 Significant
K4 0,025 Significant
K5 0,025 Significant
K3 K4 0,025 Significant
K5 0,025 Significant
K4 K5 0,025 Significant
Description: KK (−) (soy milk), K1 (soyghurt), K2 (soyghurt + inulin 0.5% + sucrose 10%), K3
(soyghurt + inulin 1% + sucrose 10%), K4 (soyghurt + inulin 3% + sucrose 10%), K5 (soyghurt
+ inulin 5% + sucrose 10%).
the highest concentrations of sucrose. Both argue that the concentration of sucrose is too
high when there has been another prebiotic mixture, it will result in osmotic imbalance
inside and outside the bacterial cells so that the condition will cause bacterial cells to
lyze and eventually die [3, 4].
The p value in the Saphiro Wilk test data difference in TPC results is 0.000 (p < 0.05),
therefore the data analysis continued with the Kruskal-Wallis test and obtained a value
of p 0.007 (p < 0.05) which means there is a meaningful relationship in the addition of
sucrose and inulin to the rate of decrease in the number of colonies L. acidophilus and
B. bifidum after the dry freeze process is carried out. Then continued with the Post Hoc
Mann Whitney test which turned out to be a significant difference in each group with a
value of p 0.025 (p < 0.05) (See Table 3).
The number of colonies in the entire test group decreased when viewed from the
results of TPC in Table 1. The most decreases were owned by groups containing only
soyghurt (K1) and groups containing soyghurt with 10% sucrose and the highest con-
centration of inulin addition (K6), which was 104 CFU/ml. The lowest decrease was
in the group containing soyghurt with 10% sucrose and the lowest concentration of
inulin addition (K2), which was 102 CFU/ml. While the group containing soyghurt with
sucrose 10% and inulin 1% (K3) and the group containing soyghurt with sucrose 10%
and inulin 3% (K4) experienced a decrease in the number of colonies by 103 CFU/ml.72 E. N. Nawangsih et al.
That is, the number of bacterial colonies in this study decreased by 2 to 4 log cycles
after the dry freeze process was carried out. The decrease is higher than the decrease in
the number of colonies in the Tari et al. study which is only about 1 log cycle [3].
Decrease in the number of colonies in soyghurt after dry freezing occurs because
during the freezing of products in the dry freezing process or lyophilization there is
damage to the structure and function of bacterial cells due to loss of cell stability. Osmotic
shock experienced by bacterial cells due to the loss of water in large quantities during
the drying process is suspected as a major factor in bacterial cell damage [9]. Therefore,
to minimize the occurrence of these events, it is necessary to add a protective material
of bacterial cells called cryoprotectants, one of which is sucrose [3, 4]. Sucrose is one
of the cryoprotectants that meets these criteria. As cryoprotectants, sucrose is thought
to balance turgor pressure by decreasing water activity, preventing oxidative damage,
and making lipid membrane structures and proteins more stable at low water activity as
during the drying process [4].
In addition to acting as cryoprotectants, sucrose can also act as a prebiotic. Sucrose is
a natural disaccharide that will be broken down by bacterial cells into glucose and fructose
as monosaccharides [12]. Additional prebiotics in the form of inulin are needed so that
the rate of growth and development of bacteria increases and the number of bacterial
colonies will remain high in excess of the standard SNI of probiotic drinks despite the
decrease due to the lyophilization process. Inulin is a group of natural polysaccharides of
carbohydrates consisting of fructose monosaccharides at each end of the strand contain
glucose [7, 13]. Glucose is metabolized by bacteria through the Embden Meyerhoff
Parnas (EMP) pathway [14].
During anaerobic conditions, glucose is broken down in the glycolysis process into
glucose 6-phosphate which is then converted into fructose 6-phosphate. The molecule is
broken down into two glyceraldehyde 3-phosphate molecules that will undergo oxida-
tion and phosphorylation into 3-phosphoglycerate. Furthermore 3-phosphoglycerate is
processed into phospholiolpiruvat producing two pyruvate molecules. Pyruvate is then
reduced to lactate [15]. Lactic acid will be used by bacteria as a source of carbon through
metabolic pathways β-oxidase into energy for bacterial growth, reproduction, and activ-
ity [13]. In the presence of additional sucrose and inulin, the energy needs of bacteria
during the lag phase will certainly be met properly so that the stationary phase can last
longer. In addition, inulin has a prebiotic or bifidogenic effect that works by increasing
growth rate, stimulating development and starting the metabolic action of bacteria in the
colon, particularly Lactobacillus sp. Bifidobacterium sp [16].
In Table 1 it can also be seen that between the number of colonies before and after
the freeze is dry, the difference in the number of colonies in K2, K3, and K4 as the test
groups added inulin and sucrose is lower than the K1 that is not added inulin and sucrose.
That is, L. acidophilus and B. bifidum in K1 rely only on the carbohydrate components
of soy milk to survive and replicate. Both BAL do not get inulin and sucrose that act
as prebiotics and can increase their growth rate [3, 13]. In addition, because it does not
get sucrose as a cryoprotector, the possibility of damage to the structure and function of
BAL cells during the freezing process of the product will certainly be greater [3]. This
is what resulted in a high decrease in the number of colonies in K1.The Effect of Inulin and Sucrose Addition on the Number of Colonies 73
In addition, it can be seen that the decrease in the number of colonies in K5 is as
large as K1 whereas K5 is a test group with the highest concentrations of inulin and
sucrose. Most likely the event was caused by three main causes. First, osmotic shock
experienced by bacterial cells during the freezing process of the product will result in
damage to the structure and function of these cells. Second, too high a concentration of
prebiotic mixtures will result in osmotic imbalances inside and outside bacterial cells so
that the condition can cause bacterial cells to lyze and eventually die [3, 4]. This is one
of the reasons why the 10% sucrose concentration is prefera over the 15% concentration.
Third, due to the high concentration of inulin and sucrose, the bacterial population has
indeed increased greatly but this is also followed by an increase in toxic waste from the
metabolism of these bacteria so that the bacterial mortality rate will be higher than the
growth rate [15].
Exposure to oxygen to both bacteria can cause some partially reduced compounds to
be produced, including superoxide anions (O2 − ), hydrogen peroxide (H2 O2 ), and highly
reactive radical hydroxyl (HO). Each of these three compounds can cause oxidative stress
so that damage to cellular proteins, lipids, and DNA can occur. In addition, bacterial
metabolic processes can produce ho byproducts that are highly toxic through fenton
reactions. H2 O2 reacts with Fe2+ to generate HO. HO can damage cell proteins that
cause ATP production to decrease so that the energy possessed by bacterial cells to carry
out growth becomes greatly reduced. Then HO can cause damage to phosphodiester
bonds in the structure of DNA and damage to lipid structures in the plasma membrane
so that bacterial cells become lysis [16].
The high population of bacteria makes the decline in nutrient intake quickly occur
because of competition between cultures that are high enough that the mortality rate of
bacterial cells will be much higher than the growth rate. Sucrose can indeed balance the
turgor pressure of the cell but if the concentration is too high, then osmotic imbalance
inside and outside the bacterial cell can occur so that bacterial cells lyze and eventually
die [17]. Bacteria that have died do not have the ability to form colonies so at the time
calculated using a colony counter, it appears that the number of bacterial colonies is
lower [4].
4 Conclusion
The conclusion of the study was that the number of colonies in the entire trial group
decreased after the dry freeze process was carried out. Hanya group of dry frozen
soyghurt without any additions that do not meet SNI standards. Statistical tests showed
that the addition of inulin and sucrose to dried frozen soyghurt had a significant rate of
colony decline after the dry freeze process by providing significantly improved growth
of L. acidophilus and B. bifidum (H1). accepted). The combination of 3% inulin and 10%
sucrose provides the highest TPC result, which is 2.34 × 1029 CFU/ml. This suggests
that the higher the concentration of inulin and sucrose additions to soyghurt does not
guarantee that the number of BAL colonies in them will also become increasingly high
(H2 is rejected).74 E. N. Nawangsih et al.
References
1. G. Santos, R.I. Nogueira, and A. Rosenthal, “Powdered Yoghurt Produced by Spray Drying
and Freeze Drying : A Review”, Brazilian Journal of Food Technology, pp. 1-9, 2018.
2. M.S. Soenarno, I.I. Arief, C. Sumantri, E. Taufik, and L. Nuraida, “Plantarisin Characterization
IIA-1A5 as Antimicrobial and Evaluation of Encapsulated Frozen Dry Preparation Activity”,
Journal of Food Technology Applications, vol. 9, no. (1), pp. 30-7, 2020.
3. A.I.N. Tari, C.B. Handayani, and S. Hartati, “Effect of Cryoprotectant Concentration on Starter
Culture Viability Sinbiotic Yogurt with Freeze Dried Sweet Potato Extract Supplementation,”
Int J Adv Trop Food, vol. 2, no. (1), pp. 8–17, 2020.
4. F. Nisa, J. Kusnadi, and R. Chrisnasari, “Viability and Sublethal Detection of Probiotic
Bacteria on Instant Freeze Dried Fermented Soy Milk (Study on Isolate Type and Sucrose
Concentrations as Cryoprotectant)”, Jurnal Teknologi Pertanian, vol. 9, no. (1), p. 45, 2016.
5. A.N. Olaimat, I. Aolymat, M. Al-Holy, M. Ayyash, M. Abu Ghoush, A.A. Al- Nabulsi, …
and N.P. Shah, “The potential application of probiotics and prebiotics for the prevention and
treatment of COVID-19”, npj Sci Food, vol. 4, no. (1), 2020.
6. I.S. Surono, M.C. Collado, S. National, S.J. Salminen, and J. Meriluoto, “Effect Of Glucose
And Incubation Temperature On Metabolically Active Lactobacillus Plantarum From Dadih
In Removing Microcystin-LR”, Food and Chemical Toxicology, vol. 46, pp. 502-507, 2008.
7. R.H.B. Setiarto, N. Widhyastuti, I. Saskiawan, and R.M. Safitri, “Effect of Variations in
Inulin Concentrations on Fermentation Process by Lactobacillus acidophilus, Lactobacillus
bulgaricus and Streptococcus thermophilus”, Biopropal Industri, vol. 8, no. (1), pp. 1-17,
2016.
8. M.M. Al-Ansari, S.A. Sahlah, L. AlHumaid, and A.J. Ranjit Singh, “Probiotic Lactobacilli:
Can be a Remediating Supplement for Pandemic COVID-19. A Review”, Journal of King
Saud University-Science, vol. 33, no. (2), pp. 1-8, 2020.
9. L.D. Danirmala, Effect of Sucrose Addition On The Growth of L. acidophilus In Vitro in
Local Soybean Milk Media Bromo Varieties. Cimahi: Faculty of Medicine General Achmad
Yani University, 2014.
10. M. Li, Y. Jin, Y. Wang, L. Meng, N. Zhang, Y. Sun, … and Q. Sun, “Preparation of Bifidobac-
terium breve encapsulated in low methoxyl pectin beads and its effects on yogurt quality,” J
Dairy Sci., vol. 102, no. (6), pp. 4832-43, 2019.
11. J.M.A. Khaled, “Saudi Journal of Biological Sciences Probiotics, Prebiotics, and COVID-19
Infection: A Review Article”, Saudi J Biol Sci., vol. 28, no. (1), pp. 865-69, 2021.
12. A.M. Shendurse and C.D. Khedkar, Glucose: Properties and Analysis. 1st ed. Encyclopedia
of Food and Health. Elsevier Ltd., 2016, pp. 239-247.
13. M. Shoaib, A. Shehzad, M. Omar, and A. Rakha, “Inulin: Properties, Health Benefits and
Food Applications”, Carbohydrate Polymers, pp. 444-54, 2017.
14. W. Wijaningsih, In Vitro Antibacterial Activity and Properties of Kimi Kefir Milk Green
Beans (Vigna radiata) by Influence of The Number of Starters and Length of Fermentation.
Semarang: Pasca Sarjana Program of Diponegoro University, 2008.
15. L. Bruslind, Microbiology. Oregon State University, 2021.
16. M.C.T. Leite, B. Troxell, J.M. Bruno-Bárcena, and H.M. Hassan, “Biology of Reactive Oxy-
gen Species, Oxidative Stress, and Antioxidants in Lactic Acid Bacteria”, Probiotics Prebiotics
Curr Res Futur Trends., no. (December), pp. 205-18, 2016.
17. S. Kawasaki, M. Nagasaku, T. Mimura, H. Katashima, and S. Ijyuin, “Effect of CO2 on
Colony Development by Bifidobacterium Species”, Appl Environ Microbiol., vol. 73, no.
(23), pp. 7796-8, 2019.The Effect of Inulin and Sucrose Addition on the Number of Colonies 75
Open Access This chapter is licensed under the terms of the Creative Commons Attribution-
NonCommercial 4.0 International License (http://creativecommons.org/licenses/by-nc/4.0/),
which permits any noncommercial use, sharing, adaptation, distribution and reproduction in any
medium or format, as long as you give appropriate credit to the original author(s) and the source,
provide a link to the Creative Commons license and indicate if changes were made.
The images or other third party material in this chapter are included in the chapter’s Creative
Commons license, unless indicated otherwise in a credit line to the material. If material is not
included in the chapter’s Creative Commons license and your intended use is not permitted by
statutory regulation or exceeds the permitted use, you will need to obtain permission directly from
the copyright holder.You can also read