The effect of type and location of baby cots on indoor environment quality in a daycare centre - Eindhoven University of Technology research ...
←
→
Page content transcription
If your browser does not render page correctly, please read the page content below
The effect of type and location of baby cots on indoor
environment quality in a daycare centre
Citation for published version (APA):
de Waard, M. J., & Zeiler, W. (2015). The effect of type and location of baby cots on indoor environment quality
in a daycare centre. In M. G. L. C. Loomans, & M. te Kulve (Eds.), Proceedings of the Conference on Healthy
Buildings Europe 2015, 18-20 May 2015, Eindhoven, The Netherlands (pp. 1-8). [ID399] Technische Universiteit
Eindhoven.

Document status and date:
Published: 18/05/2015

Document Version:
Publisher’s PDF, also known as Version of Record (includes final page, issue and volume numbers)

Please check the document version of this publication:
• A submitted manuscript is the version of the article upon submission and before peer-review. There can be
important differences between the submitted version and the official published version of record. People
interested in the research are advised to contact the author for the final version of the publication, or visit the
DOI to the publisher's website.
• The final author version and the galley proof are versions of the publication after peer review.
• The final published version features the final layout of the paper including the volume, issue and page
numbers.
Link to publication

General rights
Copyright and moral rights for the publications made accessible in the public portal are retained by the authors and/or other copyright owners
and it is a condition of accessing publications that users recognise and abide by the legal requirements associated with these rights.

       • Users may download and print one copy of any publication from the public portal for the purpose of private study or research.
       • You may not further distribute the material or use it for any profit-making activity or commercial gain
       • You may freely distribute the URL identifying the publication in the public portal.

If the publication is distributed under the terms of Article 25fa of the Dutch Copyright Act, indicated by the “Taverne” license above, please
follow below link for the End User Agreement:
www.tue.nl/taverne

Take down policy
If you believe that this document breaches copyright please contact us at:
openaccess@tue.nl
providing details and we will investigate your claim.

Download date: 15. Sep. 2020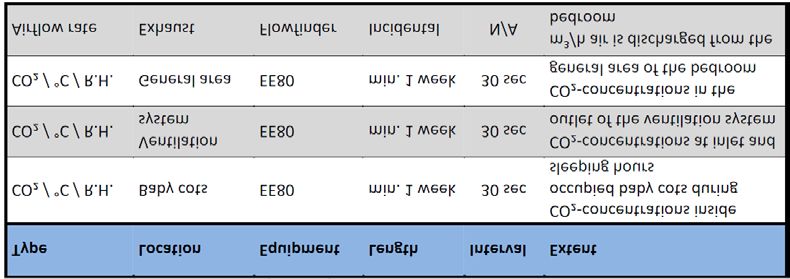
E: Sources & exposure
E2:Exposure reduction

THE EFFECT OF TYPE AND LOCATION OF BABY COTS ON INDOOR
ENVIRONMENT QUALITY IN A DAYCARE CENTRE

Mark de Waard1, Wim Zeiler1,*
1
 Department of the Built Environment, University of Technology Eindhoven,
Eindhoven, Netherlands

*Corresponding email: w.zeiler@bwk.tue.nl

Keywords: IAQ, daycare centre, Baby cots, Ventilation effectiveness

SUMMARY

Little children spend a lot of their time in daycare centres while their parents are at
work. While the effect of poor indoor environmental quality (IEQ) in office buildings
has been vastly studied, very limited empirical studies on the effect of different
environmental factors in daycare centres is available. In this study, the indoor air
quality within baby cots of a Dutch daycare centre was studied in detail. Besides an
extensive literature survey, actual measurements were performed at a daycare
centre especially the effects of type and location of baby cots on the perceived indoor
environmental quality. Analysis of the results obtained from this study shows indoor
air quality levels in daycare centres requires more attention. The intention of this
research is to come forward with some guidelines based on the lessons learned.

INTRODUCTION

In the Netherlands, there is much attention on the Indoor Air Quality(IAQ) in
commercial buildings, however there is far less interest in the indoor air quality
conditions in daycare centres. A healthy environment is important for the
development of infants since they are a vulnerable target group. Children are more
vulnerable to airborne pollution due to the fact that their airways are narrower than
adults, they have markedly increased need for oxygen relative to their seize, they
breathe more rapidly and inhale more pollutants per pound of body weight (Etzel
1996). The body of a young child, and its immune system, is continuously under
development. Adverse conditions could influence this development (Ruotsalainen et
al. 1995).
In a typical Dutch daycare centre, children are at times present for just a couple of
hours or for the entire day and infants normally stay at the daycare centres often until
their fourth birthday. Though little is known about the effects of different indoor
environmental factors present in daycare centres (Daisey et al. 2003, Nafstad et al.
2004), and the quality of the buildings in which these daycare centres are located
(Ruotsalainen et al. 1993), considering the amount of time children spend in such
centres there is need for more attention.
In 2009 LBP-Sight, an independent consulting and engineering company with forty
years of experience in the field of construction, space and the environment
conducted a research in 60 Dutch daycare centres (Versteeg 2009). The research
was commissioned by the Dutch government and focused on air quality, daylight
access, sound and climate. The overall conclusion of the research was that the
indoor air quality in Dutch daycare centres was insufficient. This applied to both
common areas and bedrooms, with slightly better conditions in summer than in
winter. Table 1 provides an overview of international studies on IAQ in daycare
centres. As depicted in the table, in most cases between 20 up to 75% of all
measured daycare centres had CO 2 concentrations well above the recommended
level by ASHRAE (2007) standard of 1000 ppm.

Table 1. Overview of CO 2 concentrations in daycare centers from different studies
   Year    Location          Number      Average        SD CO 2     Reference
                                         CO 2 (ppm)
   1992    Canada            91             1505                    Danault et al
   1993    Finland           30              810           390      Routsalainen et al.
   2002    Midwest USA       26             1142           473      Ferng and Lee
   2007    Singapore         59 NV           466            72      Zuraimi et al.
   2007    Singapore         21 HBV          538           147      Zuraimi et al.
   2007    Singapore         5 ACMV          930           175      Zuraimi et al.
   2007    Singapore         19 AC          1163           575      Zuraimi et al.
   2009    Netherlands       60             1452                    Versteeg
   2010    Portugal          9              2137           368      Araújo-Martins
   2010    Portugal          11             1233           170      Araújo-Martins
   2011    Latvian           6               730           170      Stanvica and Lesinskis
   2011    Paris             28              933           100      Roda et al.
   2012    Montreal          21             1333           391      St-Jean et al.
   NV=Natural Ventilation, HBV=Hybrid Ventilation, AC=Air-Condition, MV= Mechanical Ventilation

In most studies the overall CO 2 level was measured in the group rooms and in some
also in the bedroom. In the study by Routsalainen et al. (1993) it was observed that
in multipurpose rooms (for general activities and nap), the nap-time average CO 2
level was about 60 ppm higher, compared to the non-nap time average CO 2 level. In
another study by Fern and Lee (2002) in Midwest US daycare centres, the authors
observed about 24.3% increment in CO 2 levels from non-nap time to nap-time in the
daycare centre’s bedrooms. In the research by Versteeg (2009), the authors also
observed higher average CO 2 concentration in the sleeping rooms when compared
to the group rooms: in summer 280 ppm and in winter 90 ppm. In the research of van
Rossenberg (2009) on 20 daycare centres in the Netherlands it was found that the
81% of the bedrooms had a CO 2 concentration higher than 1000 ppm and 31% had
an even unacceptable high CO 2 concentration, this compared to 71% and only 4%
for the activity rooms. Clearly more attention is needed for the bedrooms. This
research studies the influence of the type of baby-cot used and its location in the
room on the CO 2 concentration in the breathing zone of a sleeping infant in a child
daycare centres bedrooms. Using CO2 as metric for air quality was done to limit the
amount of measurement equipment in the baby cots Arguably CO 2 can in itself
represent poor air quality because of health impact, this being clear at high levels
addressed by occupational standards. Otherwise it may be used as an indicator of
inadequate ventilation and reflects poor removal of other pollutants. Therefore the
general room CO 2 should be kept below specific levels. The higher CO 2 in a semi
closed cot is not necessarily of concern because it reflects the child's in- and exhaled
air in this microenvironment. However, it also indicates other pollutants from the
space e.g. odour from nappies, fumes from mattress. These building up in this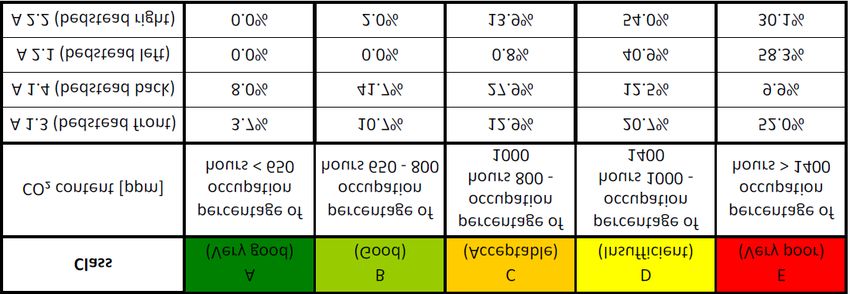
microenvironment is a situation to avoid. A field study was carried out in a daycare
centre in which measurements of the differences in CO 2 concentrations inside
different baby-cots.
CASE STUDY

The goal of this research was to determine if the type of baby-cot used in child
daycare centres influences the CO 2 concentration near a sleeping infant. To
determine the presence and impact of any such influences, measurements were
performed in different type of baby-cots.

Location
The study was conducted at a daycare centre built in 1968. Measurements were
taken in rooms with no windows but having a mechanical exhaust ventilation system.
Measurements took place in two different bedrooms intended for infants of different
ages, see Fig. 1 and 2.

Figure 1: Bedroom A(left) and bedroom B(right), ventilation supply grll in door,
exhaust outlet in ceiling

Figure 2: Plan of bedroom A(left) and bedroom B(right) for both the measured
different location of the baby cots in the rooms

The first bedroom (A) is used by children within the age bracket of 2-4. It
accommodates seven toddlers divided over two types of cots: 5 open beds and 2
bedsteads (cribs). The second bedroom (B) is used by children within the age
bracket of 10 weeks – 2 years. It accommodates 5 infants divided over three types of
cots: 2 bottom bunk beds, 2 top bunk beds and 1 bedstead. Both bedrooms have a
ventilation system with natural inlet (grating in the door) and mechanical outlet.
Further characteristics of both bedrooms are given in table 2.
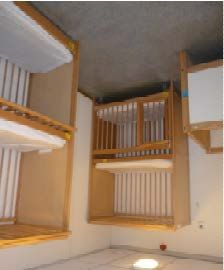
Table 2: Characteristics of the bedrooms
Location     Length (m) Width (m) Height (m) Capacity (-)       Ventilation rate (m³/h)
Bedroom A         3.3         3.3         2.7     7 infants         30.3
Bedroom B         3.3         2.5         2.7     5 infants         21.0

Description baby cots
Four types of baby cots were monitored inside the daycare centre, see Figure 3. Not
all baby cots were present in all bedrooms. The first type, a crib was only present in
bedroom A and was used for children in the age of 2-4 years who tend not to get out
of bed while sleeping. The second type, the bedstead, was used in both bedroom A
and bedroom B and was used by both new borns as well as children between the
age of 2-4 years. The last type of baby cot used in the daycare centre was the bunk
bed.

Figure 3: Crib (A.1 and A.2)   Bedstead (A.3 and A.4)           Bottom bunk bed (B.1
and B.2) Top bunk bed (B.3 and B.4)

Equipment
For measurement of the carbon dioxide concentration (CO 2 ), relative humidity and
temperature inside the bedrooms a EE80 sensor was used. The CO 2 sensors were
placed within the breathing zone of a sleeping infant which was defined as the range
for exhaled air of 0.3m around the head of a sleeping infant. The EE80 sensor is
used for indoor measurements and has a wide range for CO 2 -measurements (0 –
5000ppm). For the airflow measurement a flowfinder was used, see table 3.

Table 3: Measurements performed at the child daycare facility

    The measurements took place during spring, in the period from 26th of April till
21st of May and the second series in the period from January 29th till February 5th,
2014. The measurements inside the bedrooms were done separately and took at
least one week. This was to ensure that the influence of accidental events was
minimized. In each bedroom seven sensors were placed at different locations in the
room. Each sensor recorded the CO 2 -concentration, relative humidity and
temperature inside the room every 30 seconds. All the data generated during the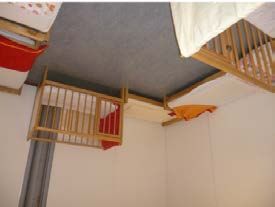
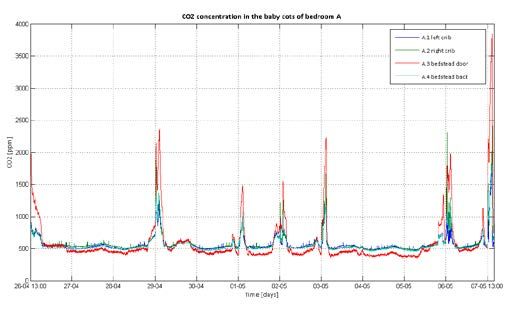
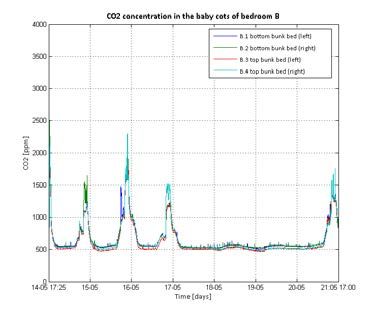
measurements were stored on a data logger from which the data was retrieved and
processed afterwards. During the measurements the nursery staffs were asked to
keep a log of children present inside the bedrooms. Each day record was taken of
the number of infants sleeping inside the bedroom and the duration.

RESULTS

Figure 4 & 5 depicts the obtained CO 2 concentrations in the baby cots in room A & B.

Figure 4: (A) General CO 2 -concentrations bedroom A and (B) CO 2 concentrations
specific baby cots A1, A2, A3 and A4

Figure 5: Detailed characteristic CO 2 concentrations of different baby cots in room A
and B during the sleeping period

(I)                                        (II)

Figure 6: Boxplot of CO 2 concentration in all baby cots during naptime – configuration
1 and 2 see Fig. 2.
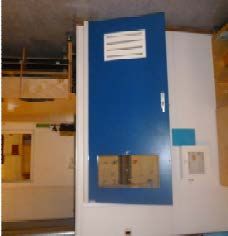
Figure 6 (I) depicts the CO 2 concentration inside the baby-cots of both bedrooms
during naptime in configuration 1. It is visible that the CO 2 concentration inside the
baby cots of bedroom B was generally higher than the concentrations in bedroom A
(the outlier of baby cot A.3 aside). The higher CO 2 concentrations in bedroom B
might be as a result of the higher levels of activity in the room. . Since the infants
sleeping in this bedroom all sleep at different times there is higher activity in this
bedroom since the daycare worker do have to lay the infants in and out of bed more
often than in bedroom A. In bedroom A the children often sleep at the same time, but
for a longer period of time.
     In figure 6 (II), the CO 2 concentrations during naptime are given for all types of
baby cots in configuration 2. What stands out first is the higher CO 2 concentrations
than the first measurement in configuration 1. As noted before, results are only
applicable for the given measurement period. Since this is a different measurement
period from first, a different result is expected. There is however some similarity
between the first and the second measurement period. In both periods the CO 2
concentrations in bedroom B was generally slightly higher than in bedroom A.
Another thing that is noticeable from figures 36(I) and 36(II) is that the bedsteads in
bedroom A has higher CO 2 concentrations than the cribs in both configurations. This
would imply that bedsteads have worse CO 2 concentration during naptime than cribs.
Table 4 gives the CO 2 distribution for the bedsteads in bedroom A during naptime for
both configurations. The Dutch building code describes a child daycare center as a
building with a meeting function. This results in a maximum CO 2 concentration of
1200ppm according to the Dutch building code 2012. With this concentration the
amount of oxygen in the air remains above the required 20.9%. However, the Dutch
Public Health Service (GGD) prescribes other CO 2 concentrations required for child
daycare centers. CO 2 concentrations lower than 800ppm are considered to be good,
lower than 650ppm are considered to be excellent.

Table 4: CO 2 distribution inside bedsteads bedroom A, configuration 1 & 2

The table shows that the CO 2 concentration inside the baby-cots in configuration 1
was most of the time acceptable. The outlier of this bedroom, baby cot A.3, has a
CO 2 concentration that is most of the time very poor. In configuration 2 the CO 2
concentrations was even higher than in configuration one. What is noticeable is that
bedsteads which are placed close to the entrance of the bedroom (A 1.3 and A 2.1)
have higher CO 2 concentrations than bedsteads which are placed at a distance from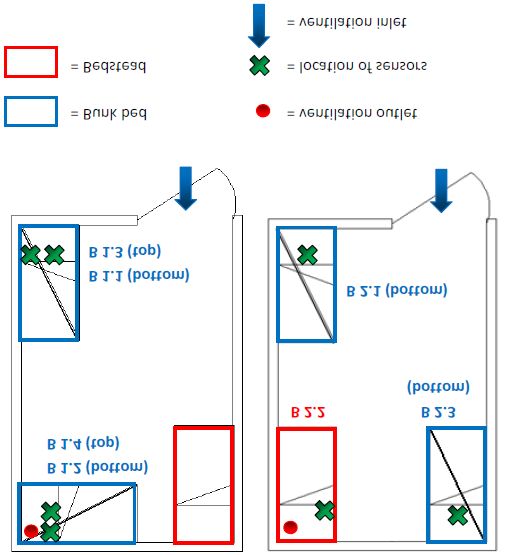
the entrance. This could be explained due to the fact that the baby cot is placed
directly next to the door/inlet ventilation. Since the ventilation air is coming directly
from the common area of the daycare facility and the activity at the door (daycare
workers moving in and out) is a lot higher, this could affect the results of this baby
cot.
Table 5 shows directly that during the second measurement period the CO 2
concentrations were much higher for a longer period of time. Also, in this table it is
visible that the location of the crib has an influence on the CO 2 concentration
measured inside the baby cot. Cribs A 1.1 and A 2.3 show significantly higher CO 2
concentrations than the other positions. Again, cribs placed near the entrance of the
bedroom give higher CO 2 concentrations than cribs placed in a distance from the
entrance.

Table 5: CO 2 –distribution inside cribs bedroom A, configuration 1 & 2
Percentage of houres CO 2
[ppm] concentration            1400

Table 6 gives the CO 2 distribution for bedroom B during naptime for both
configurations. In this table the differences between top and bottom bunk beds are
clearly visible. None of the beds have a good CO 2 concentration, but it is visible that
the bottom bunk beds have a worse CO 2 concentrations than top bunk beds. The
amount of time a bottom bunk bed has a poor CO 2 concentration is a lot higher than
with top bunk beds. This could be explained due to the fact that bottom bunk beds
can be considered as a volume which is opened only on the side, while top bunk
beds are open on the side and the top. In configuration 2 a bedstead is placed on the
location of bottom bunk bed B 1.2. The results of the second measurement make
clear that the CO 2 concentrations inside the bedstead aren’t any better than the CO 2
concentrations inside the bottom bunk beds.

Table 6: CO 2 distributions in bedroom B, configuration 1 and 2
Percentage of houres CO 2
[ppm] concentration         1400

CONCLUSIONS AND DISCUSSION

    The results from the detailed measurements of CO 2 concentrations within the
breathing zones of the babies showed quite a difference in results caused by the
location and the type of baby cot. It clearly shows the importance of these factors and
why it is not sufficient to just measure an overall CO 2 concentration as an indicator of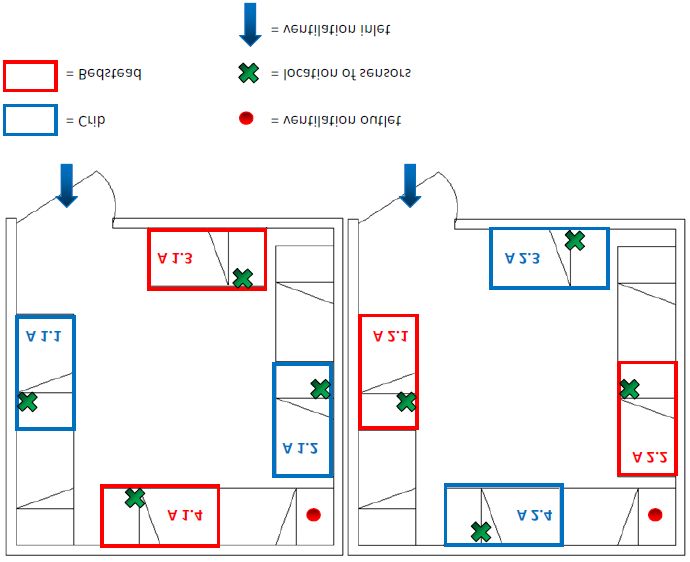
the Indoor Air Quality in daycare centres. From the measurements results, it can be
seen that unexpectedly changing circumstance also has a major impact on the
measured CO 2 concentrations within the bedroom of the case study daycare centre.
    Overall it can be concluded that a lot more attention is necessary for the
assessment of the indoor environmental quality in Dutch daycare centres. Especially
the effect of the type of baby cot and its location within the sleeping room is far more
important than is currently generally known.

REFERENCES

Araújo-Martins J., Carreiro Martins P., Viegas J., Aelenei D., Cano M.M., Teixeira J.P.,
   Paixão P., Papoila A.L., Leiria-Pinto P., Pedro C., Rosado-Pinto J., Annesi-Maesano I.,
   Neuparth N. (2014) Environment and Health in Children Day Care Centres (ENVIRH) –
   Study rationale and protocol, Revista Portuguessa de Pneumologia 20(60: 311-323
ASHRAE (2007) Standard 62-1-2007, Ventilation for acceptable indoor air quality
Daneault S., Beausoleil M., Messing K. (1992) Air Quality during winter in Quebec
   Daycare Centres, American Journal of Public Health 82(3): 432-434
Daisey J.M., Angell W.J., Apte M.G. (2003) Indoor air quality ventilation and health
   symptoms in schools: an analysis of existing information, Indoor Air 13: 53-64
Etzel R.A. (1996) Air pollution hazards to children, Otolaryngology – Head and Neck
   Surgery, February 1996
Ferng S.F., Lee L.W. (2002) Indoor air quality assessment of daycare facilities with
   carbon dioxide, temperature, and humidity as indicators, Journal of Environmental
   Health 65(4):14-18.
Nafstad P., Jaakkola J.J.K., Skrondal A., Magnus P. (2004) Day care centre
   characteristics and children’s respiratory health, Indoor Air 15: 69-75
Roda C., Barral S., Ravelomanantsoa H., Dusséaux M., Tribout M., Moullec Y. Le,
   Momas I. (2011) Assessment of indoor environment in Paris child day care
   centres, Environmental Research 111: 1010-1017
Rossenberg M. van (2009) Eindrapport Pilotproject ‘Frisse lucht op het
   Kinderdagverblijf’, Hulpverlening Gelderland Midden, Arnhem, juli 2009
Ruotsalainen R., Jaakkola N., Jaakkola J.J.K. (1993) Ventilation and indoor air
   quality in Finnish daycare centers., Environment International 18: 109-119
Ruotsalainen R., Jaakkola N., Jaakkola J.J.K. (1995) Dampness and molds in
   daycare centers as an occupational health problem, International archives of
   occupational and environmental health 66: 369-374
Stakevica G., Lesinskis A. (2011) Indoor Air Quality and Thermal Comfort in Latvian
   Daycare Centres, Scientific Journal of Riga Technical University
St-Jean M., St-Amand A., Gilbert N.L., Soto J.C., Guay M. (2012) Indoor air quality in
   Montreal daycare centres, Canada, Environmental Research 118:1-7
Tang J.W., Nicolle A.D., Klettner C.A., Pantelic J., Wang L.(2013) Airflow Dynamics
   of Human Jets: Sneezing and Breathing - Potential Sources of Infectious
   Aerosols. PLoS ONE 8(4): e59970. doi:10.1371/journal.pone.0059970
Versteeg H., 2009, Onderzoek binnenmilieu kindercentra, LBP|Lichtveld Buis &
   Partners
Zurami M.S., Thom K.W., Chew F.T., Ooi P.L. (2007) The effect of ventilation
   strategies of child care centres on indoor air quality and respiratory health of
   children in Singapore, Indoor Air 17: 317-327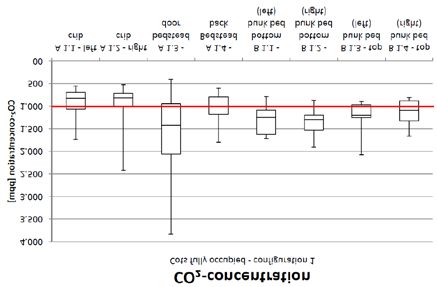
You can also read