The Effects of Creatine Supplementation on Muscular Strength and Endurance in Mice
←
→
Page content transcription
If your browser does not render page correctly, please read the page content below
Proceedings of The National Conference
                                                                                On Undergraduate Research (NCUR) 2015
                                                                              Eastern Washington University, Cheney, WA
                                                                                                        April 16-18, 2015

        The Effects of Creatine Supplementation on Muscular Strength and
                                Endurance in Mice

               David Howden, Craig Boekenoogen, Jared Wagoner, Shaina Miller, and
                                    Bertha Mendez-Guajardo
                                   Health Science Department
                                       Corban University
                                   Salem, Oregon 97302 USA

                                     Faculty Advisor: Dr. Sarah Comstock

                                                      Abstract

Muscle contraction depends upon the hydrolysis of adenosine triphosphate (ATP), which releases free energy when a
phosphate bond is broken. Three systems function to supply energy in the form of ATP to muscle – the phosphagen
system, glycolysis and mitochondrial respiration. During exercise, the phosphagen system is capable of supplying
ATP for about 10 – 30 seconds before the muscle cells must revert to glycolysis as a source of ATP. The purpose of
this study was to investigate the phosphagen system and particularly the role that creatine phosphate (CrP) plays in
supplying energy in the form of an inorganic phosphate (Pi) to animals supplemented with excess creatine. Creatine
kinase, which enables the hydrolysis of phosphocreatine, to produce ATP and creatine, also serves to reverse this
reaction by hydrolyzing ATP to produce ADP and phosphocreatine once again. By supplementing with creatine,
athletes aim to saturate their muscles in order to increase the production of phosphocreatine through the reversed
reaction. In order to mimic the effects of creatine supplementation in athletes, creatine was administered to mice for
12 weeks. These animals had free access to running wheels. To assess the effects of creatine supplementation,
measurements of force generation, endurance, activity, muscle mass and muscle creatine kinase (CK) levels were
taken. This study found that creatine supplementation lead to a significant increase in force generated during a grip
test, but did not affect the endurance or overall activity of the mice. In addition, soleus muscle mass was significantly
increased, while gastrocnemius muscle mass was not affected. Further investigation of the effect of creatine
supplementation on CK protein levels through Western blot analysis found a trend (p = 0.10) toward increased CK in
the gastrocnemius of creatine supplemented animals. Western blot results suggest that grip strength was enhanced
due to increased availability of phosphates in Type II muscle fibers, which are more predominant in gastrocnemius
versus soleus muscle. In comparison, Type I fibers are more predominant in the soleus than the gastrocnemius. Since
endurance is mostly mediated by Type 1 fibers which have lower creatine content and decreased CK activity, this is
likely why the experimental results did not demonstrate an effect on endurance in the creatine supplemented animals.

Keywords: Creatine phosphate, Muscle strength, Phosphagen energy system

1. Introduction

Muscle contraction depends upon the breakdown of ATP which releases free energy when a phosphate bond is broken.
The hydrolysis of ATP allows for binding and release of actin and myosin proteins within the sarcomere. Three
systems function to provide energy, in the form of ATP, to muscle – the phosphagen system, glycolysis and
mitochondrial respiration.1 During exercise, the phosphagen system is capable of supplying ATP for about 10 – 30
seconds before the muscle cells must revert to glycolysis as a source of ATP. Glycolytic stores of ATP are exhausted
in minutes and finally the muscle reverts to cellular respiration to continuously replenish exhausted stores of ATP.2
The purpose of this study was to investigate the phosphagen system and particularly the role that creatine phosphate
(CrP) plays in supplying energy in the form of an inorganic phosphate (Pi) to animals supplemented with excess
creatine.
Creatine is a naturally occurring substance that is synthesized primarily in the kidneys and liver from the amino
acids L-arginine, glycine, and L-methionine.3,4 Most of the creatine in the human body is found in skeletal muscle.
The typical human will ingest approximately 2 grams of creatine per day, primarily from the consumption of meat.5,6
Creatine is commonly used to supplement weight training and performance training. It is commonly believed that
those who supplement their diet by increasing creatine consumption will gain lean muscle mass and increase muscle
force generation, because of the role that creatine plays in the phosphagen energy system.7 Creatine phosphate, which
is found at high concentrations in muscle both at rest and during contraction, supplies a phosphate group to form ATP
from ADP, according to the abbreviated equation (equation 1):
CrP + ADP + H+ ATP + Cr (1)
Creatine kinase, which enables the hydrolysis of phosphocreatine to produce ATP and creatine, also serves to reverse
this reaction and hydrolyzes ATP to produce ADP and phosphocreatine once again.8,9 Conflicting evidence indicates
that the source of Pi for the reversed reaction (CrP resynthesis) comes from glycolysis, oxidative metabolism, or
both.10,11 By supplementing with creatine, athletes aim to saturate their muscles in order to increase the production of
phosphocreatine through the reversed reaction.12 In order to mimic the effects of creatine supplementation in athletes,
creatine was administered to mice with access to running wheels. The effect on force generation, endurance, activity
and creatine kinase levels were then measured. The study tested the hypothesis that creatine supplementation would
increase the maximum force generated by the mice during a grip test, but decrease their endurance.
2. Materials and Methods
2.1 Animals
Male mice were obtained from a local breeder (RMB, Scotts Mills, Oregon) at approximately 6 weeks of age. Mice
were acclimated for 3 weeks in individual cages and maintained on a 12 hour light/dark cycle with ad libitum access
to food (Mazuri Rodent Diet, catalog #5663) and water. At approximately 9 weeks of age mice were weight matched
and distributed into a control group (n = 5) or a creatine supplemented group (n = 5) that supplied a supersaturating
dose of 120 mg/Kg/day to the animals. Mice were maintained on these respective diets for 3 months during which
time they were weighed weekly and food and water intake was measured. Mice had free access to running wheels
within their cages.
2.2 Creatine Diet Production
Food intake and body weight was measured weekly for the first two weeks of the acclimation period. A dose of 60
mg/Kg/day is sufficient to supersaturate mice.7,12,13 Therefore a diet was selected to supply 120 mg/Kg/day based upon
food intake and body weight averages of the first two weeks. After each month on the diet, new food was made and
creatine dosing was recalculated based upon the average food intake and weights of the mice. In order to make the
diet, the food was ground, creatine was added, eggs were used as a binding agent and it was baked at 177° C (350° F)
for 25 minutes. For the control diet, the creatine was omitted.
2.3 Grip Strength, Energy Expenditure And Endurance
In order to estimate forelimb grip strength, a simple apparatus was set up using a force transducer. A Styrofoam block
and wire mesh were secured together and the block was tied to the force transducer. The mouse was grasped by the
tail and lowered unto the block. The mouse was pulled slightly backwards by the tail while both paws (forelimbs)
grasped the block, which triggered a “counter pull.” The grip strength meter recorded the grasping force in Newtons.
482In order to estimate average energy expenditure, animals were allowed free access to running wheels. During the
tenth week of the study, the wheels were equipped with a photogate (Vernier, Catalog # VPG-BTD) and running
distance and average speed were measured throughout a 24 hour period.
At the end of 10 weeks of creatine consumption, the mice underwent a weighted forced swim test in order to test the
difference in endurance between animals. The mice were set into a 30 gallon aquarium filled with water at
approximately 25 οC. Four percent (4%) of each mouse’s bodyweight was attached their tail. The weight applied a
consistent downward pull on the swimming mice. The exhaustive swimming time was used as the index of exercise
endurance. Exhaustion was defined as the time when mice could not keep their head above water for more than 3
seconds. This is a commonly used test to measure endurance and fatigue in mice.14–16
2.4 Intraperitoneal Glucose Tolerance Test
After 12 weeks on the diet, at approximately 21 weeks of age, mice were fasted for 16 hours and then an intraperitoneal
glucose tolerance test (IPGTT) was performed. A baseline fasting glucose level was measured from tail vein blood
using a handheld glucometer (True Result, Nipro Diagnostics). After baseline measurements, mice received an
intraperitoneal injection of dextrose based upon their body weight (2.5 mg/g). Blood glucose was measured again at
10, 20, 30 and 60 minutes post injection.17
2.5 Tissue Collection
At the end of the study, mice were sedated using concentrated carbon dioxide gas and then immediately decapitated
for blood collection and euthanasia. Gastrocnemius and soleus skeletal muscle and retroperitoneal white adipose tissue
(RWAT) pads were dissected, weighed and frozen at -20° C for later analysis.
2.6 Protein Isolation And Western Blotting
Gastrocnemius and soleus muscle were separately ground in Radioimmunoprecipitation assay (RIPA) Buffer (Sigma
Aldrich, catalog # R0278) with protease inhibitors (Sigma Aldrich, catalog # P8340). Protein was quantified using the
Bradford detection method.18 To detect levels of muscle creatine kinase (CKM), 20 ug of whole muscle protein from
each animal was ran on a pre-cast 12% SDS Page Gel using Expedeon’s RunBlue Run & Blot System (NXE00002).
The protein was then transferred to a nitrocellulose membrane. The membrane was removed and blocked with 5%
milk in Tris Buffered Saline with 0.1% Tween-20 (TBST), then incubated with a primary polyclonal goat anti-CKM
antibody (Santa Cruz Biotechnology, catalog # sc-15161) in TBST overnight at 4° C. After incubation with the primary
antibody, the membrane was rinsed repeatedly with TBST and then incubated with a secondary donkey anti-goat
horseradish peroxidase (HRP) conjugated polyclonal antibody (Santa Cruz Biotechnology, catalog # sc-2020). To
visualize the protein, a chloronaphthol and diaminobenzidine (CN/DAB) kit was used from Pierce Biotechnology
(catalog # 34000) that allows for chromogenic detection of proteins by forming a black precipitate in the presence of
HRP. The image was scanned and analyzed using the open source software ImageJ (available from the National
Institutes of Health) to determine and compare the intensity of the CKM band for each animal.
2.7 Analysis And Statistics
All results were analyzed using SPSS (IBM). Results were tested for heteronormativity and then t-tests were
performed to determine if statistical differences between the control and creatine supplemented group existed.
3. Results
3.1 Body Composition
Over the 115 days of testing, the mice’s bodyweight was measured weekly; there was no significant difference
between bodyweights (p = 0.14). At the end of testing the mice’s soleus and gastrocnemius skeletal muscle,
retroperitineal and epididymal white adipose tissue (RWAT and EWAT) were extracted and weighed. Results are
483included in Table 1, which includes averaged mass for each category with standard error in parenthesis and an (*)
indicates a significant difference between the control and creatine group.
Table 1. Comparison Of Mouse Body Composition
Group Body Mass (g) Soleus (mg) Gastroc (mg) EWAT (mg) RWAT (mg)
Control 43.57 (2.05) 71.17 (9.32) 155.14 (11.68) 428.88 (40.59) 104.59 (35.10)
Creatine 41.45 (1.29) 159.62 (52.42)* 132.73 (5.40) 343.56 (32.29) 49.32 (7.90)
There was no significant difference between Control and Creatine RWAT and EWAT (both p = 0.12) even when
normalized to body weight (p=0.14 and p = 0.20). Isolated muscles were also measured and gastrocnemius was not
significantly affected (p = 0.11) even when compared to overall bodyweight (p = 0.28). However, soleus skeletal
muscle was significantly elevated in the Creatine animals (p = 0.002) and remained elevated when compared to body
weight (p = 0.002) (Figure 1).
160
Average soleus mass/body mass
140
120
100
80
60
40
20
0
Control Creatine
Group
Figure 1. Average Mass Of Soleus Skeletal Muscle When Normalized To Body Mass
Soleus skeletal muscle mass normalized to body mass is significantly higher in creatine supplemented animals when
compared to the control animals.
3.2 Intraperitoneal Glucose Tolerance Test
Creatine supplementation has been shown to increase muscle glucose transporters (GLUT4) and, in conjunction with
protein supplementation, has been shown to improve glucose tolerance. 19 GLUT4 brings glucose into the muscle cell
from circulation and suggested that if creatine supplementation up-regulates this transporter, circulating glucose would
be lower and would be cleared more quickly. Fasting baseline glucose in the Control mice was 82 mg/dL (+/- 8.3) and
68 mg/dL (+/1 9.8) in the Creatine, yet this was not significant (p = 0.19). An IPGTT was also performed on all mice
and found that creatine supplementation caused decreased glucose clearance. Since there was no measurement of
484muscle GLUT4 or insulin in response to the IPGTT, there is no conclusive evidence showing the mechanism which
creatine mice appear to be more glucose intolerant.
Few studies have looked at the effect of creatine supplementation on glucose metabolism and most have only
measured the affects after short term administration.7,12,13,19 However long term administration has been shown to have
detrimental effects on insulin release from the pancreas and this may be the reason that glucose clearance was
impaired.20
3.3 Strength, Energy Expenditure And Endurance Testing
The force generated during a grip test was compared to body mass. The control mice exerted an average ratio of 33.6
N/mg, while Creatine mice exerted 52.2 N/mg (Figure 2, Table 2). The difference was significant (p = 0.02). Based
upon the mechanism of action of creatine, it was hypothesized that creatine mice had more ATP available to supply
energy for the 30 second contraction because the phosphagen system supplied the ATP to the muscles allowing for a
more powerfully sustained contraction. The increased ATP from the phosphagen system was supplied by the high
concentrations in creatine.
70
60
Force/mass of mouse (N/g)
50
40
30
20
10
0
Control Creatine
Group
Figure 2. Force Exerted During Grip Test
Creatine mice exerted significantly more force during a grip test as compared to body weight than the control mice.
Mice had free access to running wheels in their cages. The distance ran by the mice was measured during a 24 hour
period. While creatine mice ran slightly more than the controls, this was not significant (p = 0.43). The mice’s activity
was measured each hour individually, with the maximal activity within one hour evaluated as an indicator of intensity
of exercise. Creatine mice had a lower maximal activity, again not significant (p = 0.31), indicating that creatine
consumption does not lead to increased energy expenditure in the mice (Table 2).
During the forced swim test, control mice lasted an average of 9:56 minutes, while creatine mice lasted an average
of 13:56 minutes (Table 2). There was no significant difference between the two groups (p = 0.24). The creatine mice
did not have significantly less endurance as hypothesized. It is possible that the phospagen system, that creatine is
associated with, is primarily supplying ATP to contractions within the first 30 seconds of exercise. After this time,
ATP production will transition to primarily glycolysis and mitochondrial respiration. Glycolysis and mitochondrial
respiration have not been shown to be affected by high creatine concentrations. Since the endurance test measured the
mice’s muscle contractions over a longer time period, these were not likely as affected by the phosphagen system.
485Results of the strength, activity and endurance tests are included in Table 2, which includes averaged values for each
category with standard error in parenthesis and an (*) indicates a significant difference between the control and
creatine group.
Table 2. Strength, Energy Expenditure (Activity) And Endurance
Max Activity
Group Grip (N/mg) 24hr Activity (Km) Endurance(min)
(Km/hour)
Control 33.6 (4.11) 11.9 (3.12) 2.60 (0.84) 9:56 (3:06)
Creatine 52.2 (13.99) * 13.0 (4.99) 2.07 (0.46) 13:11 (4:12)
3.4 Skeletal Muscle Creatine Kinase (CK):
CK reversibly catalyzes the addition of a phosphate group to creatine to make phosphocreatine (PCr) by hydrolyzing
ATP into ADP and Pi.1 The mouse gastrocnemius skeletal muscle is composed of about 1% Type I (slow twitch)
muscle and 99% Type II (fast twitch) muscle; whereas the soleus has about 42% Type I and 58 % Type II.21 There
was an investigation of the total CK content of each of these muscle types to determine how creatine supplementation
may have affected this enzyme. While it was not significant, CK in gastrocnemius was increased by about 40% (p =
0.10) and soleus CK was not affected. When the ratio of gastrocnemius to soleus CK from the same animal was
analyzed, it remained elevated, even though it was not significant (p = 0.14). While the results are still preliminary,
this suggests that creatine supplementation may lead to increased CK in Type II, over Type I skeletal muscle and this
is a key area this study is aiming to pursue for future research.
2.0
Cont…
Crea…
(Normalized to Control)
1.5
Relative Intesntiy
1.0
0.5
0.0
Soleus Gastroc Ratio
Muscle Type
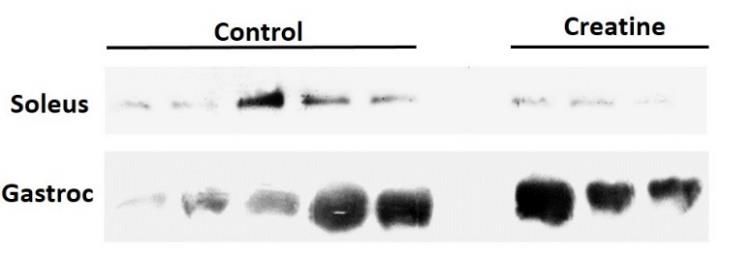
Figure 3. Western Blotting For Creatine Kinase In Skeletal Muscle
Creatine kinase is elevated in the gastrocnemius skeletal muscle samples from creatine animals when compared to the
controls. The top graph represents the values; the bottom figure is a picture taken on ImageJ (NIH) of the western blot.
4864. Discussion
4.1 Gastrocnemius And Soleus Skeletal Muscle
The soleus muscle was significantly larger in the creatine mice, while the gastrocnemius was not significantly
different. However, upon investigation of the level of CK in these two muscle types, gastrocnemius CK was increased
by about 40% and soleus CK did not appear to be affected. The gastrocnemius is composed of nearly all Type II (fast
twitch) fibers whereas soleus has about 42% Type I (slow twitch) fibers, which indicates that Creatine supplementation
may lead to more robust activation of CK in Type II fibers. In fact, research by other investigators has demonstrated
that CK is more active in Type II fibers.22,23 In order to determine the precise distribution and expression of CK in
these mice immunohistochemical colocalization of CK and specific markers for each muscle type needs to be
performed. However, while CK activity may be increased in the gastrocnemius muscle, this does not explain why
soleus muscle mass was increased in those animals supplemented with creatine. Further investigation is necessary to
determine the reason for this increase.
4.2 Glucose Tolerance Test:
While short term creatine supplementation can lead to significant improvements in the maximal force a muscle can
exert, it should be noted that in this study and in studies performed in other labs, it has been shown to be harmful to
the pancreas.24These mice were supplemented with creatine for nearly 4 months. In the future, experimental protocol
plans to be adjusted to administer creatine for 1 month and compare the effects to long term administration. There are
also plans to isolate the pancreas from these animals to determine how pancreatic cells might be affected by creatine
supplementation.
4.3 Strength, Energy Expenditure And Endurance Testing
The creatine mice generated significantly more force than the control mice, which supported the hypothesis that these
mice would be able to increase their maximum force generated. The phosphagen system is the predominant supplier
of energy for short term muscle contractions. Since these mice were tested for 30 seconds, phosphocreatine likely
supplied the majority of the energy for these contractions. It is suspected that higher concentrations of creatine in
muscle fibers enhanced the available energy during the phosphagen phase, most likely in type II muscle fibers.
Therefore, it is hypothesized that supplementation of creatine enhances short term muscular performance through the
enhancement of the phosphagen cycle in Type II muscle. However, further tests and larger sample sizes are needed to
make any conclusive determinations.
There was no significant effect of creatine supplementation on activity levels or endurance in the mice. While the
original hypothesis stated that creatine supplementation would lead to decreased endurance, the hypothesis was not
supported by the results. This is likely due to the nature of the muscles that are involved in endurance. Type I (slow
twitch) muscles are the primary muscle cell type used for endurance; they derive most of their energy from glycolysis
or mitochondrial oxidation and have lower CK activity when compared to Type II muscle fibers. Since the intervention
(creatine supplementation) should have most of its effect on Type II fibers, it is not surprising that endurance and
activity were not affected.
5. Conclusion
Through the supplementation of mice with creatine this experimental protocol demonstrated how an enhancement of
the phosphagen energy system leads to a significant effect on muscular force generated. Based upon the results of the
Western blotting study, it is suggested that this enhancement occurred due to increased availability of phosphates in
Type II muscle fibers. However, since endurance is mostly mediated by Type I fibers which have lower creatine
content and decreased CK activity there was no difference between control and creatine mice in their endurance test.
In future studies the aim will be to isolate muscle fiber types and determine the effect of creatine supplementation on
each. Likewise, there is an interest in examining the differences in CK isoforms in response to supplementation.
487Finally, there are plans to investigate the water retention of the various muscle types to determine if this might be a
factor that is leading to increased muscle mass.
5. Acknowledgements
The authors wish to express their appreciation to Corban University, the Health Science Department at Corban
University, Professor John Bell, Dr. James Dyer and Raychel Kim for their assistance.
6. References Cited
1. Baker, J. S., McCormick, M. C. & Robergs, R. A. Interaction among Skeletal Muscle Metabolic Energy
Systems during Intense Exercise. J. Nutr. Metab. 2010, 1–13 (2010).
2. Wells, G. D., Selvadurai, H. & Tein, I. Bioenergetic provision of energy for muscular activity. Paediatr.
Respir. Rev. 10, 83–90 (2009).
3. Da Silva, R. P., Nissim, I., Brosnan, M. E. & Brosnan, J. T. Creatine synthesis: hepatic metabolism of
guanidinoacetate and creatine in the rat in vitro and in vivo. AJP Endocrinol. Metab. 296, E256–E261 (2008).
4. Da Silva, R. P., Clow, K., Brosnan, J. T. & Brosnan, M. E. Synthesis of guanidinoacetate and creatine from
amino acids by rat pancreas. Br. J. Nutr. 111, 571–577 (2014).
5. Creatine. (US National Library of Medicine, 2015). at
6. Demant, T. W. & Rhodes, E. C. Effects of creatine supplementation on exercise performance. Sports Med.
Auckl. NZ 28, 49–60 (1999).
7. Candow, D. G., Vogt, E., Johannsmeyer, S., Forbes, S. C. & Farthing, J. P. Strategic creatine
supplementation and resistance training in healthy older adults. Appl. Physiol. Nutr. Metab. Physiol. Appl. Nutr.
Metab. 1–6 (2015). doi:10.1139/apnm-2014-0498
8. Wallimann, T., Tokarska-Schlattner, M. & Schlattner, U. The creatine kinase system and pleiotropic effects
of creatine. Amino Acids 40, 1271–1296 (2011).
9. McMahon, S. & Jenkins, D. Factors affecting the rate of phosphocreatine resynthesis following intense
exercise. Sports Med. Auckl. NZ 32, 761–784 (2002).
10. Harris, R. C. et al. The time course of phosphorylcreatine resynthesis during recovery of the quadriceps
muscle in man. Pflugers Arch. 367, 137–142 (1976).
11. Quistorff, B., Johansen, L. & Sahlin, K. Absence of phosphocreatine resynthesis in human calf muscle
during ischaemic recovery. Biochem. J. 291 ( Pt 3), 681–686 (1993).
12. Harris, R. C., Söderlund, K. & Hultman, E. Elevation of creatine in resting and exercised muscle of normal
subjects by creatine supplementation. Clin. Sci. Lond. Engl. 1979 83, 367–374 (1992).
13. Hultman, E., Söderlund, K., Timmons, J. A., Cederblad, G. & Greenhaff, P. L. Muscle creatine loading in
men. J. Appl. Physiol. Bethesda Md 1985 81, 232–237 (1996).
14. Qi, B., Ouyang, J., Huang, H., Zhang, L. & Zhang, Z. Effects of ginsenosides-Rb 1 on exercise-induced
oxidative stress in forced swimming mice. Pharmacogn. Mag. 10, 458 (2014).
15. Zhang, X.-L. et al. Anti-Fatigue Activity of Extracts of Stem Bark from Acanthopanax senticosus.
Molecules 16, 28–37 (2010).
16. Ni, W. et al. Anti-fatigue activity of polysaccharides from the fruits of four Tibetan plateau indigenous
medicinal plants. J. Ethnopharmacol. 150, 529–535 (2013).
17. Rozman, J. et al. Glucose tolerance tests for systematic screening of glucose homeostasis in mice. Curr.
Protoc. Mouse Biol. 5, 65–84 (2015).
18. Bradford, M. M. A rapid and sensitive method for the quantitation of microgram quantities of protein
utilizing the principle of protein-dye binding. Anal. Biochem. 72, 248–254 (1976).
19. Derave, W. et al. Combined creatine and protein supplementation in conjunction with resistance training
promotes muscle GLUT-4 content and glucose tolerance in humans. J. Appl. Physiol. Bethesda Md 1985 94, 1910–
1916 (2003).
20. Ferrannini, E. & Mari, A. How to measure insulin sensitivity. J. Hypertens. 16, 895–906 (1998).
21. Valeria Augusto, Carlos Roberto Padovani, Gerson Eduardo Rocha Campos. Skeletal Muscle Fiber Type in
C57BL6J Mice. Braz. J. Morphol. Sci. 21, 89–94 (2004).
48822. Jansson, E. & Sylvén, C. Creatine kinase MB and citrate synthase in type I and type II muscle fibres in
trained and untrained men. Eur. J. Appl. Physiol. 54, 207–209 (1985).
23. Sherwin, A. L., Karpati, G. & Bulcke, J. A. Immunohistochemical localization of creatine phosphokinase in
skeletal muscle. Proc. Natl. Acad. Sci. U. S. A. 64, 171–175 (1969).
24. Rooney, K. et al. Creatine supplementation alters insulin secretion and glucose homeostasis in vivo.
Metabolism. 51, 518–522 (2002).
489You can also read