The EU Butterfly Indicator for Grassland species: 1990-2017 - Technical report - European Butterfly ...
←
→
Page content transcription
If your browser does not render page correctly, please read the page content below
The EU Butterfly Indicator for
Grassland species: 1990-2017
Technical report

              Butterfly Conservation Europe 2019 | THE EU BUTTERFLY INDICATOR FOR GRASSLAND
              SPECIES 1990-2017 1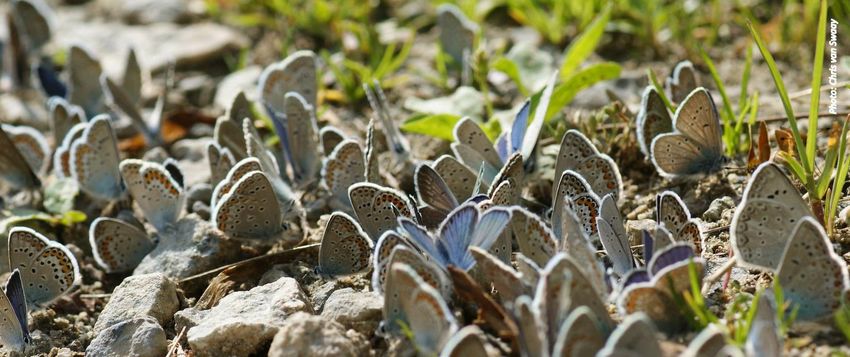
The EU Butterfly Indicator for
Grassland species: 1990-2017
Technical report

              Butterfly Conservation Europe 2019 | THE EU BUTTERFLY INDICATOR FOR GRASSLAND
              SPECIES 1990-2017 2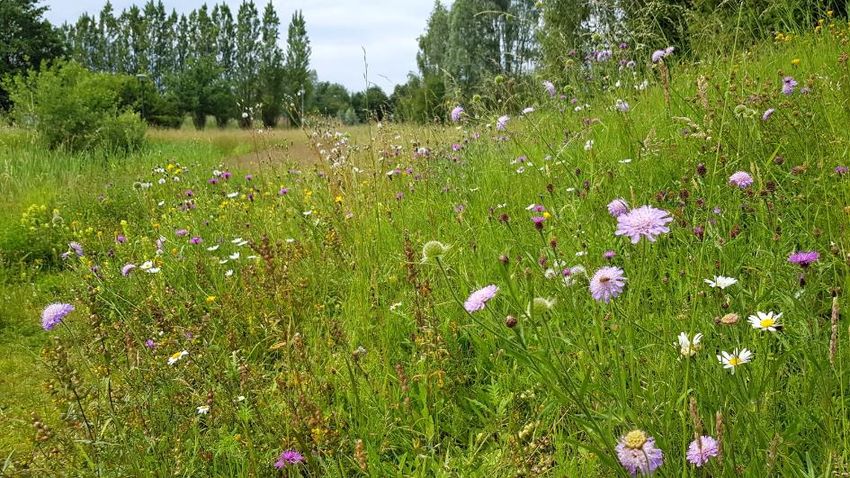
The EU Butterfly Indicator for Grassland species: 1990-2017
Technical report

Van Swaay, C.A.M.1, 2, Dennis, E.B.3, Schmucki, R.4, Sevilleja, C.1,2, Balalaikins, M.5, Botham, M.4,
Bourn, N.3, Brereton, T.3, Cancela, J.P.6, Carlisle, B.7, Chambers, P.8, Collins, S.1, Dopagne, C.9, Escobés,
R.10, Feldmann, R.11, Fernández-García, J. M.12, Fontaine, B.13, Gracianteparaluceta, A.12, Harrower,
C.4, Harpke, A.11, Heliölä, J.14, Komac, B.15, Kühn, E.11, Lang, A.16, Maes, D.17, Mestdagh, X.18,
Middlebrook, I.3, Monasterio, Y.10, Munguira, M.L.6,1, Murray, T.E.19, Musche, M.11, Õunap, E.20,
Paramo, F.21, Pettersson, L.B.22, Piqueray, J.23, Settele, J.11, Stefanescu, C.21, Švitra, G.24, Tiitsaar, A.25,
Verovnik, R.26, Warren, M.S.1, Wynhoff, I.1,2 & Roy, D.B.4 (2019). The EU Butterfly Indicator for
Grassland species: 1990-2017: Technical Report. Butterfly Conservation Europe.

1 Butterfly Conservation Europe
2 De Vlinderstichting/Dutch Butterfly Conservation, Wageningen, Netherlands
3 Butterfly Conservation, East Lulworth, Dorset, United Kingdom

4 Centre for Ecology & Hydrology, Wallingford, United Kingdom

5 Institute of Life Sciences and Technology, Daugavpils University, Daugavpils, Latvia

6 Universidad Autónoma de Madrid, Spain

7 Fundatia ADEPT Transilvania, Romania

8 Paul Chambers, Jersey, Channel Islands

9 Natagriwal asbl, Gembloux, Belgium

10 ZERYNTHIA Society, Spain

11 Helmholtz Centre for Environmental Research - UFZ, Leipzig, Germany

12 Hazi Foundation, Spain

13 Muséum National d'Histoire Naturelle, Paris, France

14 Finnish Environment Institute, Natural Environment Centre, Helsinki, Finland

15 Centre d'Estudis de la Neu i de la Muntanya d'Andorra (CENMA), Andorra

16 Büro Lang, Germany

17 Research Institute for Nature and Forest (INBO), Brussels, Belgium

18 Luxembourg Institute of Science and Technology, Belvaux, Luxembourg

19 National Biodiversity Data Centre, Carriganore, Co. Waterford, Ireland

20 University of Tartu, Estonia

21 Butterfly Monitoring Scheme, Museu de Ciències Naturals de Granollers, Spain

22 Swedish Butterfly Monitoring Scheme, University of Lund, Lund, Sweden

23 Natagriwal asbl, Gembloux, Belgium

24 Ukmerge, Lithuania

25 University of Tartu, Estonia

26 University of Ljubljana, Ljubljana, Slovenia

Butterfly Conservation Europe 2019 | THE EU BUTTERFLY INDICATOR FOR GRASSLAND SPECIES 1990-2017                3
Indicator source
EEA, Butterfly Conservation Europe, European Butterfly Monitoring Scheme partnership, Assessing
Butterflies in Europe (ABLE) project (van Swaay et al., 2019)

Citation
Van Swaay, C.A.M., Dennis, E.B., Schmucki, R., Sevilleja, C.G., Balalaikins, M., Botham, M., Bourn, N.,
Brereton, T., Cancela, J.P., Carlisle, B., Chambers, P., Collins, S., Dopagne, C., Escobés, R., Feldmann,
R., Fernández-García, J. M., Fontaine, B., Gracianteparaluceta, A., Harrower, C., Harpke, A., Heliölä, J.,
Komac, B., Kühn, E., Lang, A., Maes, D., Mestdagh, X., Middlebrook, I., Monasterio, Y., Munguira,
M.L., Murray, T.E., Musche, M., Õunap, E., Paramo, F., Pettersson, L.B,, Piqueray, J., Settele, J.,
Stefanescu, C., Švitra, G., Tiitsaar, A., Verovnik, R., Warren, M.S., Wynhoff, I. & Roy, D.B. (2019). The
EU Butterfly Indicator for Grassland species: 1990-2017: Technical Report. Butterfly Conservation
Europe & ABLE/eBMS (www.butterfly-monitoring.net)

Keywords
Butterfly, Monitoring, Trend, Index, Europe, European Union, Indicator, Biodiversity

June 2019

Butterfly Conservation Europe 2019 | THE EU BUTTERFLY INDICATOR FOR GRASSLAND SPECIES 1990-2017          4
Acknowledgements:
We thank the European Union for funding the ABLE EU Parliamentary Pilot project via a service
contract with DG Environment (Contract no. 07.027742/2018/790285/SER/ENV.D.W).

The European Butterfly Monitoring Scheme (eBMS) is indebted to the constituent National Butterfly
Monitoring Schemes, their funders and all volunteers who contribute data. At the time of producing
this report, the eBMS is a partnership of the following organisations: the Natural Environment
Research Council (acting through the Centre for Ecology & Hydrology), Butterfly Conservation UK,
Helmholtz-Zentrum für Umweltforschung GmbH – UFZ, De Vlinderstichting, Catalonia BMS, Finnish
Environment Institute (SYKE), Butterfly Conservation Europe (BCE), Research Institute Nature and
Forest (INBO), Muséum National d'Histoire Naturelle (MNHN) CNRS-UPMC, Lund University, National
Biodiversity Data Centre (NBDC) Ireland, Luxembourg Institute of Science and Technology (LIST),
Zerynthia Association and Facultad de Ciencias de la Universidad Autónoma de Madrid.

The UK Butterfly Monitoring Scheme is organized and funded by Butterfly Conservation, the Centre
for Ecology and Hydrology, British Trust for Ornithology, and the Joint Nature Conservation
Committee. The UKBMS is indebted to all volunteers who contribute data to the scheme.

Jacqueline Loos, Mikael Molander and Lászlo Rákosy were important contributors the Romanian part
of the AMIGA project.

The ZERYNTHIA Butterfly Monitoring Scheme is supported by the Basque Country Government,
Cantabria Government and Valle de Aranguren Council (Navarre).

The Dutch BMS is a co-operation between Dutch Butterfly Conservation and Statistics Netherlands
(CBS), part of the Network Ecological Monitoring (NEM) and financed by the Ministry of Agriculture,
Nature and Food Quality (LNV).

The Nature Conservation Agency of Latvia was kind to supply the Latvian data.

The Irish Butterfly Monitoring Scheme is funded by the Heritage Council and the Department of
Culture, Heritage and the Gaeltacht.

The German BMS is a cooperation between the Helmholtz Centre for Environmental Research - UFZ,
German Butterfly Conservation (GfS) and science4you.

Butterfly Conservation Europe 2019 | THE EU BUTTERFLY INDICATOR FOR GRASSLAND SPECIES 1990-2017       5
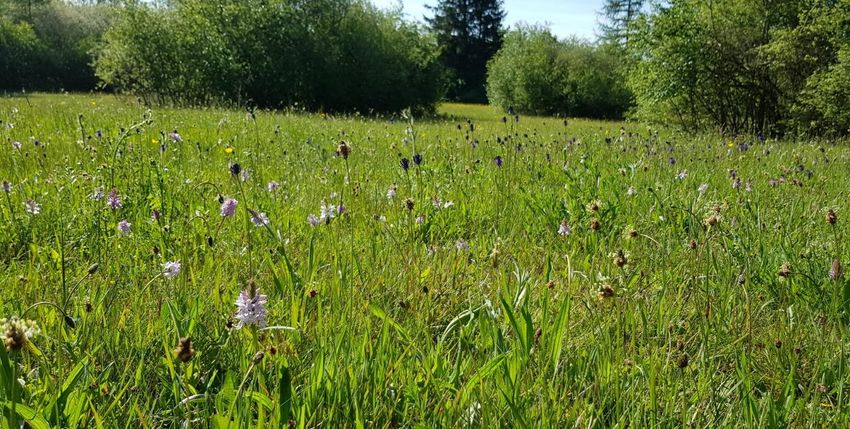
Content

Chapter 1 / Introduction ......................................................................................................................... 7
Chapter 2 / Building the EU Grassland Butterfly Indicator ..................................................................... 8
Chapter 3 / Species trends .................................................................................................................... 12
Chapter 4 / The indicator ...................................................................................................................... 14
Chapter 5 / Developing butterfly monitoring and improving indicator production across Europe ..... 15
Chapter 6 / Conclusions ........................................................................................................................ 17
References ............................................................................................................................................. 18
Annex I / Butterfly Monitoring Schemes in the indicator ..................................................................... 20
Annex II / Statistical method ................................................................................................................. 22

  Flower-rich grasslands have a high biodiversity and are important for many butterflies for reproduction
  and as nectar source.

Butterfly Conservation Europe 2019 | THE EU BUTTERFLY INDICATOR FOR GRASSLAND SPECIES 1990-2017                                                          6
Chapter 1 / Introduction

The EU Grassland Butterfly Indicator is one of the
indicators of the status of biodiversity in the European
Union. It is an abundance indicator based on data
recording the population trends of seventeen butterfly
species in 16 (see below) EU countries. This report
presents the seventh version of this indicator now
covering 28 years.

At the Convention on Biological Diversity meeting in
Nagoya (Japan) the Strategic Plan for Biodiversity 2011–
2020 was adopted. It proposed five goals and 20 “Aichi”
biodiversity targets. In line with this plan a new EU
biodiversity strategy was adopted by the European
Commission in May 2011. This provided a framework for
the EU to meet its own biodiversity objectives and its
global commitments as a party to the CBD. The Headline
Target is to halt the loss of biodiversity and the
degradation of ecosystem services in the EU by 2020, and
restore them, in so far as feasible, while stepping up the
EU contribution to averting global biodiversity loss. Under
                                                                                         Orange-tip (Anthocharis cardamines)
Target 3A the EU is committed to increase the
contribution of agriculture to biodiversity recovery.
Europe now has one year left to intensify action to achieve this.

The EU biodiversity strategy includes the development of a coherent framework for monitoring,
assessing and reporting on progress in implementing actions. Such a framework is needed to link
existing biodiversity data and knowledge systems with the strategy, to help assess achievement of
the goals and to streamline EU and global monitoring, reporting and review obligations.

Some of the EU biodiversity indicators provide specific measurements and trends on genetic, species
and ecosystem/landscape diversity, but many have a more indirect link to biodiversity. Very few have
been established specifically to assess biodiversity. The status indicators on species only cover birds,
bats and butterflies, since these are the only taxa/species groups for which harmonized European
monitoring data are available (EEA, 2012).

For the EU Grassland Butterfly Indicator the trends of seventeen widespread and characteristic
grassland butterflies were assessed in 16 countries in the European Union. This technical report gives
an overview of the method and results, and presents the indicator.

Butterfly Conservation Europe 2019 | THE EU BUTTERFLY INDICATOR FOR GRASSLAND SPECIES 1990-2017                     7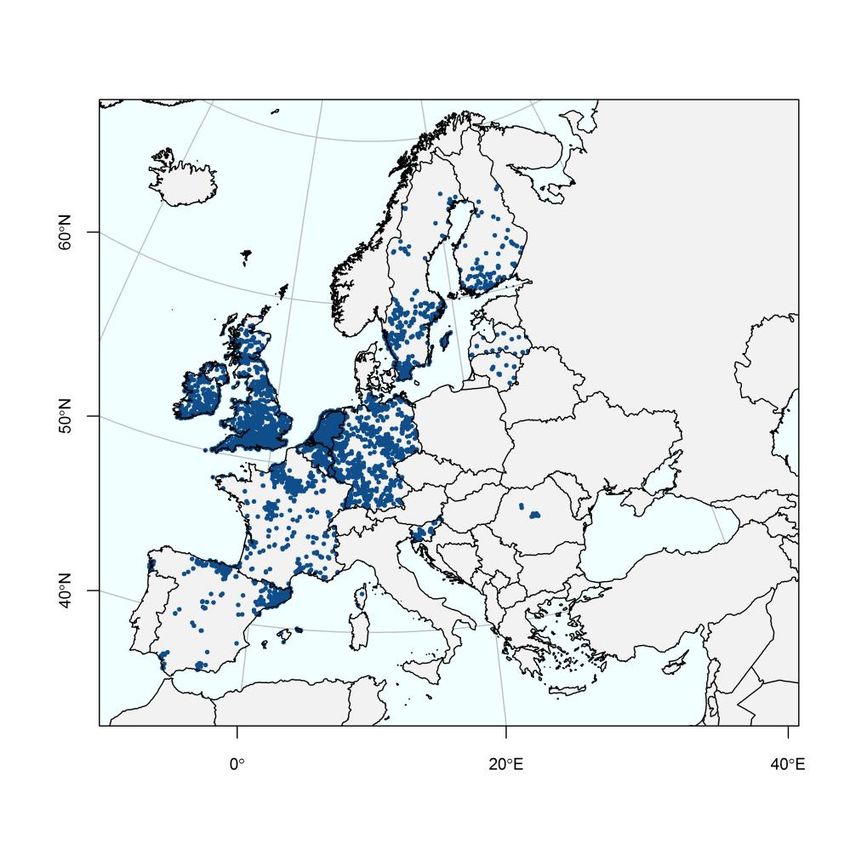
Chapter 2 / Building the EU Grassland Butterfly
Indicator

The EU Grassland Butterfly Indicator shows the population trend for seventeen typical grassland
butterflies. This chapter gives a brief overview of the methods.

Countries
Butterfly monitoring enjoys a growing popularity in Europe. Map 1 shows the Butterfly Monitoring
Schemes (BMS) contributing data to this indicator. Butterfly Monitoring Schemes are present in a
growing number of countries and new ones are being initiated in many places, particularly facilitated
by the partners of Butterfly Conservation Europe, through the Assessing ButterfLies in Europe (ABLE;
https://butterfly-monitoring.net/able) project. However, long time-series are only currently available
for a limited number of countries. For this updated indicator, data were used from 16 countries:
Andorra, Belgium, Estonia, Finland, France, Germany, Ireland, Latvia, Lithuania, Luxembourg,
Romania, Slovenia, Spain, Sweden, The Netherlands and the United Kingdom. The indicator included
data from 19 Butterfly Monitoring Schemes in total; Spain has three schemes – Catalonia, Basque
Country and other parts of Spain, Belgium has two (Flanders and Wallonia). Although there is a
dataset available from Madeira, none of the grassland butterfly indicator species occur on this island.
Other Butterfly Monitoring Schemes in Europe that are not within EU Member States were not
included, e.g. Switzerland, Jersey and Norway.

                                                                                          Map 1: Locations of transects which
                                                                                          have been used for the Grassland
                                                                                          Butterfly Indicator. Locations for
                                                                                          transects in Estonia were not
                                                                                          available yet.

Butterfly Conservation Europe 2019 | THE EU BUTTERFLY INDICATOR FOR GRASSLAND SPECIES 1990-2017                       8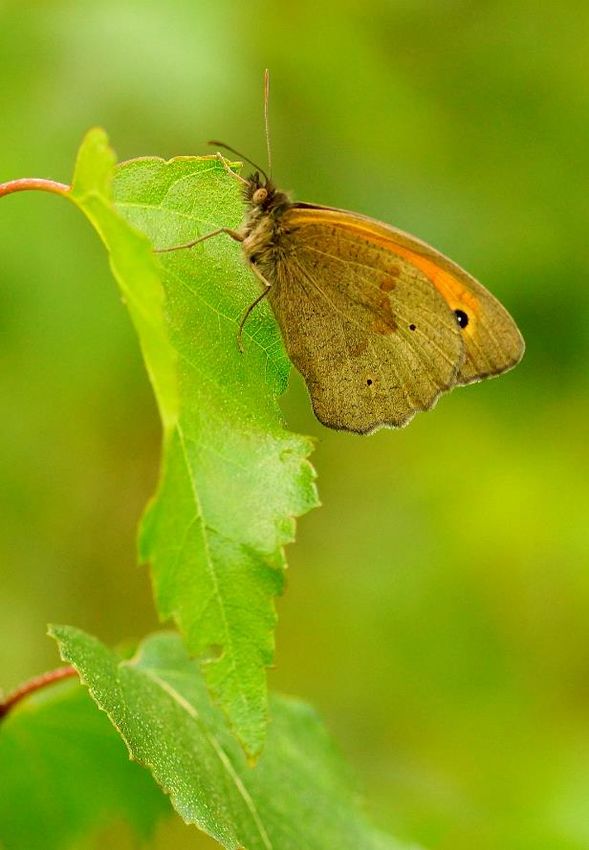
In this report, we update the EU Grassland Butterfly Indicator, first published by Van Swaay & Van
Strien in 2005. The updated indicator not only has a longer time-series, with the 2017 field seasons
now included, but also the method of calculating the indicator has been improved and enhanced.
More transects now contribute to the indicator. For 2017 more than 3400 transects were used
(Figure 1). 6200 different transects have been walked over this period across the EU; most of them
repeatedly.

The method closely follows the one for the bird indicators (Gregory et al., 2005) and bat indicators
(Van der Meij et al., 2014).

                                                                                      Figure 1: Number of transects
                                                                                      each year used in the European
                                                                                      Grassland Butterfly Indicator.

Fieldwork
The Butterfly Indicator is based on the fieldwork of thousands of trained professional and volunteer
recorders, counting butterflies on more than 6200 transects scattered widely across the European
Union (see map 1). These counts are made under standardised conditions. National coordinators
collect the data and perform the first quality control. More details can be found in annex I.

In 2017 more than 55,880 km of transect walks were made (more than 1.4 times around the Earth),
more than 90% of them by volunteers, monitoring each transect an average of 15 times per year
This is a considerable contribution by individual citizens to EU policy evaluation and development.

Butterfly Conservation Europe 2019 | THE EU BUTTERFLY INDICATOR FOR GRASSLAND SPECIES 1990-2017                        9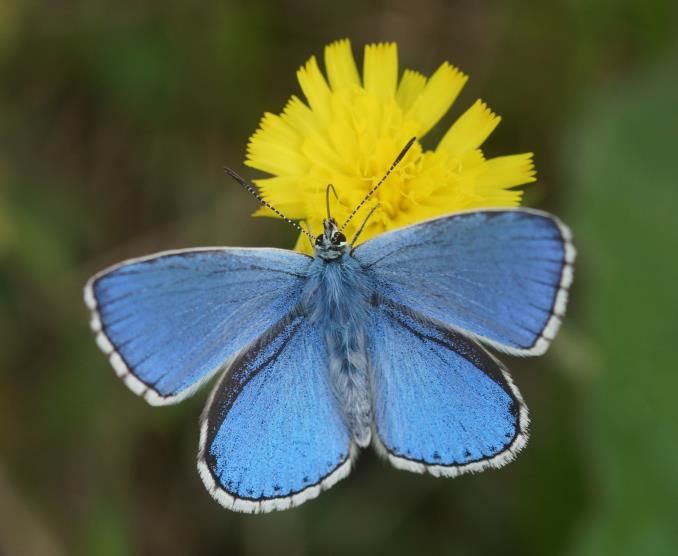
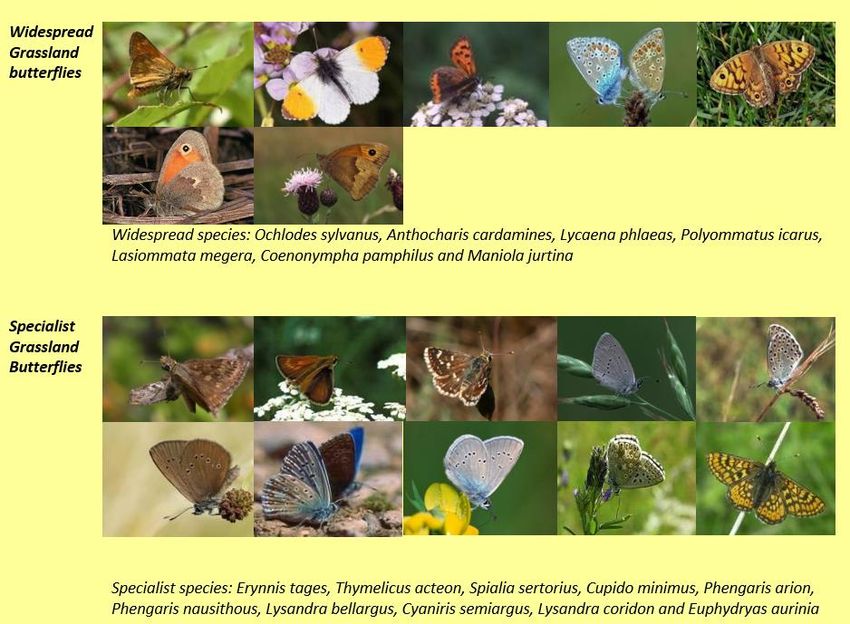
Grassland butterflies
The same selection of grassland butterflies has been used for this updated indicator as in the
previous versions. European butterfly experts selected species they considered to be characteristic of
European grassland and which occurred in a large part of Europe, covered by the majority of the
Butterfly Monitoring Schemes and having grasslands as their main habitat (Van Swaay et al., 2006).
The species are listed in figure 2.

Figure 2: Seventeen butterflies were used to build the EU Grassland Butterfly Indicator, comprising seven
widespread and ten specialist species.

Butterfly Conservation Europe 2019 | THE EU BUTTERFLY INDICATOR FOR GRASSLAND SPECIES 1990-2017             10
Population trend
For each species and year, flight periods were estimated (Dennis et al., 2016) based on climate zones
as defined in Metzger et al. (2013), but with further geographic stratification to represent major
geographic units (e.g. Britain and Ireland was treated as a separate unit to continental Europe). Site-
level indices were produced by estimating the missing counts, and species’ collated indices were
produced for each monitoring scheme using a Poisson General Linear Model (GLM) with site and year
effects, as well as the proportion of the flight period surveyed as a weighting. A collated index for the
EU was produced for each species by fitting a Poisson GLM to the scheme-level collated indices with
scheme and year effects as well as a weighting.
The EU indices for the 17 species were combined by taking the geometric mean of the indices using
the BRCindicators R package (August et al., 2017). This indicator is a unified measure of biodiversity
following the bird indicators as described by Gregory et al. (2005), by averaging indices of species
rather than abundances in order to give each species an equal weight in the resulting indicators.
When positive and negative changes of indices are in balance, then their mean would be expected to
remain stable. If more species decline than increase, the mean should go down and vice versa. Thus,
the index mean is considered a measure of biodiversity change.
More details on the method can be found in annex II. Although the Butterfly Monitoring Schemes are
very similar, there are differences among countries in choice of location, number of counts, etc.
These are summarised in annex I.
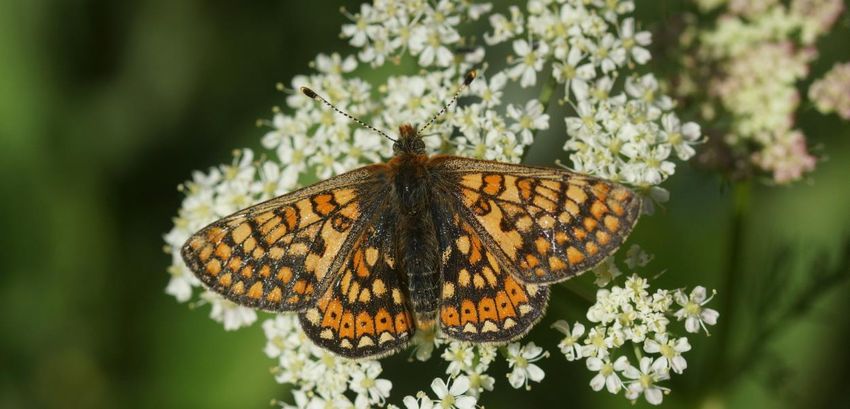
Marsh Fritillary (Euphydryas aurinia), a species of
the Habitats Directive (Annex II).
Marsh Fritillary (Euphydryas aurinia)
Butterfly Conservation Europe 2019 | THE EU BUTTERFLY INDICATOR FOR GRASSLAND SPECIES 1990-2017 11Chapter 3 / Species trends
The EU Grassland Butterfly Indicator is built from EU species trends described in chapter 2. In this
chapter, we give an overview of the trends of grassland butterflies in the European Union.
In the EU six species show a decline and seven are stable. Four species show an increase (table 1).
This means that overall grassland species are still declining.
Table 1: EU trends of the 17 butterfly species of the European Grassland Butterfly Indicator. For the trend
classification see annex II.
Trend Species Trend classification
Decline: 6 species Lasiommata megera strong decline
Coenonympha pamphilus moderate decline
Lycaena phlaeas moderate decline
Ochlodes sylvanus moderate decline
Polyommatus icarus moderate decline
Thymelicus acteon moderate decline
Stable: 7 species Anthocharis cardamines stable
Cupido minimus stable
Cyaniris semiargus stable
Erynnis tages stable
Lysandra bellargus stable
Lysandra coridon stable
Maniola jurtina stable
Uncertain: 4 species Euphydryas aurinia uncertain
Phengaris arion uncertain
Phengaris nausithous uncertain
Spialia sertorius uncertain
When interpreting the species trends it is
important to note that:
The coverage of the species’
populations and thus the
representativeness of the data may
be lower at the beginning of the time
series (see also figure 1). As more
countries join in later, the indices
improve in accuracy each year.
Large year-to-year fluctuations or a
low number of transects, can cause
large standard errors, leading to
uncertain trends.
A large number of male Adonis Blues (Lysandra
bellargus) can color a grassland.
Butterfly Conservation Europe 2019 | THE EU BUTTERFLY INDICATOR FOR GRASSLAND SPECIES 1990-2017 12 In almost half of the EU countries,
Butterfly Monitoring Scheme data was
available. The ABLE project has been
set up to increase the coverage,
especially in Eastern and Southern
Europe. This indicator is built with data
which has been collected before the
start of the ABLE project in December
2018. The trends shown only
represent the countries in map 1,
which means they are based on a wide
range of countries, including larger
ones such as France, Germany and the
United Kingdom. Extra data that will
be gathered from other countries in
the EU will make the results more
representative in the future.
New countries have joined in, new
data have become available in existing
schemes, the method for trend
calculation has been improved, and
two years extra data have been added.
These developments can lead to
changes in trends as compared to
previous versions of the indicator. In
some cases this even can lead to a
change in the direction of the trend.
Meadow Brown (Maniola jurtina), probably one of the most
common butterflies on grasslands.
Butterfly Conservation Europe 2019 | THE EU BUTTERFLY INDICATOR FOR GRASSLAND SPECIES 1990-2017 13Chapter 4 / The indicator
The European Grassland Butterfly Indicator has been updated using data available from contributing
Butterfly Monitoring Schemes.
Figure 3 shows the European Grassland Butterfly Indicator for these EU-countries. The indicator is
based on the geometric mean of the supra-national species trends (as in the bird indicators, Gregory
et al., 2005) as detailed in chapter 3. As well as the yearly index-values of the indicator, a flexible
trend with confidence intervals is presented (see annex II). The confidence limits of the indicator
incorporate the uncertainty from the underlying species indices.
Figure 3: The Grassland Butterfly Indicator for the EU. The indicators are
based on the countries in map 1 in the EU and characteristic grassland
butterfly species in figure 2. The shaded areas represent the 95%
confidence limits surrounding the smoothed trend.
The indicator shows a significant decline of 39%, most of which occurred in the periods 1990-1998
and 2002-2012. The rate of decline seems to have slowed in the last five years compared with the
previous period. So far, 1990-1992 represent the best years for butterflies in the smoothed indicator,
with 2007 and 2008 as the years with the lowest population-indices on average, based on the
unsmoothed indicator. Interpretation of the trend and driving factors has been included in previous
reports (e.g. Van Swaay et al, 2016)
Butterfly Conservation Europe 2019 | THE EU BUTTERFLY INDICATOR FOR GRASSLAND SPECIES 1990-2017 14Chapter 5 / Developing butterfly monitoring and
improving indicator production across Europe
Butterflies are among the few species groups where large-scale, continent-wide monitoring is
feasible. The Assessing ButterfLies in Europe (ABLE) project was initiated in December 2018, with the
aim to create a representative butterfly monitoring network across as many EU countries as possible
in order to improve the targeting and efficiency of conservation measures within the European
Union. To do this, the ABLE project will develop a suite of indicators that can inform EU biodiversity
and land use policies, including the Common Agricultural Policy. The data will also be used to help
assess the health of Europe’s pollinators as part of the implementation of the EU Pollinator Initiative.
The project will involve thousands of volunteers across Europe who will contribute data in a
standardised way into a central database (the European Butterfly Monitoring Scheme - eBMS). It
builds on existing Butterfly Monitoring Schemes that are running in twenty countries, but will extend
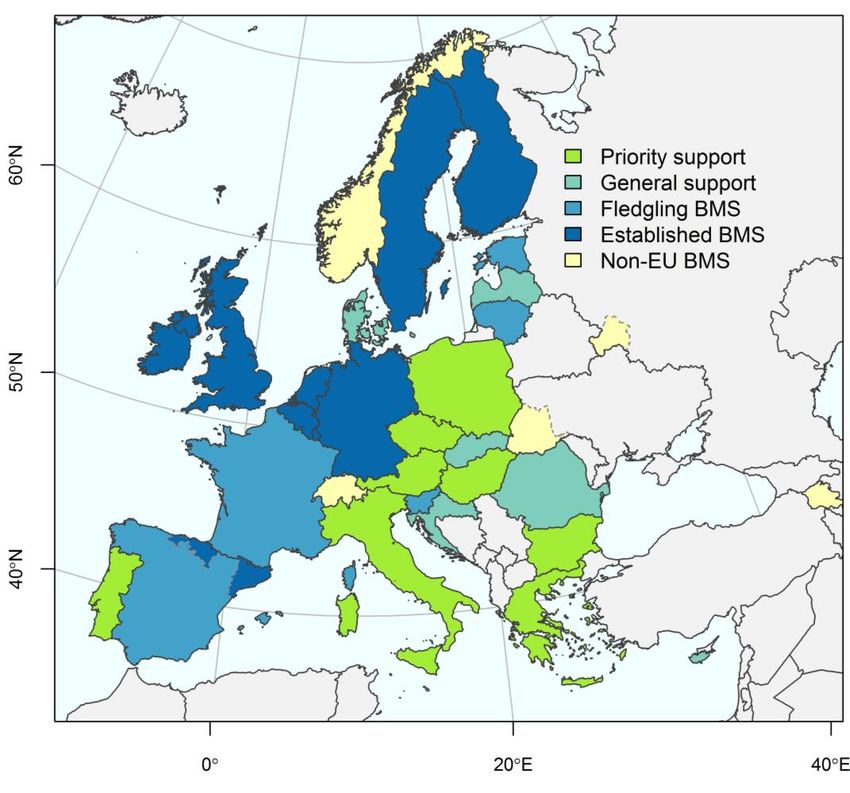
these to other countries that currently do not have schemes (map 2). Target countries include
Austria, Bulgaria, Croatia, Cyprus, Denmark, Greece, Hungary, Italy, Latvia, Malta, Poland, Portugal,
Slovakia.
Map 2: Status of Butterfly Monitoring Schemes (BMS) in Europe.
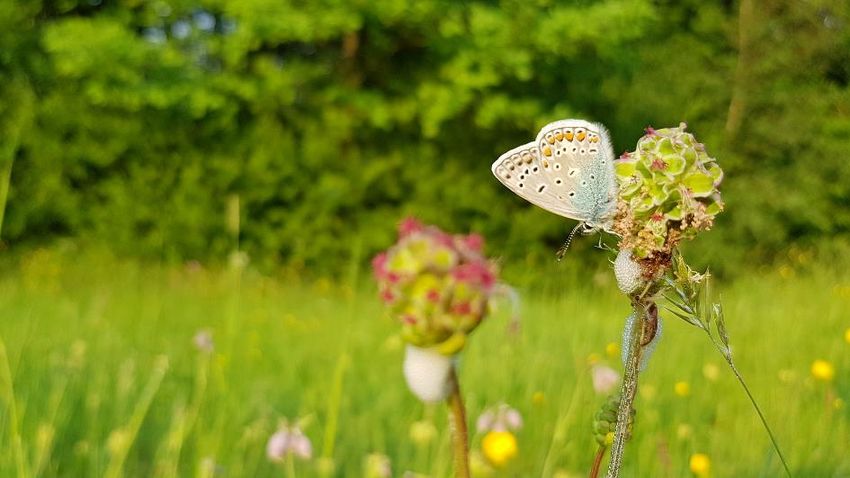
Butterfly Conservation Europe 2019 | THE EU BUTTERFLY INDICATOR FOR GRASSLAND SPECIES 1990-2017 15The ABLE project is a partnership between Butterfly Conservation Europe, the Centre for Ecology and Hydrology (UK), the Helmholtz Centre for Environmental Research (UFZ, Germany), Dutch Butterfly Conservation and Butterfly Conservation (UK). It is funded by a service contract from the European Union Directorate for the Environment, for an initial period of two years from 2019-20. The progress of the ABLE project can be followed at https://www.butterfly-monitoring.net/able With increased coverage, the geographical scope of the butterfly indicator is improving rapidly. This makes butterflies, after birds, the next group for which European trends can be established and used for the evaluation of changes in biodiversity. The farmland bird and grassland butterfly indicators are now used in the indicator ‘abundance and diversity of groups of species’ (European Environment Agency, 2012). This is one of the few ‘direct’ core biodiversity indicators, as most of the others represent pressures on biodiversity or social responses to biodiversity loss (Levrel et al., 2010). The Common Blue (Polyommatus icarus) can still be found on many grasslands. Butterfly Conservation Europe 2019 | THE EU BUTTERFLY INDICATOR FOR GRASSLAND SPECIES 1990-2017 16
Chapter 6 / Conclusions
This report gives an update of an indicator for Grassland Butterflies in the European Union,
which gives the trend of a selection of butterflies characteristic of European grasslands.
The indicator is based on regional and national Butterfly Monitoring Schemes from across
the European Union (see map 1).
The results show that the index of grassland butterfly abundance has declined by 39% since
1990, indicating a dramatic loss of grassland biodiversity.
In North-western Europe, intensification of farming has been identified as the most
important threat to grassland butterflies, while abandonment of grasslands is more
important in other parts of Europe (Van Swaay et al., 2016). Protecting remaining semi
natural-grasslands in these areas and reversing fragmentation is essential to halt further
losses.
The challenge now is to halt the losses and start the recovery. An urgent programme to halt
abandonment of semi natural grassland and restore it to good ecological condition is
required both inside and outside Natura 2000 sites. Action is also needed to halt losses of
semi natural grassland extent and quality which are still occurring through agricultural
intensification and eutrophication. The adverse effects of pesticides on butterflies also need
to be reduced.
The ABLE project aims to extend the network of Butterfly Monitoring Schemes over new
countries in the EU, to make future Butterfly Indicators even more representative.
In the next year the ABLE project will develop new indicators, including one for woodland,
wetland and climate change, and improve on existing methods.
Wet flower-rich haymeadow, full of orchids and butterflies.
Butterfly Conservation Europe 2019 | THE EU BUTTERFLY INDICATOR FOR GRASSLAND SPECIES 1990-2017 17References August, T., Powney, G., Outhwaite, C. and Issac, N., 2017. BRCindicators: Creating biodiversity indicators for species occurrence data. R package version 1.0. Brereton, T.M., Botham, M.S., Middlebrook, I., Randle, Z., Noble D., Harris, S., Dennis, E.B., Robinson A. & Roy, D.B. 2018. United Kingdom Butterfly Monitoring Scheme report for 2017. Centre for Ecology & Hydrology, Butterfly Conservation, British Trust for Ornithology and Joint Nature Conservation Committee. Dennis, E.B., Morgan, B.J., Freeman, S.N., Brereton, T.M. and Roy, D.B., 2016. A generalized abundance index for seasonal invertebrates. Biometrics, 72(4), pp.1305-1314. European Environment Agency (2012). Streamlining European biodiversity indicators 2020: Building a future on lessons learnt from the SEBI 2010 process. EEA Technical report No 11/2012. Gregory, R. D., Van Strien, A., Vorisek, P., Gmelig Meyling, A. W., Noble, D. G., Foppen, R. P., & Gibbons, D. W. (2005). Developing indicators for European birds. Philosophical Transactions of the Royal Society B: Biological Sciences, 360(1454), 269-288. Henry, P.Y., Lengyel, S., Nowicki, P., Julliard, R., Clobert, J., Čelik, T., Gruber, B., Schmeller, D.S., Babij, V. and Henle, K., 2008. Integrating ongoing biodiversity monitoring: potential benefits and methods. Biodiversity and conservation, 17(14), pp.3357-3382. Kühn, E., Feldmann, R., Harpke, A., Hirneisen, N., Musche, M., Leopold, P. and Settele, J., 2008. Getting the public involved in butterfly conservation: lessons learned from a new monitoring scheme in Germany. Israel Journal of Ecology & Evolution, 54(1), pp.89-103. Levrel, H., Fontaine, B., Henry, P.Y., Jiguet, F., Julliard, R., Kerbiriou, C. and Couvet, D., 2010. Balancing state and volunteer investment in biodiversity monitoring for the implementation of CBD indicators: A French example. Ecological economics, 69(7), pp.1580-1586. Metzger, M.J., Bunce, R.G., Jongman, R.H., Sayre, R., Trabucco, A. and Zomer, R., 2013. A high‐resolution bioclimate map of the world: a unifying framework for global biodiversity research and monitoring. Global Ecology and Biogeography, 22(5), pp.630-638. Pollard, E. and Yates, T.J., 1993. Monitoring butterflies for ecology and conservationthe british butterfly monitoring scheme (No. 333.955 P6). Schmucki, R., Pe'er, G., Roy, D.B., Stefanescu, C., Van Swaay, C.A.M., Oliver, T.H., Kuussaari, M., Van Strien, L. Ries, J. Settele, M. Musche, J. Carnicer, O. Schweiger, T. M. Brereton, A. Harpke, J. Heliölä, E. Kühn, and R. Julliard., 2016. A regionally informed abundance index for supporting integrative analyses across butterfly monitoring schemes. Journal of Applied Ecology, 53(2), pp.501-510. Soldaat, L.L., Pannekoek, J., Verweij, R.J., van Turnhout, C.A. and van Strien, A.J., 2017. A Monte Carlo method to account for sampling error in multi-species indicators. Ecological indicators, 81, pp.340-347. Sutherland, W.J. ed., 2006. Ecological census techniques: a handbook. Cambridge university press. Van der Meij, T., Van Strien, A.J., Haysom, K.A., Dekker, J., Russ, J., Biala, K., Bihari, Z., Jansen, E., Langton, S., Kurali, A. and Limpens, H., 2015. Return of the bats? A prototype indicator of trends in European bat populations in underground hibernacula. Mammalian biology, 80(3), pp.170-177. Butterfly Conservation Europe 2019 | THE EU BUTTERFLY INDICATOR FOR GRASSLAND SPECIES 1990-2017 18
Van Swaay, C.A., Nowicki, P., Settele, J. and van Strien, A.J., 2008. Butterfly monitoring in Europe: methods,
applications and perspectives. Biodiversity and Conservation, 17(14), pp.3455-3469.

Van Swaay, C.A.M., Plate, C.L. and Van Strien, A.J., 2002. Monitoring butterflies in the Netherlands: how to get
unbiased indices. In Proc Exp Appl Entomol (Vol. 13, pp. 21-27).

Van Swaay, C.A.M., van Strien, A.J., Aghababyan, K., Åström, S., Botham, M., Brereton, T. Carlisle, B., Chambers,
P., Collins, S., Dopagne, C., Escobés, R., Feldmann, R., Fernández-García, J.M., Fontaine, B., Goloshchapova, S.,
Gracianteparaluceta, A., Harpke, A., Heliölä, J., Khanamirian, G., Komac, B., Kühn, E., Lang, A., Leopold, P.,
Maes, D., Mestdagh, X., Monasterio, Y., Munguira, M.L., Murray, T., Musche, M., Õunap, E., Pettersson, L.B.,
Piqueray, J., Popoff, S., Prokofev, I., Roth, T., Roy, D.B., Schmucki, R., Settele, J., Stefanescu, C., Švitra, G.,
Teixeira, S.M., Tiitsaar, A., Verovnik, R., Warren, M.S. (2016). The European Butterfly Indicator for Grassland
species 1990-2015. Report VS2016.019, De Vlinderstichting, Wageningen

Van Swaay, C.A.M. and van Strien, A., 2005. Using butterfly monitoring data to develop a European grassland
butterfly indicator. Studies on the ecology and conservation of Butterflies in Europe. Vol 1: General concepts
and case studies, pp.106-108.

Van Swaay, C., Warren, M., & Loïs, G. (2006). Biotope use and trends of European butterflies. Journal of Insect
Conservation, 10(2), 189-209.

Butterfly Conservation Europe 2019 | THE EU BUTTERFLY INDICATOR FOR GRASSLAND SPECIES 1990-2017                  19
Annex I / Butterfly Monitoring Schemes in the
indicator

Since the start of the first Butterfly Monitoring Scheme in the UK in 1976 more and more countries
have joined in. This annex summarizes the most important features of the schemes used for the EU
Grassland Butterfly Indicator.

Field methods
All schemes apply the method developed for the UK Butterfly Monitoring Scheme (Pollard & Yates,
1993). The counts are conducted along fixed transects of 0.5 to 3 kilometres consisting of component
sections, but the exact transect length varies among countries. The fieldworkers record all butterflies
2.5 metres to their right, 2.5 metres to their left, 5 metres ahead of them and 5 metres above them
(Van Swaay et al., 2008). Butterfly counts are conducted between March-April to September-
October, depending on the region. Visits are only conducted when weather conditions meet
specified criteria. The recommended number of visits varies from every week in e.g. the UK,
Catalonia and the Netherlands to 3-5 visits annually in France (table 2).

Transect selection
To be able to draw proper inferences on the temporal population trends at national or regional level,
transects should best be selected in a grid, random or stratified random manner (Sutherland, 2006).
Several recent schemes, e.g. in Switzerland and France, have been designed in this manner (Henry et
al., 2008). If a scheme aims to monitor rare species, scheme coordinators preferably to locate
transects in areas where rare species occur, leading to an overrepresentation of special protected
areas. In the older schemes, such as in the UK and the Netherlands, but also in the recently
established scheme in Germany, transects were selected by free choice of observers, which in some
cases has led to the overrepresentation of protected sites in natural areas and the undersampling of
the wider countryside and urban areas (Pollard & Yates, 1993), though this is not the case in all
countries (e.g. Germany, Kühn et al., 2008). Obviously, in such a case the trends detected may be
only representative for the areas sampled, while their extrapolation to national trends may produce
biased results. Such bias can however be minimized by post-stratification of transects. This implies a
posteriori division of transects by e.g. habitat type, protection status and region, where counts per
transect are weighted according to their stratum (Van Swaay et al., 2002).

Species set
The grassland indicator is based on seven widespread grassland species (Ochlodes sylvanus,
Anthocharis cardamines, Lycaena phlaeas, Polyommatus icarus, Lasiommata megera, Coenonympha
pamphilus and Maniola jurtina) and ten grassland-specialists (Erynnis tages, Thymelicus acteon,
Spialia sertorius, Cupido minimus, Phengaris arion, Phengaris nausithous, Lysandra coridon, Lysandra
bellargus, Cyaniris semiargus and Euphydryas aurinia). See also figure 2.

Butterfly Conservation Europe 2019 | THE EU BUTTERFLY INDICATOR FOR GRASSLAND SPECIES 1990-2017      20
Table 2: Characteristics of the Butterfly Monitoring Schemes used for the EU Grassland Butterfly Indicator.
Mean number of counts on a transect
Area represented (w=whole country,
Method to choose sites (f=free, c=by
Nature reserves overrepresented*
Mean number of transects which
co-ordinator, g=grid, r=random)
representative for agricultural
Average transect length (km)
have contributed 2015-2017
Counts by (v=volunteers,
p=professionals)
Starting year
grassland*
r=region)
per year
Country
Belgium – Wallonie 2006 r 0.6 54 3 p c yes no
Belgium – Flanders 1991 r 0.8 10 15 v f no no
Germany 2005 w 0.5 437 14 v f yes no
Spain (Basque Country) 2010 r 1.8 54 8 v~70%. p~30% f yes yes
Spain – Catalonia 1994 r 1.6 88 24 v f yes no
Spain (excl. Catalonia and 2015 r 1.5 60 12 v~50%. p~50% f yes yes
Basque Country)
Finland 1999 w 3 46 14 v~80%. p~20% f for v yes no
France 2005 w 2.6 110 4 v f ~50% yes no
c~50%
Ireland 1992 w 3 116 13 v f yes no
Lithuania 2009 w 1.1 7 9 v f no no
Luxembourg 2010 w 0.8 55 4 v~10%. p~90% r yes no
Latvia 2015 w 1.4 18 3 p c yes no
Netherlands 1990 w 0.6 574 14 v f yes no
Romania (Amiga) 2013 r 1 4 4 p c yes no
Romania (Adept) 2014 r 0.7 8 5 v~60%. p~40% c yes no
Sweden 2010 w 1.6 190 4 v~90%. p~10% f yes no
Slovenia 2007 w 1.4 8 8 v c yes no
United Kingdom 1990 w 2.1 1483 19 v f yes yes
Butterfly Conservation Europe 2019 | THE EU BUTTERFLY INDICATOR FOR GRASSLAND SPECIES 1990-2017 21Annex II / Statistical method
We used the following procedure to compute the grassland indicator.
Data collection
All data was first collected at a regional or national level (see table 2), and after validation added to
the eBMS database. This is a standardised database containing the following tables:
1. Butterfly count data table
2. Monitoring visit table
3. Site geographical information table
4. Habitat type table
5. Habitat type description table
6. Species name table
National indices
We used this database to calculate national indices for each species for which monitoring data were
available:
Stage 1 – estimating phenology
For each species and year, flight periods were estimated based on climate zones (Schmucki
et al., 2016) using the spline formulation of the generalised abundance index approach (GAI,
Dennis et al., 2016). The climate zones are based on those defined in Metzger et al. (2013),
but with further geographic stratification.
Stage 2 – producing species scheme/country level collated indices
Site-level indices were produced by estimating the missing counts using the flight phenology
computed from the GAI above, and species’ collated indices were produced for each
monitoring scheme using a Poisson GLM with site and year effects, as well as the proportion
of the flight period surveyed as a weighting (Brereton et al., 2018), applied to the site indices
scaled to densities per 0.5 ha (based on 5m wide sampling and transect lengths standardized
to 1km). Site indices were then randomly resampled 1000 times, while keeping the number
of transect sampled per year equal to the original data, to produce 1000 collated indices per
species and monitoring scheme.
The national indices were checked for reliability and magnitude of confidence intervals.
Indices were not used if the time series were very short or based on a few sites or
observations only.
Supra-national indices
In the next step we combined national indices to produce EU collated indices.
Stage 3 – producing species EU collated indices
Collated indices with negative estimates were filtered out. A collated index for the EU was
produced for each species by fitting a Poisson GLM to the scheme-level collated indices with
scheme and year effects as well as a weighting. Prior to fitting, any index values (on the log10
scale with a mean of 2) less than zero or greater than 4 were omitted.
The weightings were based on the product of the total area (km2) that a given species
Butterfly Conservation Europe 2019 | THE EU BUTTERFLY INDICATOR FOR GRASSLAND SPECIES 1990-2017 22occupies in the relevant country (or part of country for certain schemes) and the species’
population density. Population density was taken as the mean population density per 1km2
across years for a given species and monitoring scheme. The weightings were rescaled to
sum to 1 for a given species, across the relevant monitoring schemes. The same approach
was taken for each of 1000 bootstraps to produce 1000 EU collated indices for each species.
EU indicator
Stage 4 – generating the EU indicators
The EU indices for the 17 species were combined by taking the geometric mean of the
indices. The BRCindicators R package (August et al., 2017) was used, to account for missing
values, in particular the late entry of some species. A smoothed indicator was produced using
a loess smooth with span=0.75 and degree=2 (as in Soldaat et al., 2017). The same approach
was applied to produce multi-species indices and smoothed indicators for each of 1000
bootstraps, from which quantiles were taken to produce 95% CI around the indicators. All
values were rescaled such that the smoothed indicator started at 100.
Additional notes
Bootstrapping throughout all model stages, i.e. including stage 1 would ensure full error propagation
throughout the workflow, whereas currently bootstrapping occurs from stage 2 onwards. This has
benefits of computational efficiency, and we would expect greater variation through variation in sites
(as currently accounted for), than through variation in the flight period estimation.
Potential biases
Although the Butterfly Monitoring Schemes are very similar, there are differences in choice of
location, number of counts, corrections for unstratified sampling, etc. These are summarised in
annex I. These changes can potentially lead to biases. It is also important to note that in countries
where the choice of the location for the transect is free (table 2), there tends to be an oversampling
in species-rich sites, nature reserves or regions with a higher butterfly recorder density. The trend of
butterflies within nature reserves may be expected to be better than in the wider countryside, since
the management of these reserves focuses on reaching a high biodiversity and positive population
trends. This suggests that the grassland indicator is probably a conservative measure of the real
trend across the European landscape. There is a risk that the decline in the population size of
butterflies is actually more severe than the indicator shows. We hope to be able to test this in future.
Butterfly Conservation Europe 2019 | THE EU BUTTERFLY INDICATOR FOR GRASSLAND SPECIES 1990-2017 23You can also read