The evidence - "It is the right and duty of every citizen to see what the scientists have said and to analyse it for themselves."
←
→
Page content transcription
If your browser does not render page correctly, please read the page content below
03/08/2020                                             The evidence - Evidence Not Fear

                                              The evidence

             “It is the right and duty of every citizen to see what the
             scientists have said and to analyse it for themselves.”
             Lord Sumption < https://evidencenotfear.com/tag/lord-sumption/> , former
             Justice of The Supreme Court
             Statistics and charts can be tricky and they are often used to push a certain point-of-
             view. However, with some critical thinking and basic school-level mathematics, we are
             all capable of understanding what the data means. We do not need to be scientists,
             mathematicians or subject-matter experts to come to sensible and informed
             conclusions.

             Let’s strip away the frightening news headlines and look at what the evidence shows
             us.

             Table of contents

                             Five key facts
                             Harmless to most people

https://evidencenotfear.com/evidence/                                                                  1/28
03/08/2020                                                   The evidence - Evidence Not Fear

                                        Infection fatality rate
                             Comparison with flu
                             Flawed evidence for lock-down
                                        Non-lockdown vs Lockdown
                                        Deaths caused by the lockdown
                                        Buggy modelling code
                             Social distancing
                                        No evidence for social distancing
                                        Two metre rule
                                        Face masks
                                        R value
                             Testing
                                        Types of tests
                                        Testing procedures
                             Government intervention
                             Statistics
                                        EuroMOMO
                                        Office for National Statistics
                                        COVID-19 in proportion
                             Understand the numbers
                                        Curve Analysis
                             Suggest evidence
                             Next steps

             Five key facts
             According to Dr. Scott W. Atlas, we now have enough data to be sure of five key facts
             about COVID-19:

             1. The overwhelming majority of people do not have any significant risk of dying
                from COVID-19.

https://evidencenotfear.com/evidence/                                                                2/28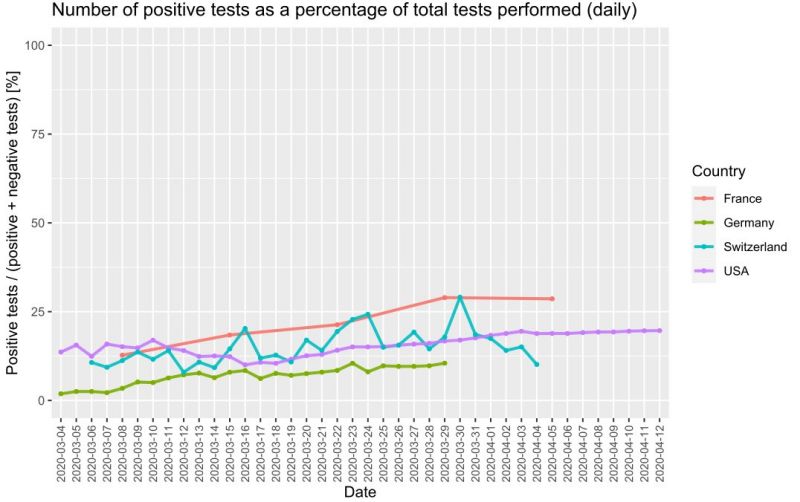
03/08/2020                                         The evidence - Evidence Not Fear

             2. Protecting older, at-risk people eliminates hospital overcrowding.
             3. Vital population immunity is prevented by total isolation policies, prolonging the
                problem.
             4. People are dying because other medical care is not getting done due to hypothetical
                projections.
             5. We have a clearly defined population at risk who can be protected with targeted
                measures.

             Dr. Scott Atlas < https://evidencenotfear.com/tag/dr-scott-atlas/> is the David and
             Joan Traitel Senior Fellow at Stanford University’s Hoover Institution and the former
             chief of neuroradiology at Stanford University Medical Center.

             Harmless to most people
             Public Health England, on their 21 March 2020 update for High consequence
             infectious diseases (HCID), stated, “As of 19 March 2020, COVID-19 is no longer
             considered to be a high consequence infectious disease in the UK.” If COVID-19 is
             not a high consequence infectious disease, why was the UK thrown into uncharted
             territory without debate?

             Nevertheless, despite spending weeks on lock-down; after destroying our economy
             and businesses; after causing mass unemployment; after inflicting unimaginable
             suffering to the entire nation, the UK Government again admitted that coronavirus is
             completely harmless to most people.

             On the 11 May 2020 Downing Street Press Briefing, the UK’s Chief Medical Officer,
             Professor Chris Whitty, confirmed:

             “Most people will not get this virus at all. Of those who get symptoms, the vast
             majority will have a mild or moderate disease. The great majority of people, even in
             the highest risk groups, will not die.”

                         UK Gov't con rms Covid19 harmless to V…
                                                              V…

https://evidencenotfear.com/evidence/                                                                 3/28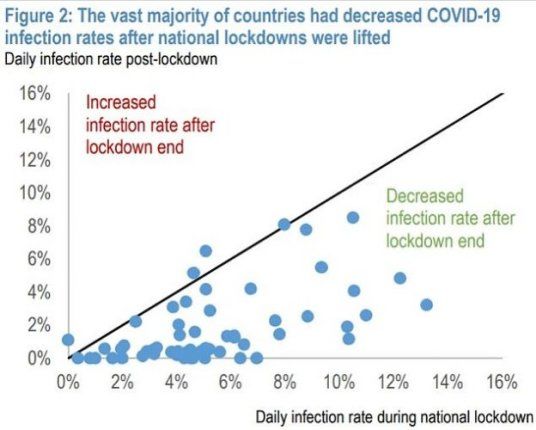
03/08/2020                                          The evidence - Evidence Not Fear

             Downing Street Press Briefing, 11 May 2020

             Infection fatality rate
             Multiple studies have found that COVID-19 has an infection fatality rate of between
             0.02% and 0.8%.

             The infection fatality rate <
             https://en.wikipedia.org/wiki/Case_fatality_rate#Terminology> (IFR) is an
             estimated death rate in all those who have been infected with a disease. This includes
             those who have been found to be infected (called ‘cases’), as well as those who were
             undetected, either because they have not been tested or are not showing symptoms.

             The case fatality rate, on the other hand, is the measure of deaths among diagnosed
             cases. The mortality rate is the number of deaths in a specific population, such as the
             population of the United Kingdom, over a period of time.

             The IFR tends to give a better overall mortality for non-experts and therefore is
             increasingly being used by policy-makers.

             Comparison with flu
             During the start of the COVID-19 panic, we constantly heard the media and
             politicians saying that comparing COVID-19 with flu is irresponsible. Apparently,
             COVID-19 is so deadly and spreads so quickly that governments needed to impose
             unprecedented control over society in order to fight it.

             In contrast, this is what epidemiologists, microbiologists and researchers have been
             telling us:

https://evidencenotfear.com/evidence/                                                                  4/28
03/08/2020                                        The evidence - Evidence Not Fear

                         Corona-Krise: Prof. Sucharit Bhakdi …

                         Professor Sunetra Gupta: the epide…
                                                      epide…

                         Why lockdowns are the wrong policy…
                                                     policy…

https://evidencenotfear.com/evidence/                                                5/28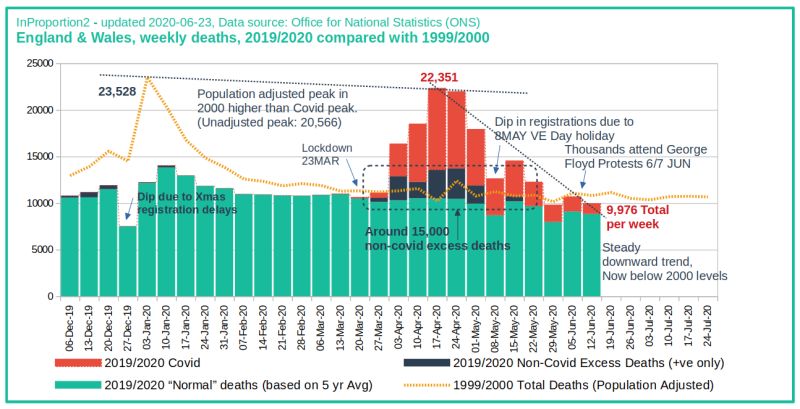
03/08/2020                                         The evidence - Evidence Not Fear

             Flawed evidence for lock-down
             Countries have taken different approaches and there is no evidence that lockdowns
             have reduced COVID-19 deaths. Inaccurate testing and inconsistent reporting methods
             is a big problem. We also have no evidence that our NHS would have faced any
             greater strain when compared to previous flu seasons. In fact, the medical systems of
             most countries are stretched every flu season.

             In the UK, we are told that a lock-down is needed to ‘flatten the curve’. This was
             based on unfounded assumptions and flawed Imperial College models that predicted
             half a million deaths from COVID-19. The report that lead to the lock-down was
             retracted days after release, with the number scaled down first to 20,000 and then to
             just over 6,000. Professor Neil Ferguson <
             https://evidencenotfear.com/tag/professor-neil-ferguson> , the author of the report,
             has a track record of failed predictions < https://evidencenotfear.com/neil-
             ferguson-the-scientist-who-convinced-boris-johnson-of-uk-coronavirus-
             lockdown-criticised-in-past-for-flawed-research-the-telegraph/> .

             Nevertheless, the lockdown was still enforced. Our entire county has been shut down,
             millions have been made unemployed and businesses are ruined due to flawed
             models and bad advice.

             Non-lockdown vs Lockdown
             The graph below, from UK Column < https://www.ukcolumn.org/> news, compares
             the deaths and cases, between non-lockdown (left) and lockdown (right) countries. A
             similar chart compares non-lockdown (left) and lockdown (right) states in the US.

             We can see that in general, areas that have implemented lockdown have higher death
             rates.

https://evidencenotfear.com/evidence/                                                                9/28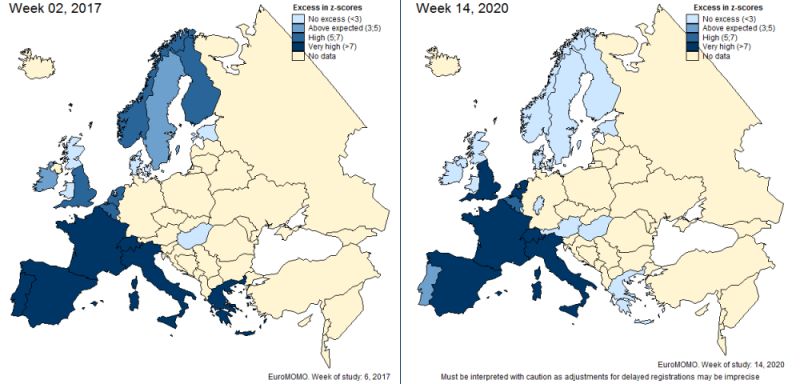
03/08/2020                                        The evidence - Evidence Not Fear

                         Perspectives on the Pandemic | Dr. …

                         Prof. Dr. Jochen A. Werner zum Cor…
                                                        Cor…

https://evidencenotfear.com/evidence/                                                6/28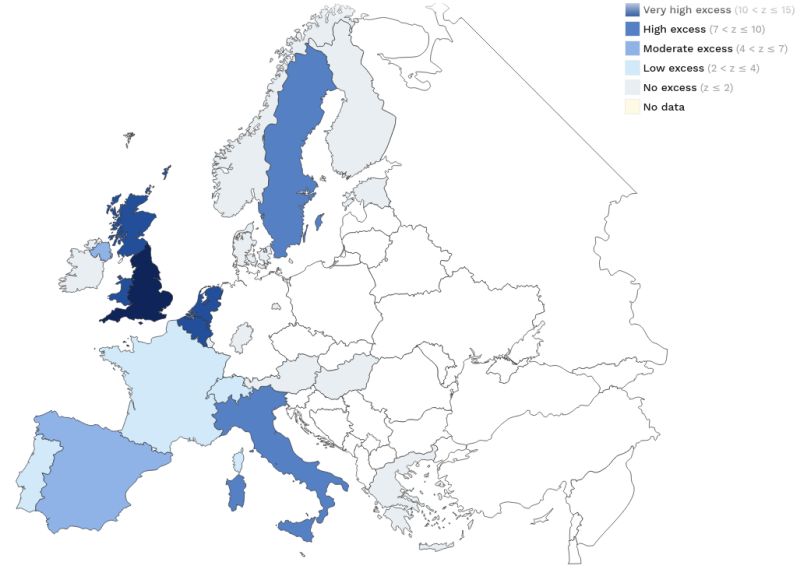
03/08/2020                                         The evidence - Evidence Not Fear

             Source: Non-lockdown (left) vs Lockdown countries (right) as of 1 May 2020, from UK
             Column < https://www.youtube.com/watch?v=RHR3NwGcE7o>

https://evidencenotfear.com/evidence/                                                              10/28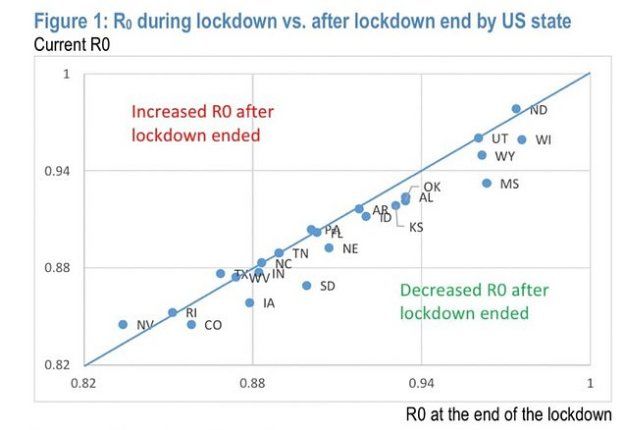
03/08/2020                                      The evidence - Evidence Not Fear

                         How Dr. Wolfgang Wodarg sees the …

                         Questioning Conventional Wisdom i…
                                                         i…

https://evidencenotfear.com/evidence/                                              7/28
03/08/2020                                           The evidence - Evidence Not Fear

             Non-lockdown (left) vs Lockdown states in the US (right) as of 17 April, 2020

             Note: These charts are outdated. The death numbers have changed and Mexico moved
             into lockdown after the chart was compiled (see visitor comment 16 May 2020 <
             https://evidencenotfear.com/evidence/#comment-63> ). They have been left to
             illustrate the differences between lockdown and non-lockdown areas around April.
             However, we will update the charts when new versions are available.

             J.P. Morgan Quantitative and Derivatives Strategy via The Daily Mail

https://evidencenotfear.com/evidence/                                                           11/28
03/08/2020 The evidence - Evidence Not Fear
Perspectives on the Pandemic | Dr. …
In summary:
We should tackle COVID-19 just as we currently do with seasonal influenza <
https://evidencenotfear.com/tag/influenza/> . Sick people should stay at home,
the vulnerable should be protected but the healthy should get on with their lives as
normal.
COVID-19 is deadly for vulnerable people but anyone at risk from COVID-19 is
also at serious risk from flu. Even the common cold may have a death rate as high
as 6% in risk groups < https://evidencenotfear.com/studies-show-6-death-rates-
from-common-cold-in-risk-groups-nih/> .
In some countries COVID-19 may have a lower mortality rate than flu.
Cases for COVID-19 are not increasing exponentially. Instead, we are seeing an
‘explosion in testing‘ for COVID-19.
The high death rates in some countries are due counterproductive treatment
methods, such as intubation and the use of steroids.
Some level of social distancing is helpful but a general lock-down and house arrest
of the entire population will prove to be a disaster.
Here is what no-one, even officially approved mainstream sources, appears to dispute:
in at least 80% cases, the virus produces either no symptoms or a mild cold-like
illness.
https://evidencenotfear.com/evidence/ 8/2803/08/2020 The evidence - Evidence Not Fear
J.P. Morgan Quantitative and Derivatives Strategy via The Daily Mail
A report by J.P. Morgan Quantitative and Derivatives Strategy, released around 20
May 2020, supports the argument that lockdowns did not help stop the spread of the
virus. The J.P. Morgan figure 1 chart shows that many US states saw a lower rate of
transmission after lockdowns were ended. J.P. Morgan figure 2 shows that most
countries saw their infection rates fall after lockdown.
Deaths caused by the lockdown
Alistair Haimes, a data professional who writes for The Critic <
https://thecritic.co.uk/author/alistair-haimes/> , posted the chart below showing
weekly deaths at home registered with the Office for National Statistics. The majority
of these do not have COVID-19 mentioned in the death certificate. It shows a
disproportionate number of deaths at home over the 5-year average, indicating that
these are likely to have been caused by the lockdown.
https://evidencenotfear.com/evidence/ 12/2803/08/2020 The evidence - Evidence Not Fear
Source: Alistair Haimes <
https://twitter.com/AlistairHaimes/status/1270282595931127815 on Twitter, 9 June
2020
Similarly, the InProportion2 project released the following chart showing the
proportion of weekly deaths due to COVID-19 in the context of total deaths during the
1999/2000 flu season. The blue bars show the 2020 lockdown deaths not attributed to
COVID-19. Interestingly, the fewer people died during the April 2020 peak than in
January 2000.
Source: InProportion2 updated 23 June 2020 < http://inproportion2.talkigy.com/>
Buggy modelling code
Code reviews of the Imperial College modelling software <
https://evidencenotfear.com/tag/imperial-college/> written by Professor Ferguson
https://evidencenotfear.com/evidence/ 13/2803/08/2020 The evidence - Evidence Not Fear
< https://evidencenotfear.com/tag/professor-neil-ferguson> began to appear in early
May 2020. The comments from professional programmers were scathing. They
found it badly written, full of bugs and produced random results. One reviewer went
on to say:
“This Ferguson Model is such a joke it is either an outright fraud, or it is the most
inept piece of programming I may have ever seen in my life.”
Martin Armstrong, 8 May 2020
There is only one reasonable conclusion we can draw from both the lockdown’s results
and the code reviews: the British Government’s decision to lock down the country was
based on bogus numbers.
Social distancing
Social distancing is a term that has recently gained popularity as the main way to
defeat COVID-19. It includes measures ranging from spaced queues at the
supermarket to complete lockdown of cities and countries. In this context, we do not
equate social distancing with the historically proven <
https://evidencenotfear.com/tag/pandemics/> practice of protecting vulnerable
people from flu-like viruses by isolating them from risk.
What is the scientific rationale for COVID-19 style social distancing?
No evidence for social distancing
According to Professor Joel Hay, PhD Health Economist at University of Southern
California, there is no scientific proof that social distancing prevents the spread of
coronavirus. He advocates that we should “do what we always do”: isolate the frail
and sick but don’t isolate the young and healthy. According to Professor Hay, herd
immunity is how we’ve solved the problem in the past. Social distancing is destroying
millions of lives and killing more people than it saves.
USC Professor Joel Hay says there is no s…
s…
https://evidencenotfear.com/evidence/ 14/2803/08/2020 The evidence - Evidence Not Fear
He is not alone, other medical experts < https://evidencenotfear.com/tag/medical-
experts/> including Dr. Sucharit Bhakdi < https://evidencenotfear.com/tag/dr-
sucharit-bhakdi/> , Professor John Ioannidis <
https://evidencenotfear.com/tag/professor-john-ioannidis/> and Professor Knut
Wittkowski < https://evidencenotfear.com/tag/professor-knut-wittkowski/> , argue
that there is no strong evidence for the kind of social distancing advocated by the UK
government.
Two metre rule
https://evidencenotfear.com/evidence/ 15/2803/08/2020 The evidence - Evidence Not Fear
The social distancing rules adopted by different countries is arbitrary and has no
scientific basis. Different countries use different rules ranging from the WHO‘s
recommended three feet (just under one metre) in Sweden and Asutria, 1.5 metres in
Germany and The Netherlands, to two metres in the UK and US.
Robert Dingwall from the New and Emerging Respiratory Virus Threats Advisory
Group (Nervtag) said Britain’s two meter rule was ‘conjured up out of nowhere’
because the government didn’t trust the public to keep 1 metre apart. UK Column, on
their 18 May 2020 programme, reported that the two meter distance was Public
Health England guideance only for hospital settings. It has no basis for the general the
public environment.
Face masks
Many people can now be seen in public wearing face masks. From 15 June 2020, face
coverings became mandatory < https://www.gov.uk/government/news/face-
coverings-to-become-mandatory-on-public-transport> on public transportation.
What is the evidence for their use? Currently there seems to be no strong medical
consensus on whether face masks actually help.
Physics professor Denis Rancourt published a paper on the science relevant to face
masks. After reviewing randomised controlled trial studies with measured outcomes
over the last decade, he found that none showed statistically significant advantage to
wearing a mask.
Nevertheless some proponents make the claim that masks are valuable for preventing
asymptomatic carriers from spreading COVID-19. However, WHO <
https://evidencenotfear.com/tag/who/> in fact state that healthy people only need to
wear a mask when taking care of a person with COVID-19.
Further, there seems to be growing evidence that wearing masks <
https://evidencenotfear.com/tag/face-masks/> at best gives a false sense of security
and at worst end up making healthy people more susceptible to getting sick. Dr. Jenny
Harries, the UK’s deputy chief medical officer, warned that masks could increase
risk of infection:
“For the average member of the public walking down a street, it is not a good
idea…In fact, you can actually trap the virus in the mask and start breathing it in.
Because of these behavioural issues, people can adversely put themselves at more
risk than less.”
https://evidencenotfear.com/evidence/ 16/2803/08/2020 The evidence - Evidence Not Fear
Even the HM Government’s guidance for restaurants, pubs, bars and takeaway
services, published 23 June 2020, states:
[T]he role of PPE in providing additional protection is extremely limited…face
covering may be marginally beneficial as a precautionary measure. The evidence
suggests that wearing a face covering does not protect you…evidence of the benefit
of using a face covering to protect others is weak.
R value
The UK government’s approach to relaxing the lockdown is based on the
reproductive value, sometimes referred to as the ‘R value,’ ‘R number‘ or ‘R rate.’
This is a measure of how a disease can spread through a population. The value itself is
the average number of people who can catch the disease from a single infected person.
For example, an R value of 3 means one person can pass on a virus to three others. If R
is below 1, a disease cannot spread enough to sustain an outbreak.
In this video, Sunetra Gupta, Professor of Theoretical Epidemiology at the University
of Oxford, explains that we don’t have enough information for the R value for
COVID-19.
According to Dr. John Lee, the R value is not a strong enough number to bear the
burden of any Government policy. ‘R‘ is an artificial figure calculated using
mathematical models which, as he says, “have repeatedly been found to reach wrong-
headed conclusions.”
https://evidencenotfear.com/evidence/ 17/2803/08/2020 The evidence - Evidence Not Fear
Despite these concerns from experts, the UK Government is using the R value as the
measure of whether COVID-19 is under control. We are told that the R value will be
used to justify easing lock-down or enforcing local lock-downs throughout the country.
However, there is a huge discrepancy with this approach. By the government’s own
data, the R value had already dropped below the important threshold of 1 before lock-
down was declared. Lock-down therefore did absolutely nothing to reduce the R value.
Source: AlistairHaimes, 5 May 2020 <
https://twitter.com/AlistairHaimes/status/1257677373048336389
Testing
https://evidencenotfear.com/evidence/ 18/2803/08/2020 The evidence - Evidence Not Fear
A lot has been made about testing for COVID-19 <
https://evidencenotfear.com/tag/testing/> but it is far from straightforward <
https://evidencenotfear.com/experts-explain-different-types-of-testing-for-covid-
19/> . The death totals can sound shocking when taken out of context so it is important
to compare them with the numbers the UK normally faces over a long period of time.
Furthermore, as American statistician Nate Silver writes, numbers are meaningless
unless you understand how they’re counted.
Types of tests
There are currently two types of tests being used for COVID-19:
PCR Testing is a lab test used to detect if the virus is currently present in the
patient. Sampling requires full personal protective equipment and results can have a
long turnaround time. It is also very error prone if not processed properly. Although
PCR testing is currently being used to confirm a COVID-19 infection, it seems the
inventor would have warned against PCR testing to detect a virus.
Antibody Testing, or serological testing, checks if a person has antibodies to the
virus. It is intended to detect if the subject has been exposed to the virus in the past.
Since COVID-19 is a newly identified disease, manufacturing for COVID-19 tests
need to be developed. There is a shortage of test kits and those currently in the
market are unreliable.
Testing procedures
The shortcomings of both types of tests means that mass testing is impractical. As a
result, many of the novel coronavirus victims we see reported in the statistics are
‘assumed positive’. The hospitals may not have tested the patient for COVID-19 but
assumed the death was caused by the virus. The assumption is based on whether a
patient presents with COVID-19 symptoms. This is problematic because COVID-19
symptoms are very similar to the flu.
This needs repeating: it is almost certainly the case that the majority of deaths in the
statistics were not tested for COVID-19. This makes the statistics you see on the news
worse than meaningless. In makes them misleading.
How Dr. Wolfgang Wodarg sees the curren…
curren…
https://evidencenotfear.com/evidence/ 19/2803/08/2020 The evidence - Evidence Not Fear
Epidemiologist Dr. Wolfgang Wodarg on coronavirus testing.
Test-positive cases are not increasing exponentially.
Dr. Wolfgang Wodarg, an epidemiologist and lung disease specialist, explains
coronavirus testing in an inverview above. We are also told of the exponential rise in
cases but according to Felix Scholkmann < https://scholar.google.com/citations?
user=tLLUytoAAAAJ&hl=en> , a biophysicist at University Hospital Zurich, test-
positive cases < https://evidencenotfear.com/the-rate-of-positive-tests-in-the-us-
france-germany-and-switzerland-is-not-increasing-exponentially/> are not
increasing exponentially in the US, France, Germany and Switzerland.
https://evidencenotfear.com/evidence/ 20/2803/08/2020 The evidence - Evidence Not Fear
Furthermore, the current tests used by most countries have both high false positive
and false negative < https://evidencenotfear.com/tag/testing+errors/> rates. Some
are so bad that samples taken from a goat and a pawpaw fruit showed COVID-19
positive.
So, what do we know about COVID-19 testing?
The numbers are flawed because current testing methods have an unacceptably
high error rate.
Many people counted as COVID-19 victims actually died of something else.
(Reports from Italy back this up.)
The numbers resulting from these tests should not be used to drive public policy.
Government intervention
Some commentators have said that earlier government intervention, such as closing
down boarders or locking down sooner, would have stopped COVID-19 in its tracks
before it could have become a serious problem.
In contrast, experts in various fields, including Professor Dolores Cahill, Professor
Isaac Ben-Israel and Professor Yoram Lass, all say that there is nothing you can do
to stop the spread of coronvirus type diseases; they’ll spread and peak regardless of
measures taken.
Immunologist Professor Cahill and mathematician Professor Ben-Israel both come up
with similar lifespans. Coronavirus epidemics last between 4 to 10 weeks in each
location as it circles the globe. As of early June 2020, actual data from different
countries with COVID-19 outbreaks have borne this out.
According to Professor Lass, former Israeli Health Ministry chief, “A government
cannot stop a virus. What stops a virus is natural immunity. It’s impossible to stop a
virus by government decree.”
https://evidencenotfear.com/evidence/ 21/2803/08/2020 The evidence - Evidence Not Fear
< https://evidencenotfear.com/professor-dolores-cahill-james-delingpole-
channel/>
Statistics
Official mortality rate statistics are publicly available and anyone can download the
data for analysis. All the numbers so far show that COVID-19 is far from being a
‘once in a century’ plague. Though the numbers in news reports give the impression of
an unprecedented death toll, we can see they are not at all extraordinary when placed
in a historical perspective.
Source: Hector Drummond Magazine, 29 June 2020
https://evidencenotfear.com/evidence/ 22/2803/08/2020 The evidence - Evidence Not Fear
Novelist Hector Drummond < https://hectordrummond.com/> decided to look at
the annual death figures for England and Wales from the Office for National
Statistics < https://evidencenotfear.com/tag/Office-for-National-Statistics> . After
graphing the numbers < https://hectordrummond.com/2020/06/29/this-is-what-
we-shot-ourselves-in-the-foot-for/> all the way back to the turn of the twentieth
century, he found that the numbers for 2020 (shown on the right) cannot even be
considered a major spike over the course of the century. Analysis from other sources
below support this view.
EuroMOMO
EuroMOMO is an agency that monitors deaths across Europe. Data provided by
EuroMOMO is used by governmental agencies including Public Health England. The
chart below compares death levels in Week 2 of 2017 with Week 14 of 2020. The darker
blue means more deaths.
Source: EuroMOMO European mortality bulletin week 14, 2020 <
https://www.euromomo.eu/index.html>
Week 14 and 15 was roughly the peak of the deaths throughout Europe in 2020. How
different is the 2017 chart from 2020? If governments did not shut down society in
2017, why are they doing so now?
By week 17, excess mortality in most of the surveyed countries have dropped to
moderate or below. The UK, which is holding to its lockdown policy, remains high.
https://evidencenotfear.com/evidence/ 23/2803/08/2020 The evidence - Evidence Not Fear
Source: EuroMOMO European mortality bulletin week 17, 2020 <
https://www.euromomo.eu/index.html>
Office for National Statistics
Our commentary on the Office for National Statistics <
https://evidencenotfear.com/tag/Office-for-National-Statistics> data has been
archived separately.
We have made contact with the inProportion2 < http://inproportion2.talkigy.com/>
project which collects and analyses statistics from the Office for National Statistics,
National Health Service, Public Health England and EuroMOMO. Please head over
there < http://inproportion2.talkigy.com/> for a more in-depth analysis and
comparisons of the numbers.
COVID-19 in proportion
The charts below provide a simple way of viewing COVID-19 deaths in proportion to
other deaths.
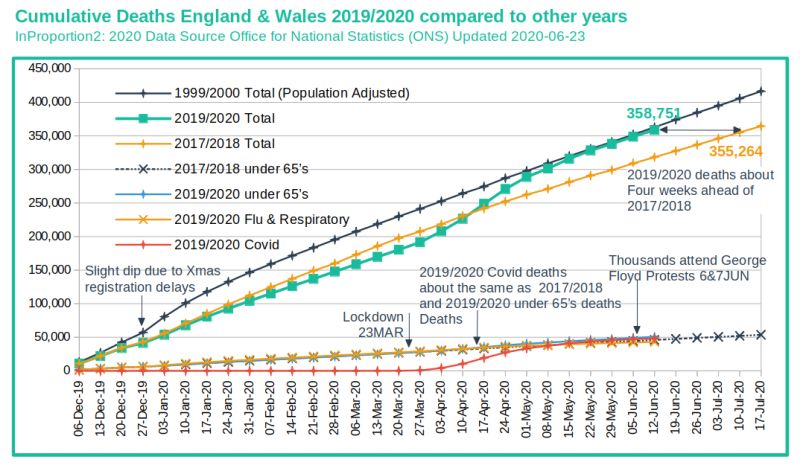
The InProportion2 chart below compares cumulative totals of COVID-19 deaths with
totals for 2000 and 2018. As of late June 2020, we see there is not a huge difference
between them. We did not shut down the world economy in previous years yet the
entire globe is now at a standstill for COVID-19. Why?
https://evidencenotfear.com/evidence/ 24/2803/08/2020 The evidence - Evidence Not Fear
Source: InProportion2 updated 23 June 2020 < http://inproportion2.talkigy.com/>
COVID-19 is shown compared to the 1968/69 Asian Flu below.
Source: InProportion2 updated 5 May 2020 < http://inproportion2.talkigy.com/>
Understand the numbers
Keep these observations in mind the next time you hear about the rapidly rising death
toll on the nightly news:
Dr. John Lee, a professor of pathology and former NHS consultant pathologist,
explains how to interpret the numbers.
Nate Silver, an American statistician, tells us why coronavirus case counts are
meaningless.
Steve Goodman, a professor of epidemiology at Stanford University, says that
confirmed coronavirus cases is an ‘almost meaningless’ metric.
https://evidencenotfear.com/evidence/ 25/2803/08/2020 The evidence - Evidence Not Fear
Curve Analysis
The information in this section may take a bit of patience but you’ll be rewarded with
the ability to better understand charts.
Andrew Mather, a mathematician and financier based in the UK, offers a series of
videos < https://www.youtube.com/channel/UCmFDE8P6_M-
C4HTOuWwm4Dg/videos> analysing the COVID-19 data released by various
governmental and health bodies.
Coronavirus Fact Not Fear - Curve Analysi…
Analysi…
A primer on curve analysis
Coronavirus Fact not Fear - Government Ki…
Ki…
https://evidencenotfear.com/evidence/ 26/2803/08/2020 The evidence - Evidence Not Fear
Why the crisis was over before lock-down
Suggest evidence
If you would like to post some evidence or information that you think would be
helpful for other readers, please use the comment form below. The suggestions are
moderated and anything off topic may be moved to our discussions page.
Please read our comments disclaimer < https://evidencenotfear.com/legal-
information/#comments-disclaimer> before posting.
Next steps
By now you will hopefully be reassured that COVID-19 is not a the doomsday virus
we hear about in the news. What next?
Bookmark the resources page to keep up-to-date on the latest news articles and
publications.
Share your opinions, experiences and research with other readers.
Do not sit back and let others decide your future. Take action now.
RESOURCES DISCUSS TAKE ACTION
© 2020 Evidence Not Fear < https://evidencenotfear.com/> Up ↑
https://evidencenotfear.com/evidence/ 27/2803/08/2020 The evidence - Evidence Not Fear https://evidencenotfear.com/evidence/ 28/28
You can also read


