The global pandemic has accelerated the urgency to build out resilient supply chains and increased demand for cold storage space, bolstering the ...
←
→
Page content transcription
If your browser does not render page correctly, please read the page content below
Special Report | 10 August 2020
Supply Chain Resiliency and Accelerated Demand
for Cold Storage Bolstering Need for Infill Logistics Space
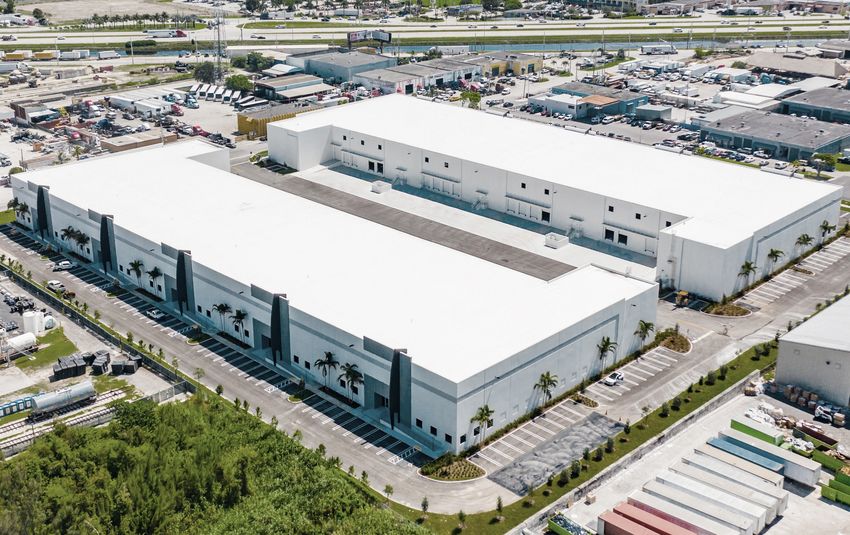
South River Industrial - Miami, FL
The global pandemic has accelerated the urgency to build out resilient supply chains and increased demand for cold
storage space, bolstering the need for infill space among an already active logistics real estate market.
Special Report
Supply Chain Resiliency and Accelerated Demand for Cold Storage
Bolstering Need for Infill Logistics Space
U.S. logistics real estate fundamentals were strong heading into the crisis, with high occupancy levels and widespread e-commerce adaptation
driving demand for infill locations. Following the onset of the global pandemic, the shift toward e-commerce surged in response to stay-at-
home orders, creating a new group of online shoppers. In many ways, Elion views the pandemic as an accelerator of trends that were well in
motion before the crisis took place. The shift in consumer behavior toward e-commerce is expected to continue to advance in a post-pandemic
world, making the current environment a secular trend instead of a real estate cycle. This “new normal” has accelerated the urgency to build
out resilient supply chains and increased demand for cold storage space through the surge in online grocery shoppers, bolstering the need for
infill space among an already active logistics real estate market.

The Need for Supply Chain Resiliency
Over the past few years, supply chains have evolved to be more                          greater supply chain resilience requires mitigating risk along the first,
diversified and regionalized to strategically service a shifting                        middle, and last mile of the distribution journey.
economy in response to e-commerce adaptation, trade and
geopolitical tensions, technological advancements, and rising                           Supply chain models should be refocused to include:3
transportation costs. The onset of the pandemic combined with                           • Supplier diversification and multimodal transportation options
worldwide shutdowns fast-tracked the need to build out resilient                                To avoid overreliance on any one country or company as
supply chains, exposing inventory-control failures that didn’t exist                            a supply source, companies should look to reduce supply
pre-pandemic. E-commerce sales were up 104% in June 20201,                                      chain dependency through onshoring and nearshoring.
generating $73.2 billion in online spending2, compared to June
2019. This spending is tracking above more than half of the usual                              Companies should consider port diversification strategies
holiday (Nov-Dec) levels. Unable to meet the surge in demand,                                  to avoid reliance on a single port in one region as well as
supply chains have been forced to accelerate their diversification                             multimodal transportation options close to parcel hubs to
strategies to mitigate future shock and volatility risk as well as                             mitigate risks associated with trucking capacity constraints
increase inventory carry.                                                                      and increased freight costs.
                                                                                        • Increase local inventory
   U.S. 2020 Online Retail Spend, Actual vs. Expected                                          The pandemic highlighted the downside of just-in-time
                                                                                               lean inventory principles evidenced by the rapid depletion
                                                                             Actual            of necessity inventories leaving supermarket shelves
                                                                             Expected
                                                                                               empty. Maintaining higher stock levels will generate more
                                                                                               warehousing demand closer to consumption points and
                                                                                               service locations, especially among companies engaged
                                                                                               in the production and distribution of necessities.
         Average Holiday Spend
                                                                                        • Adaptation to the new retail landscape
                                                                 +$77B                         Supply chains, particularly those linked to the food and
                                                                 Difference                    beverage industry, may seek to leverage existing retail
                                                                                               infrastructure to coordinate delivery and collection of
                                                                                               goods near and around city centers.
                                                                                        • Automation investment
                                                                                               Not only have inventory constraints contributed to
                                                                                               e-commerce platforms unable to satisfy demand spikes
          Source: Adobe Digital Economy Index. Adobe Analytics. June 2020.                     but also labor shortages over the fear of the virus have
                                                                                               compounded the issue. Flexible automation and robotics
New inventory controls are calling for larger and more diverse                                 solutions can yield significant benefits to mitigating labor
product supply in closer proximity to end-users, according to CBRE’s                           risks as well as enhance a company’s adherence to
Global Trade Report. By increasing a company’s “buffer stock” to                               hygiene protocol.
quickly meet surges in demand, the need for logistics space will
increase. A recent report by JLL cited the increased demand for                         Refocusing the traditional supply chain model to address these
logistics real estate could reach an additional 1 billion square feet                   vulnerabilities has led to massive increases in infrastructure spending
by 2025.                                                                                and modernization of existing logistics hubs, according to a report
                                                                                        issued by CBRE. Within the U.S., emerging logistics real estate hubs
It is not only infill urban areas for regionalized distribution that are                in the Southeast should garner the most attention from occupiers and
garnering the most attention from occupiers and investors. Building                     investors while the West Coast is projected to remain a major player.4

                                                                                                                                  Special Report | 10 August 2020   2
The Case for Cold Storage Looking Forward
The pandemic has significantly disrupted the food industry, Though some level of pause took place among stakeholders at the
increasing online grocery sales by more than 100% at the onset onset of the crisis, Elion has continued to see demand for logistics
of the quarantine.5 According to research released by Brick Meets real estate space both from e-commerce and non-e-commerce
Click, online grocery sales have climbed month-over-month since tenants. Benefitting from the secular tailwinds of the crisis, we project
March. As the world slowly began to reopen, consumers have not we’ll continue to see demand from investors for logistics real estate
shown any interest in returning to the store. June grocery sales were well into the future. Based on the latest CBRE estimates, annual net
up 9% to a record $7.2 billion, compared to May’s $6.6 billion.6 This absorption for logistics real estate will total more than 333 million
includes both groceries delivered directly to consumer homes (D2C) square feet by 2022, leading to annual rent growth of 5.7%.8
as well as those buying online and picking up in-store (BOPIS).
Industrial Rent Forecast
U.S. Online Grocery Delivery & Pickup*
9.00
$ per Sq. Ft.
Performance Metrics Aug March April May June Current Forecast
2019 2020 2020 2020 2020 8.00
Sales $1.2 B $4.0 B $5.3 B $6.6 B $7.2 B 7.00
Q4 2019
Forecast
6.00
Spend $72 $85 $85 $90 $84
(Avg. per order)
5.00
Orders 16.1 M 46.9 M 62.5 M 73.5 M 85.0 M
4.00
3.00
Customers 16.1 M 39.5 M 40.0 M 43.0 M 45.6 M
Q1 0
2
23
25
24
Q1 1
Q1 10
Q1 6
Q1 7
Q1 9
Q1 4
Q1 5
Q1 8
Q1 3
Q1 2
Q1 11
(# Active)
2
1
1
2
1
1
1
2
1
1
1
20
20
20
20
20
20
20
20
20
20
20
20
20
20
20
20
Q1
Q1
Q1
Q1
Frequency 1.0 1.2 1.6 1.7 1.9
(Monthly avg./customer) Source: CBRE Research, Q1 2020
*Excludes online orders shipped to home via common or contract parcel carriers. Tenants in the logistics real estate space occupy a wide variety of
Source: Brick Meets Click/Mercatus Grocery Survey. March – June 2020, and August 2019. tenant types, from retailers and wholesalers to service providers. As
the adoption of e-commerce continues to accelerate, we anticipate
With online grocery and delivery services becoming an integral vacancy rates will continue to tighten in supply-constrained markets
part of how consumers shop, cold storage in and near large as tenants compete to locate near large population centers further
population centers is projected to generate the highest demand for applying upward pressure on rents. Therefore, given the current
logistics real estate space, according to CBRE. To meet the demand environment, we have not seen and do not project to see much in
for D2C and BOPIS, an additional 75 to 100 million square feet terms of distress among logistics real estate pricing across these
of cold storage space will be needed over the next five years.7 To markets. Valuations should remain strong with increased rents
put it into perspective, the U.S. Department of Agriculture (USDA) justifying the cap rates.
estimates that there are only 214 million square feet of industrial food
commodity cold storage space in the U.S. The relatively small number Opportunities for transactions may exist with private owners seeking
of operators and specialized nature of the industry—barriers to entry liquidity due to other financial stressors, resulting in, for example,
such as high construction costs and restrictive government regulations sale-leaseback scenarios. Though price discounting is not anticipated
regarding food-grade storage—have prevented overbuilding and in these scenarios, there would still be room for upside through value
limited new construction. creation opportunities.
Special Report | 10 August 2020 3END NOTES
1 According to Signifyd Inc’s E-commerce Pulse data. June 2020.
2 Adobe Digital Economy Index. Adobe Analytics. June 2020.
3 Refocusing Supply Chains in the COVID-19 Era. CBRE. May 2020.
4 The Changing Flow of International Trade. CBRE. July 9, 2020
5 Growth from March 13 – 15 compared to the baseline period of March 1 – 11, 2020. Adobe Analytics Digital Economy Index 2020.
6 June 2020 Online Grocery Scorecard: Growth in sales & HH penetration continues. Brick Meets Click. July 6, 2020.
7 2019 U.S. Food on Demand Series: Cold Storage Logistics Unpacked. CBRE Research.
8 U.S. MarketFlash: Annual Industrial Demand to Hit 333 Million Sq. Ft. by 2022. CBRE. June 25, 2020
9 Elion is registered as an investment adviser with the SEC under the Investment Advisers Act of 1940 (the “Advisers Act”).
Registration as an investment adviser with the SEC or with any state securities authority does not imply a certain level of skill or training.
IMPORTANT NOTICE
Neither Elion nor any of its affiliates makes any representation or warranty, express or implied, as to the accuracy or completeness of the information
contained above and nothing contained herein may be relied upon as a promise or representation whether as to the past or future performance. No
representations are made as to the accuracy of any targets, estimates, approximates or projections or that such targets, estimates, approximates or
projections will be realized. Forward-looking statements are based upon certain assumptions and information available on the date hereof. Actual
events are difficult to predict.
ABOUT ELION PARTNERS
Elion Partners is a real estate investment firm and registered investment adviser.9 As a vertically integrated platform, Elion is both a fiduciary and
operator, managing more than $1.5 billion in real estate assets through closed-end funds and permanent capital investment vehicles. As long-term
stewards of capital, principals of Elion invest personally in each of the firm’s funds to ensure alignment of interests and transparency with its capital
partners. Elion is a minority-owned firm.
Elion Partners
Miami
3323 NE 163rd Street
Suite 600
Miami, FL 33160
+1 (305) 933.3538
New York
445 Park Avenue
Suite 16E
New York, NY 10022
Seattle
1700 7th Avenue
Suite 116 #121
Seattle, WA 98101
www.elionpartners.com
Special Report | 10 August 2020 4You can also read