The influence of Ambient Meterology on Nanoparticle Concentration in an Urban Setting - Mr Prashant Kumar Dr Paul Fennell (presenting) Prof. Rex ...
←
→
Page content transcription
If your browser does not render page correctly, please read the page content below
The influence of Ambient
  Meterology on Nanoparticle
Concentration in an Urban Setting

        Mr Prashant Kumar
    Dr Paul Fennell (presenting)
         Prof. Rex Britter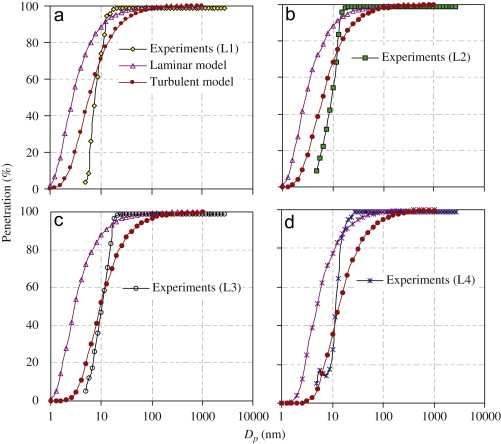
Background
• Vehicles are the major source of ultrafine (
Ultrafine Particles
• May be more toxic than larger particles per
  unit mass.
• Contribute little to total mass, and so are
  currently subject to little regulation.
• Contribute most to the PNC (particle
  number count).
• Are more difficult to measure than larger
  particles.
Our Research Methodology
To make measurements using a time resolved
  particle spectrometer (DMS 500), in conjunction
  with time-resolved measurements of ambient
  windspeed and direction (and other
  meteorological conditions).
These measurements should allow better
  understanding of dispersion, deposition and
  ventilation of nano-particles from the urban
  environment.
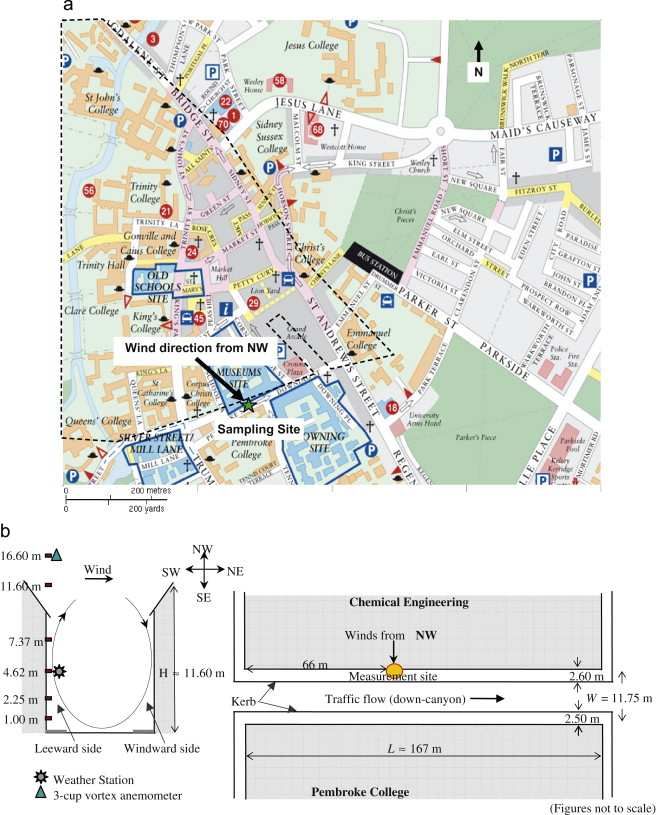
Location of Experiments
• Engineering Department, Cambridge
  (preliminary experiments).
• Chemical Engineering Department, Cambridge
  (protracted sampling campaign).
• Possibly better represent the results in small
  towns and less busy cities than measurements
  made in larger metropolitan areas.
• That’s our story, and we’re sticking to it.
You are here
Detailed Description of Site

Rooftop and roadside measurement of windspeed.
Roadside measurement of ambient temperature and humidity.
CCTV camera sampled traffic volume, backed up with manual counts.
Question 1.
• What is the variation of the particle
  number count with height in an urban
  canyon.
• Alternatively – What height should we
  sample at to get a measurement which is
  representative of the exposure of the
  general population?
Pseudo-simultaneous Vertical
Variation
• One instrument, sampling from a variety of different heights
• Novel sampling apparatus used with DMS (switiching
system)
• 24 hours total sampling
– 7.5 m high pole erected outside department
– Constantly attended (Safety)
– 4 sampling probes, one DMS, novel switching system
– Sampled for 60 s at each height, first 15 s discarded (clear lines,
equalise pressures and sample flows, etc).
– Local windspeed recorded every minute by a vortex anemometer
situated on a pole on the top of the department.
– Wind direction half-hourly from AT+T weather station (Engineering).
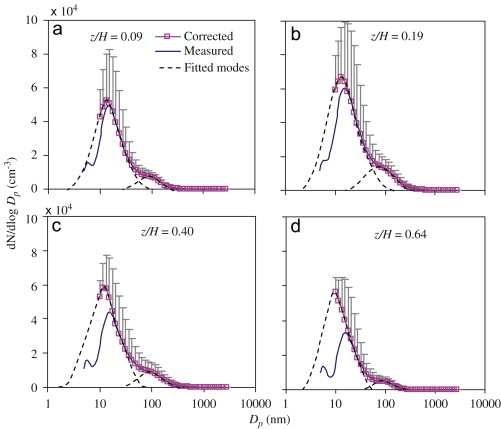
Correlation of average windspeed between the two almost perfect.After correction for losses in sampling tube Before correction for losses in sampling tube
Correction for losses in sampling tubes

                                   Correction for losses in
                                   tubes by sampling from a
                                   diesel-engined car and a
                                   number of other
                                   aerosols.
                                   Though the flow is
                                   laminar through the tube,
                                   the losses in the tube are
                                   higher than would be
                                   predicted by models
                                   available (Hinds) in the
                                   literature.
                                   Confirmed / confirms
                                   independent experiments
                                   (Cambustion) using both
                                   DMS and CPC-SMPS.
Vertical Variation
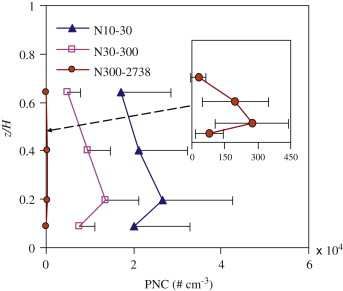
Maximal concentration of
particles at around 2.25 m
(z/H =0.2)
Dips towards road level, and
exponentially decreases
with height in the canyon
Similar profile has been
observed for PM / gaseous
pollutants in the past,
though others believe the
decay is exponential with
height.
Many studies are too widely
spaced to observe this
feature.
Further work is necessary.Why is this important? • If the vertical variation of nanoparticle concentration with height is not correctly known, it will not be possible to accurately determine exposure levels for the general population, since sampling often takes place at only one height (and this is frequently high up in the canyon).
Question 2.
• How quickly do ambient particles clear
  from urban street canyons?
Ventilation Rate
  • Ventilation is the process of diluting the air
    in the canyon with “clean” air from above.
                                                     Particles are
“Clean” air flows above rooftop                      transported out of
                                                     the canyon

                                                  Buildings
               Buildings

                                  Possible Vortex formation?
Dependence of PNC on Wind
Speed, Traffic Volume and
“Background”
Ci − j = aT U r + b m n
Concentration in a Traffic Windspeed Background
particular size range volume
IF particles are emitted in the exhaust of a vehicle (or the dilution and condensation
processes in the exhaust are little affected by the ambient conditions):
m = 1, n = -1.Variation of the Number of Particles
with Traffic Volume
• Under almost all circumstances, the number of
particles observed is directly proportional to the
volume of traffic.
• Possible exceptions include rooftop level
measurements, due to the scavenging effect of
emissions from traffic on the background
particles present.
• To investigate the effect of windspeed and
direction on the dilution of particles, the number
of particles observed in each 15 minutes was
divided through by the volume of traffic in that
quarter of an hour.10 – 30 nm (nucleation) 30 – 300 nm (accumulation)
1000
(a) (b)
100
Ni-j/T (# cm )/(veh h/2 )
-1
10
-3
1
fit results (N10-30 ) : fit results (N 30-300 ) :
n = 0 and 1 n = 0 and 1
n = 1.35 n = 0.69
0
0 1 -1 10 0 1 -1 10
U r (m s ) U r (m s )
Plotted above is particle count per unit volume of traffic plotted logarithmically
against the windspeed, for winds from the SW (along canyon).
Different methods of fitting the model to the data were tested; it was found that
the best model was one which split the measurements into a wind independent
(n = 0) and a wind dependent (n=-1) regime.
Minimising the difference between the model and the experimental results
yielded the critical windspeed.Canyon Ventilation • This means that up till a certain critical windspeed, the dilution processes in the canyon are approximately independent of the above rooftop windspeed. Here, traffic-induced turbulence probably governs dilution. • Above the critical value, the dilution is proportional to the windspeed, so wind-induced turbulence governs dilution of particles. • The critical value is higher for smaller particles (10 – 30 nm) than for larger ones (30 – 300 nm), a fact which requires further study.
Conclusions
• The dispersion of ambient nanoparticles is
  complicated by an urban setting.
• Time-resolved measurements over a broad
  spectrum of particle sizes allows much more
  detailed modelling of dispersion, dilution,
  deposition and transformation processes.
• The concentration of particles is maximal at
  around breathing height.
• A model where concentration is independent of
  windspeed up to a critical windspeed and
  inversely proportional to windspeed thereafter
  fits our measurements best.
Acknowledgements
• Dr J.S. Dennis and Prof. A.N. Hayhurst (loan of
  DMS 500).
• Cambustion Ltd (especially J. Symmonds loan of
  numerous sampling heads, technical advice).
• Peter Foreman, Chemical Engineering (help with
  sorting out sampling location).
• Electronics, Chemical Engineering (building
  multi-head solenoid switching system).
• John Blamey and David Langley (help with
  some measurements).
• Workshop, Chemical Engineering (disruption!).
You can also read