The Influence of COVID-19 Stay at Home Measures on Fire Statistics Sampled from New York City, London, San Francisco, and Tokyo
←
→
Page content transcription
If your browser does not render page correctly, please read the page content below
Fire Technology
Ó 2021 The Author(s), under exclusive licence to Springer Science+Business Media, LLC, part of Springer Nature
Manufactured in The United States
https://doi.org/10.1007/s10694-021-01177-z

The Influence of COVID-19 Stay at Home
Measures on Fire Statistics Sampled
from New York City, London, San Francisco,
and Tokyo

       Sayaka Suzuki *, National Research Institute for Fire and Disaster
          (NRIFD), Chofu, Tokyo, Japan
       Samuel L. Manzello , National Institute of Standards and Technology
          (NIST), Gaithersburg, MD, USA

     Received: 27 April 2021/Accepted: 2 September 2021

     Abstract. The COVID-19 pandemic kept people at home, in either a voluntary or
     non-voluntary capacity, in many countries. These suggested countermeasures were
     prominent in the so-called initial waves of the pandemic, especially from March 2020
     to May 2020. As people stayed home, in many cases restaurants were closed. As a
     result, people spent more time in their kitchen, not only to cook meals but also as a
     personal hobby. It is well known that cooking fires are a main cause of fires in resi-
     dential homes. In this study, the change in the number of cooking fires in residential
     homes as well as the number of residential fires during these COVID-19 countermea-
     sure periods were examined in four cities: New York City (USA), San Francisco
     (USA), Tokyo (Japan), and London (UK). The time period examined was from Jan-
     uary to June in 2020 in order to grasp overall effects of stay-at-home measures on
     fire incidents. The number of cooking fires and residential fires increased in Tokyo
     and San Francisco, while the number of cooking fires in New York City (no data
     was obtained for cooking fires in London.) and the number of residential fires in
     New York City and London remained similar to previous years.

Keywords: Fire statistics, Cooking fires, Residential fires, COVID-19, Stay-at-home measures

1. Introduction
The global pandemic from COVID-19 resulted in not only loss of lives but a
major adjustment to millions of people’s situations in many countries. The
COVID-19 pandemic forced people to stay at home. In some countries, this was
voluntary while in other countries, this was in a non-voluntary capacity. People
stayed home, and it was impossible to dine-in as restaurants were ordered to close
their dine-in service. As a result, people spent more time in their kitchens, not
only to cook meals but also as a personal hobby [1, 2].

      *Correspondence should be addressed to: Sayaka Suzuki, E-mail: sayakas@fri.go.jp

                                                                                                                 1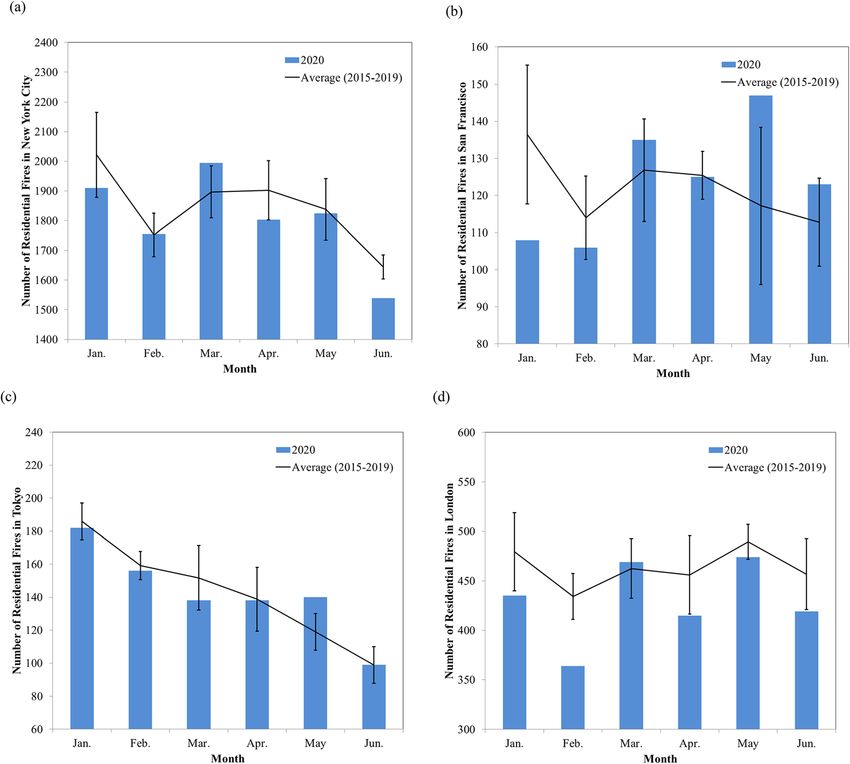
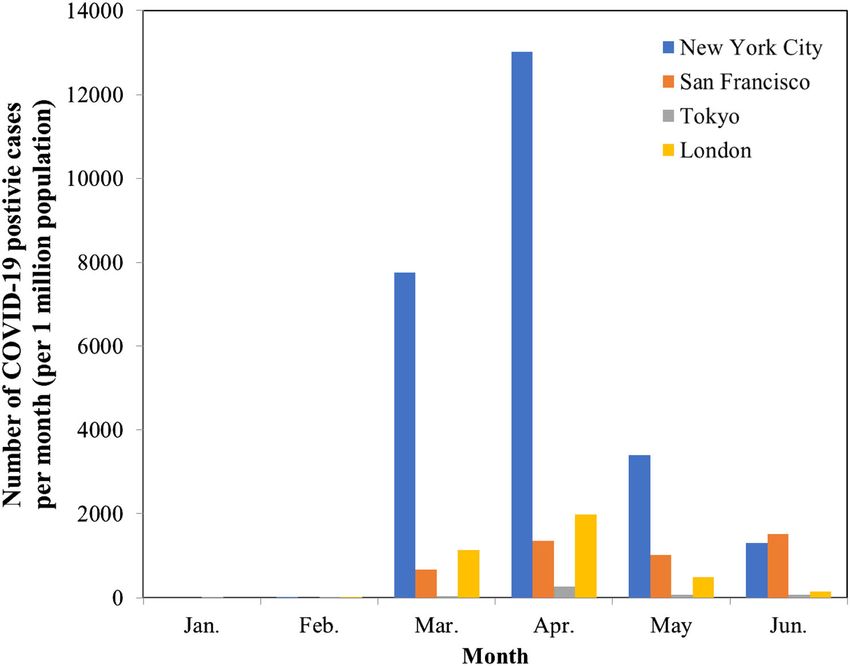
Fire Technology 2021

   It is well known that cooking fires are a main cause of fires in residential
homes, along with cigarette induced fires [3–5]. The number of residential fires
increases in the afternoon to night, when people stay home, and are awake, peak-
ing around dinner time. Cigarette induced fires, and resulting deaths, increase at
night when people are sleeping [3–5].
   In the case of the COVID-19 pandemic, many people stayed home and worked
from home. While it is not possible to determine cooking habits of all of residents
on a global basis, it is reasonable to assume people cooked more due to the
restaurant closures. Thus, it is expected people staying home and cooking more
often may have effects on fire incidents during the COVID-19 pandemic. In this
study, the change in the number of cooking fires in residential homes, as well as
the number of residential fires, during so-called initial waves of the COVID-19
pandemic were investigated. Four cities were examined: New York City (USA),
San Francisco (USA), Tokyo (Japan), and London (UK).

2. Methods
2.1. Selection of Cities
An important part of understanding fire losses in many countries consider the col-
lection and reporting of annual fire statistics. In the UK, statistics were collected
and reported from the loss of urban structures during World War II. In 1976, the
USA created the National Fire Incident Reporting System, known simply as
NFIRS. Similarly, in Japan, urban fire statistic collection began after World War
II.
   Four cities, New York City (USA), San Francisco (USA), Tokyo (Japan), and
London (UK), were selected in this study. These cities were investigated based on
the following considerations: (1) these cities are large enough to have relatively
large number of cooking fires per month, (2) it was easy to access raw data, and
(3) they had different COVID-19 situations and countermeasures.
   During the period of examination, New York City was considered one of the
hardest hit by the COVID-19 pandemic, as evidenced by the large number of
reported cases as shown in Fig. 1. San Francisco reported far fewer cases of
COVID-19 during this period. New York City and San Francisco implemented
lockdown measures [6–9]. Tokyo did not have so many reported COVID-19 cases
but was on alert far earlier than the other cities examined here due to the Dia-
mond Princess cruise ship situation. Tokyo was never locked down by government
order but declared a state of emergency, with voluntary stay-at-home orders [10].
The UK was hoping to achieve herd immunity initially without lockdown but
quickly changed course and resorted to lockdown measures [11, 12]. Table 1 is
summary of each city’s approach and lockdown duration.
The Influence of COVID-19 Stay at Home Measures

Figure 1. Number of COVID-19 positive cases per month (per 1
million population) calculated based on open data source [13–16].

2.2. Data Collection
The fire incident data was obtained from open database sites [17–21]. All of these
data across four cities were ‘‘reported’’ data, and not corrected for analysis, as the
purpose of this study is to grasp the overall effects across the different cities.

3. Analysis
Comparing fire statistics among different countries needs attention as definitions
may differ. As a baseline, the fire statistics of each city from the past 5 years was
compared first. Some of analysis on the fire trend has already been published else-
where [20–22]. Attention was paid as terminology or categories may be different
among countries. This is an issue discussed also elsewhere when comparing the
fire statistics among countries [23]. It is important to mention that the data were
‘‘reported fires’’, thus unreported fires—most of smaller fires, are not included
[24].
   The number of residential fires, and the number of cooking fires in the first
6 months of 2020 were compared with those in the first 6 months of 2015 to 2019
Fire Technology 2021

Table 1
Approach and Lockdown/Stay-at-Home Duration of Each City

               New York City          San Francisco                Tokyo                   London

Contents     Stay-at-home (All     Shelter in place or      Declaration of State     Lockdown. (All
  of lock-   non-essential busi-   stay-home (all non-      of Emergency. (all       non-essential busi-
  down/      ness closed. Resi-    essential business       non-essential busi-      ness closed. Resi-
  stay-at-   dents are allowed     closed. Residents        ness closed. Resi-       dents are allowed
  home       only ‘‘essential’’    are allowed to go        dents are allowed to     only ‘‘essential’’
  measures   purpose. Order is     outside for only         go outside for only      purpose. Order is
             mandantory, while     ‘‘essential’’ purpose.   ‘‘essential’’ purpose.   mandantory. Limi-
             it was indicated no   Order is mandan-         Order is not man-        tation on outside
             individual would be   tory.)                   dantory.)                activities.)
             fined.)
Lockdown     March 22nd to June    March 19th to May        April 8th to May         March 26th to July
  duration   7th                   7th                      26th                     4th
  or emer-
  gency
  declara-
  tion

(average value). In this study, a comparison of past 5 years data was selected for
comparison. The use of 5-year average data has been presented elsewhere [20, 21].
In addition, the purpose of this study is to see the ‘big picture’ of how stay-at-
home measures influenced fires in four cities.
   The average data of 2015 to 2019 was used for comparison. The data in Lon-
don needs an attention, as there were decreases in the total number of fires, and
residential fires in last 5 years [22]. For London, the data [19] does not contain
information on cooking fires, and no comparison with that in London was per-
formed. Table 2 provides ‘‘categories’’ used to count the number of each fire.

4. Results
4.1. Trend on the Number of Residential Fires
The residential fires in all four cities are shown in Fig. 2. The number of residen-
tial fires in both New York City (Fig. 2a) and San Francisco (Fig. 2b) during the
first six months of 2020 are within the uncertainties of average (2 standards devia-
tions) with a small increase observed in San Francisco’s May. For Tokyo, the
number of residential fires in 2020 remains similar to the average except May,
which shows an increase (Fig. 2c). The number of residential fires in 2020
(Fig. 2d) in London is lower than the average of last 5 years, due to the decrease
in the number of residential fires in general in London. Overall, the number of
residential fires in those four cities was observed to be similar to average, expect
that in May in Tokyo.
Table 2
Terminologies and Categories Used to Analyze for Fires, Residential Fires and Cooking Fires
New York City San Francisco London Tokyo
Residential INCIDENT_CLASSIFICATION_GROUP Primary Situation-100 s (including 1600 Incident Group - Fire Provided in refer-
fires Structural fires but excluding natural fire, other, brush Stop Code Description - ence [20]
INCIDENT_CLASSIFICATION - or brush-and-grass mixture fire, grass Primary Fire
‘‘Multiple Dwelling’’ ‘‘A’’, ‘‘B’’ and fire) PropertyCategory-Dwelling
‘‘Private Dwelling Fire’’ Area of Fire Origin - Multifamily
dwelling, 1 or 2 family dwelling
Cooking INCIDENT_CLASSIFICATION - Multiple Primary Situation - Cooking fire, con- – Provided in refer-
The Influence of COVID-19 Stay at Home Measures
fires Dwelling Fire, Food on the stove fire fined to container ence [20]
Area of Fire Origin-Cooking area,
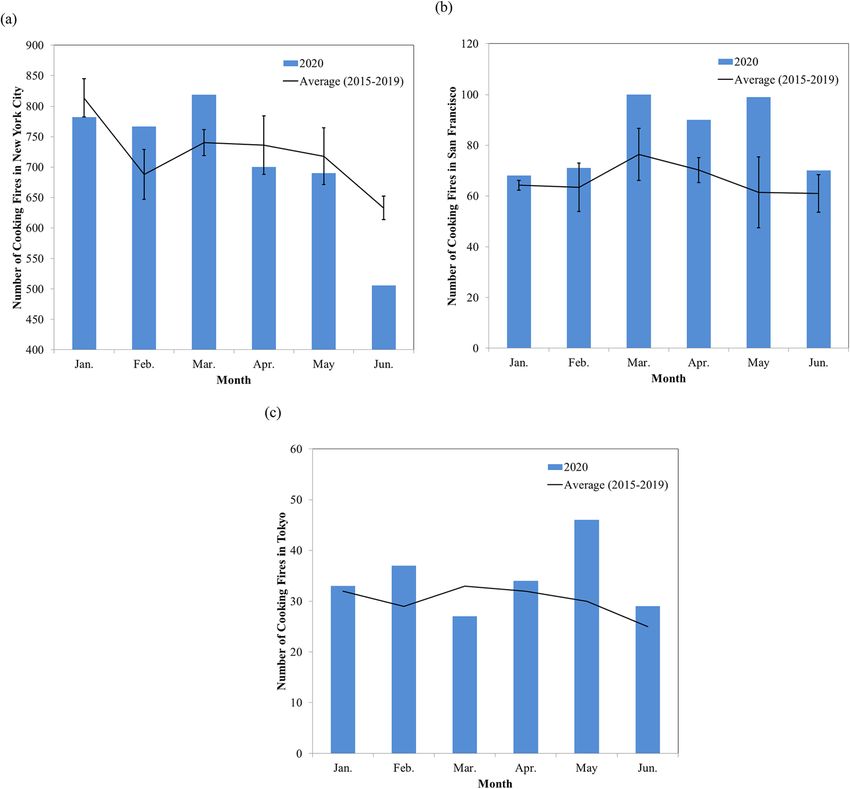
kitchenFire Technology 2021 Figure 2. Number of residential fires in the period of January to June a New York b San Francisco c Tokyo d London. 4.2. Trend on the Number of Cooking Fires The number of cooking fires in New York City, shown in Fig. 3a, started increas- ing in February, peaked in March, and started decreasing in April. In the case of San Francisco (see Fig. 3b), the number of cooking fires is clearly higher from March to May. In January, February, and June, the number is slightly higher than the average. In the case of Tokyo (see Fig. 3c), the increase in May is more than 50% up from the average. Smaller peak in February is observed. The increase in April and May in Tokyo and San Francisco are similar while a differ- ent trend is observed in New York.
The Influence of COVID-19 Stay at Home Measures

Figure 3. Number of cooking fires in the period of January to June a
New York b San Francisco c Tokyo.

5. Discussion
The situation in each city was different—London and New York City had a high
number of COVID-19 cases while Tokyo and San Francisco had less during the
stay-at-home period shown in Fig. 1. As shown in Table 1, the general approach
to lockdown or stay-at-home in New York City, San Francisco and London was
similar (mandatory) while people in Tokyo stayed home on more ‘‘voluntary’’
basis. Community mobility reports, such as google or apple, indicate more people
stayed home, or less commuted to work in all four cities [25, 26]. This being said,
the trend on the number of residential fires and cooking fires in each city, are not
clear. For residential fires, the numbers increased in San Francisco and Tokyo,
while it did not in London and New York City. For cooking fires, the numbers
increased in San Francisco and Tokyo, while it did not in New York City. These
Fire Technology 2021

findings are interesting since residents were forced to stay home and spent time in
cooking.
   The simple comparison did not provide general increases or decreases in the
numbers of residential fires or cooking fires. Possible reasons for these findings
may be in cultural differences, including cooking habits in those cities, and
response to the COVID-19 pandemic. The option for carry-out should be also
investigated Additionally, cooking habits may change when carry-out became
available in general.
   London and New York City were considered one of the worst hit cities during
those stay-at-home period, and high demands for first responders for COVID-19
patients might have prevented people from calling the fire department or people
were afraid to let first responders into their home if a fire was small. This needs
further investigation, including more data from different countries as well as cul-
tural aspects, including comparison of socioeconomic factors [27, 28]. Further-
more, investigating the number of fire incidents before and after the lockdown
periods provide new insights on fire statistics. For example, short-term compar-
isons on residential fires or cooking fires is also possible from a stay-at-home
viewpoint as well as people’s approach to fires or reporting fires.

6. Conclusion
The number of fires, especially residential fires and cooking fires, are compared
with the previous 5 years for the first 6 month of 2020 (January to June) in New
York City, San Francisco, London, and Tokyo in order to investigate the effect of
stay-at-home order on the number of fires. No clear trend was observed among
the four cities. The number of residential fires increased during the stay-at-home
period in San Francisco and Tokyo, while the percentage of residential fires in all
fires in New York City increased during the stay-at-home period and both
remains similar for London. The number of cooking fires increased in San Fran-
cisco and Tokyo, while it did not increase in New York City. One possible expla-
nation for this is the number of COVID-19 cases. The dispatch call number is the
same for ambulance and fire, and people hesitated to call fire department if a fire
was small due to high demand of first responders or to let first responders into
their home. This needs more investigation including more data from different
counties and taking into cultural aspects.

References
 1. The rise of home cooking in lockdown Trends and Insights 2020–2021 https://thebilling
    tongroup.com/news/2021/01/19/the-rise-of-home-cooking-in-lockdown-trends-and-insigh
    ts-2020-2021/
 2. From Cooking to calligraphy, people stuck at home are finding new space for creativity
    https://www.washingtonpost.com/nation/2020/04/11/cooking-calligraphy-people-stuck-h
    ome-are-finding-new-space-creativity/
The Influence of COVID-19 Stay at Home Measures
3. Spearpoint M, Hopkin C (2020) A study of the time of day and room of fire origin for
dwelling fires. Fire Technol 56:1465–1485. https://doi.org/10.1007/s10694-019-00934-5
4. Japan Syoboucho, ‘‘Shobo Hakusyo (Heisei 30 Nenban)’’ (2006) Gyosei
5. Ahrens M, Maheshwari R (2020) Home structure fires, NFPA Research, November
2020
6. Timeline: The first 100 days of New York Gov. Andrew Cuomo’s COVID-19 response,
abc news https://abcnews.go.com/US/News/timeline-100-days-york-gov-andrew-cuomos-
covid/story?id=71292880 (Accessed April 2021)
7. Here’s what a ’stay home’ order means for New York, The Guardian, https://www.theg
uardian.com/us-news/2020/mar/20/new-york-90-day-stay-home-order-what-it-means
(Accessed April 2021)
8. City and County of San Francisco, Order of the Health Officer of the City and County
of San Francisco Directing All Individuals Living in the County to Shelter at their
Place of Residence Except that they may Leave to provide or Receive Certain Essential
Services or Engage in Certain Essential Activities and Work for Essential Business and
Government Services; Exempting Individuals Experiencing Homelessness from the Shel-
ter in Place Order but Urging Them to find Shelter and Government Agencies to Pro-
vide it; Directing all Businesses and Governmental Agencies to Cease Non-Essential
Operations at Physical Locations in the County; Prohibiting all Non-Essential Gather-
ings of any Number of Individuals; and Ordering Cessation of all Non-Essential Travel
(Shelter in Place) Date of Order: March 16, 2020, Order of the Health Officer No. C19-
07 Department of Public Health Order of the Health Officer, City and County of San
Francisco
9. News: SF responds to coronavirus outbreak with Stay Home order, https://sf.gov/news/
sf-responds-coronavirus-outbreak-stay-home-order (Accessed April 2021)
10. Novel Coronavirus Response Headquarters, 27th meeting, April 7th 2020, Prime Minis-
ter’s Office of Japan https://www.kantei.go.jp/jp/98_abe/actions/202004/07corona.html
(Accessed April 2021)
11. The Health Protection (Coronavirus, Restrictions) (England) Regulations 2020
12. Herd immunity: will the UK’s coronavirus strategy work?, The Guardian, https://www.
theguardian.com/world/2020/mar/13/herd-immunity-will-the-uks-coronavirus-strategy-w
ork (Accessed April 2021)
13. COVID-19 Daily Counts of Cases, Hospitalizations, and Deaths, NYC OpenData, http
s://data.cityofnewyork.us/Health/COVID-19-Daily-Counts-of-Cases-Hospitalizations-an
/rc75-m7u3
14. COVID-19 Cases and Deaths, Data SF https://data.sfgov.org/stories/s/dak2-gvuj
15. Details of COVID-19 patients, Tokyo government Open Data Catalog site, https://catal
og.data.metro.tokyo.lg.jp/dataset/t000010d0000000068/resource/c2d997db-1450-43fa-803
7-ebb11ec28d4c
16. Coronavirus (COVID-19) Cases, London Datastore https://data.london.gov.uk/dataset/
coronavirus–covid-19–cases
17. Fire Incident Dispatch Data, NYC OpenData https://data.cityofnewyork.us/Public-Safe
ty/Fire-Incident-Dispatch-Data/8m42-w767 (Accessed April 2021)
18. Fire Incidents, DataSF https://data.sfgov.org/Public-Safety/Fire-Incidents/wr8u-xric
(Accessed April 2021)
19. London Fire Brigade Incident Records, London Database https://data.london.gov.uk/d
ataset/london-fire-brigade-incident-records (Accessed April 2021)
20. Tokyo Fire Department, Koho 2020 nenn 10 gatsu https://www.tfd.metro.tokyo.lg.jp/c
amp/2020/202010/camp1.html (Accessed April 2021)Fire Technology 2021
21. Kasai no Jittai, Tokyo Fire Department e-library, https://www.tfd.metro.tokyo.lg.jp/hp-
cyousaka/kasaijittai/index.html (Accessed April 2021)
22. Home Office, Fire and rescue incident statistics: England year ending September 2020 h
ttps://assets.publishing.service.gov.uk/government/uploads/system/uploads/attachment_d
ata/file/959838/fire-and-rescue-incident-sep20-hosb0521.pdf
23. Fire Safety -Statistical data collection- part 2: definition of terms, ISO/DIS 17755-2(en)
24. Greene MA, Andres C (2004–2005) National sample survey of unreported residential
fires, July 2009, CPSC https://www.cpsc.gov/s3fs-public/UnreportedResidentialFires.pdf
(Accessed April 2021)
25. Google, Community Mobility Report https://www.google.com/covid19/mobility/ (Ac-
cessed April 2021)
26. COVID-19—Mobiliy Trends Reports—Apple, https://covid19.apple.com/mobility (Ac-
cessed April 2021)
27. Jenning C (1999) Scoioeconomic characteristics and their relationship to fire incidence:
a review of the literature. Fire Technol 35(1):7–34
28. Beaulieu E, Smith J, Zheng A, Pike I (2019) Association between neighbourhood
socioeconomic features and residential fire incidence, related casualties and children: a
cross-sectional population-based study in 4 Canadian provinces. CMAJ Open
7(3):E562–E567. https://doi.org/10.9778/cmajo.20190079
Publisher’s Note Springer Nature remains neutral with regard to jurisdictional claims in published
maps and institutional affiliations.You can also read