THE INFLUENCE OF ROCK UPLIFT RATE ON THE FORMATION AND PRESERVATION OF INDIVIDUAL MARINE TERRACES DURING MULTIPLE SEA LEVEL STANDS - EARTHARXIV
←
→
Page content transcription
If your browser does not render page correctly, please read the page content below
The influence of rock uplift rate on the formation and preservation of
individual marine terraces during multiple sea level stands
Luca C. Malatesta*1,2,3, Noah J. Finnegan3, Kimberly L. Huppert1, Emily I. Carreño3
1Section of Earth Surface Process Modelling, GFZ Potsdam, Germany
2Institute
         of Earth Surface Dynamics, University of Lausanne, Lausanne, Switzerland
3Department of Earth and Planetary Sciences, University of California Santa Cruz, USA

* luca.malatesta@gfz-potsdam.de, Twitter: @_geoLuca

This preprint is a non-peer reviewed version of an article submitted to Geology on May 11th 2021.

Abstract
Marine terraces are a cornerstone for the study of paleo sea level and crustal deformation. Commonly, individual erosive
marine terraces are attributed to unique sea level high-stands. This stems from early reasoning that erosive marine
platforms could only be significantly widened at the beginning of an interglacial. However, this implies that wave erosion is
insignificant during the vast majority of sea level history. Here, we postulate that the total duration of sea level occupation
at a bedrock elevation is a proxy for the erosion potential. The total duration of sea level occupation (hence wave erosion)
depends strongly on rock uplift rate. Certain rock uplift rates may promote the generation and preservation of particular
terraces while others prevent it. The elevations and widths of terraces eroded during specific sea level stands may vary
widely from site to site and depend on local rock uplift rate. This leads to potential misidentification of terraces if each
terrace in a sequence is assumed to form uniquely at successive interglacial high stands and to reflect their elevations.
Representing a proxy for the entire erosion potential of sea level history allows us to address creation/preservation biases
at different rock uplift rates.

                                                               1
The influence of rock uplift rate on the formation and preservation of
individual marine terraces during multiple sea level stands
Luca C. Malatesta1,2,3, Noah J. Finnegan3, Kimberly L. Huppert1, Emily I. Carreño3
1
  Section of Earth Surface Process Modelling, GFZ Potsdam, Germany
2
  Institute of Earth Surface Dynamics, University of Lausanne, Lausanne, Switzerland
3
  Department of Earth and Planetary Sciences, University of California Santa Cruz, USA

Abstract
Marine terraces are a cornerstone for the study of paleo sea level and crustal deformation. Commonly, individual
erosive marine terraces are attributed to unique sea level high-stands. This stems from early reasoning that erosive
marine platforms could only be significantly widened at the beginning of an interglacial. However, this implies that
wave erosion is insignificant during the vast majority of sea level history. Here, we postulate that the total duration
of sea level occupation at a bedrock elevation is a proxy for the erosion potential. The total duration of sea level
occupation (hence wave erosion) depends strongly on rock uplift rate. Certain rock uplift rates may promote the
generation and preservation of particular terraces while others prevent it. The elevations and widths of terraces
eroded during specific sea level stands may vary widely from site to site and depend on local rock uplift rate. This
leads to potential misidentification of terraces if each terrace in a sequence is assumed to form uniquely at
successive interglacial high stands and to reflect their elevations. Representing a proxy for the entire erosion
potential of sea level history allows us to address creation/preservation biases at different rock uplift rates.

Introduction
Marine terraces are key landforms for the study of paleo sea level (e.g., Broecker et al. 1968, Chappell, 1974,
Machida, 1975) and crustal deformation (e.g., Otuka, 1934, Ota et al., 1978, Lajoie 1986, Armijo et al., 1996).
Commonly, individual marine terraces created by bedrock erosion are interpreted to form during unique sea level
high stands. This one-to-one correspondence is typically assumed for two reasons. First, low gradient, shallow
water marine platforms — which become marine terraces after a fall in relative sea level (difference between the
rates of eustatic change and rock uplift) — would grow by wave erosion of the coast at a faster rate when the rate of
relative sea level rise is small; a condition that occurs at the beginning of interglacial periods as eustatic sea level
rise slows down (see Bradley, 1958, with a review of early 20th c. literature). Second, the large eustatic sea level
drops that typically follow high stands can rapidly abandon, and preserve, marine terraces.

Using this conceptual model, Yoshikawa et al. (1964) identified the rock uplift rate that best projected relative sea
level high stands to the elevations of marine terraces observed around Tosa Bay, Japan (English translation in the
supplementary files) — perhaps the first documented attempt to quantify rock uplift rates by combining coastal
morphology and a relative sea level curve. Later, Lajoie (1986) merged this work with seminal studies on
constructional coral reef terraces (e.g., Broecker et al. 1968, Chappell, 1974) and declared that “a general consensus
has developed” linking strandlines and high stands on rising coastlines. This morphostratigraphic approach relies on
a bijective assumption that requires each individual terrace to have a unique age linked to a unique high stand
(Pastier et al., 2019). It is commonly employed at sites where independent dating of multiple terraces is unavailable
or limited to a small subset.

Greater scrutiny however reveals that individual terraces can form during multiple sea level stands. Dufaure and
Zamanis (1980) noted diachronous erosive terraces in the Gulf of Corinth, Greece, where three distinct terraces,
separated by cliffs >10 m, merge into one as rock uplift rate decreases alongshore. At the same site, Armijo et al.
(1996) suggested that reoccupation of the single terrace by successive sea level high stands where rock uplift rates
are slower can lead to complex terrace structures and to the absence of specific high stands from the
morphostratigraphy.

The observation of composite ages on individual coral reef terraces (e.g., Bard et al., 1996) and the occasional
absence of specific MIS high stands in extensive coral terrace series (e.g., Pedoja et al., 2018) also calls into
question the bijective rationale. Pastier et al. (2019) highlight that a sea level curve cannot be straightforwardly
related to a coral reef terrace record since some terrace sequences may lack certain high stands and/or preserve steps
formed at lower sea level stands.

                                                           2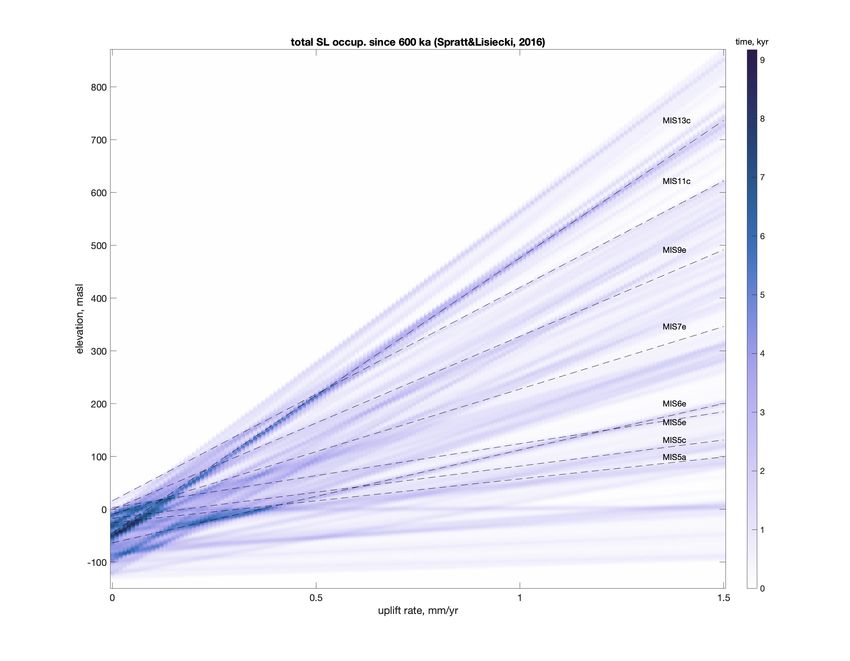
Here, we question the default assumption that marine terraces can be uniquely linked to a sea level high stand and
highlight how marine terraces can be created by the integrated effects of successive episodes of wave erosion during
multiple occupations of the same uplifting platform by the ocean. To do this, we examine altitudinal transects of sea
level occupation under varying uplift conditions and identify the uplift rates that should enhance or reduce the
potential for the generation and preservation of erosional terraces. Using a compilation of uplift rates inferred from
marine terraces on convergent margins, we then consider the biases that polygenetic terraces can introduce into
relative sea level reconstructions and crustal deformation models when they are erroneously interpreted to have
formed during a single high stand.

                                                                                                    elevation
                                                                                                                 known     unknown
        rate of relative sea level fall = eustasy - rock uplift rate                                             amount    amount of work
                                                                                                                 of work   (eroded away)

                   known amount of erosion                                           bedrock elevation datum
                                                                                     moves up with rock uplift
          unknown amount of erosion
eustasy

                                                      beveling of marine platform               rock uplift
                                                      and backwearing of lowest terrace

          time                                                                                                        total work
Figure 1: the steps of a terraced coastal landscape (left) record various amount of work expended by the waves at different bedrock
elevations (right) to bevel marine platforms that have become terraces (brown bars) and have back-worn the terrace lying above.

Creation and preservation of marine terraces
Bedrock sea cliffs erode by weathering, mass wasting, and various processes driven by wave attack. Because waves
can impact and strain sea cliffs, and mobilize sediment (Trenhaile 2019, Adams et al., 2005), sea cliff erosion rates
increase with wave energy flux in a range of environments over annual to million-year timescales (e.g., Young et al.
2021, Alessio & Keller 2020, Huppert et al. 2020). Sea cliffs are thus expected to retreat further inland and etch a
wider shallow water platform in their wake when they are exposed to wave action for a longer period of time. The
resulting shallow water platform can be further abraded by sediment moved by shallow water waves (Bradley and
Griggs, 1976) and/or by weathering processes in the intertidal zone (e.g., Kennedy et al., 2011).

Sustained and/or recurrent wave erosion at the same bedrock elevation datum (i.e., horizontal strip of bedrock that is
moving with rock uplift) promotes the creation of wide, low gradient platforms that remain easily identifiable as
marine terraces on uplifting coastlines. Yet a marine terrace associated with a given sea level stand can also be
effectively erased from the chronostratigraphic record if a subsequent sea level stand occupies, and actively erodes,
the same bedrock datum (resetting its age) or bevels a new terrace that undercuts the older one. The potential for a
wide terrace to be created grows with the amount of time spent by sea level at a given bedrock datum, but the
potential for that terrace to be preserved decreases with the time that sea level subsequently lingers at elevations
closely below, where the coastline may easily retreat landward and undercut the abandoned terrace.

If marine terraces are only created during periods of slow relative sea level rise preceding high stands, as was
initially surmised (Bradley, 1958), bedrock coasts would seemingly sit unchanged over the vast majority of their
evolution, eroding only for a few millenia every hundred thousand years or so. Waves still break in the surf zone
throughout the glacio-eustatic sea level cycle, so erosive potential persists even if it is modulated by varying wave
energy, sediment cover, or expended only on non-cliff forming erosion of existing platforms (Mackey et al. 2014).
We therefore postulate that, if marine platforms are formed by wave erosion and preserved intact, their widths
should increase with the total amount of time sea level spends at that bedrock elevation datum, but this does not
have to be during a continuous time-span (Fig. 1).

                                                                   3
Sea-level occupation as a function of uplift
To represent the work of wave erosion on the coastline, it is practical to use the reference frame of the uplifting
bedrock (Fig. 2A). In Fig. 2 we show the elevations of past eustatic sea levels relative to present sea level (Spratt
and Lisecki, 2016) if they are uplifted at rates of 0, 0.3, 0.8, and 1.2 mm/yr. Relative sea level can be summed as a
total time spent at different bedrock elevation datums (relative to present sea level; Fig. 2B). This approach was
successfully used to characterize platforms and constrain rock uplift (Walker et al., 2016, Jara-Muñoz et al., 2017).
Here, we display sea level change since 300 ka to focus on the periods preceding and following the last interglacial.
From Fig. 2, we note that elevations of longer sea level occupation do not necessarily coincide with elevations of
interglacial high stands. Coastlines uplifting at 0.3 and 1.2 mm/yr experience long durations of sea level occupation
over the past 300 kyr at the elevation of MIS 5e; whereas sea level occupation at that elevation is much shorter on
coastlines experiencing 0.8 mm/yr rock uplift.
Relative sea level Duration of occupation since 300 ka
350
A B 1.2 mm/yr
300
MIS 6d–e
250
MIS 5e
elevation, m above present sea level
0.8 mm/yr
200
uplift rate, mm/yr
150 1.2
100 0.8
0.3 mm/yr
50
0.3
0 0 0
-50
-100 Spratt & Lisiecki (2016)
-150
0 50 100 150 200 250 300 0 1 0 1 0 1 2
time, ka total occupation, kyr
Figure 2: A. time series of relative sea level, and B., cumulative sea-level occupation of bedrock elevations for coastlines uplifting at 0.3,
0.8, and 1.2 mm/yr since 300 ka. Horizontal lines mark the present-day elevation of the MIS 5e shoreline. The density functions are made
with a kernel function using a 3 m bandwidth. Supplementary video is useful to grasp the correspondence between A and B.
400 Total time, kyr * Distributions
4 – 6.1 from Figure 2 B Highstands:
* 1.2 mm/yr
MIS 7e
3
elevation, m above modern sea level
300 2
1 * 0.8 mm/yr
0 MIS 6e
200
MIS 5e
MIS 5c
* 0.3 mm/yr MIS 5a
100
0
-100
0 0.3 0.5 0.8 1 1.2 1.5
uplift rate, mm/yr
Figure 3: Duration of sea level occupation since 300 ka of bedrock datums as a function of rock uplift rate displayed by color brightness,
with distributions of RSL occupation from Fig. 2B shown for select uplift rates. Dashed lines show the present-day elevation of specific
MIS stages across all uplift rates. Sea level from Spratt and Lisiecki (2016).
4The distributions of total sea level occupation (Fig. 2B) are shown by color brightness along a continuous spectrum
of uplift rates in Fig. 3 (plot since 600 ka, alternative sea level curves, and the Python script needed for Fig. 2 and 3
are in the supplementary files). For instance, examining the color brightness along a vertical transect at an uplift rate
of 0.8 mm/yr, we see that relative sea level elevations fall between -125 and ~200 m above present sea level (masl),
with the longest occupation (darkest color) at ~40 masl (Fig. 2). The uplifted elevations of individual high stands are
represented with dashed lines. Instances of repeated occupation are apparent at numerous other uplift rates, making
it clear that a bijective interpretation of marine terrace morphostratigraphy is invalid in a wide range of tectonic
settings.
An additional source of error may arise when a terrace is resubmerged by a higher high stand and draped with coral
or sediment of that younger age. For example, at 0.8 mm/yr, MIS 5e and 6e high stands would be uplifted to 100 and
81 masl respectively (Fig. 2A, 3) and the attribution of a younger age to the older, and lower, platform yields an
apparent rock uplift of 0.67 mm/yr. For instance, corals were deposited at ~100 ka on a resubmerged ~120 ka terrace
on San Nicolas Island, California, USA, resulting in a mismatch between carbonate age and age of platform erosion
at a rock uplift of ~0.25–0.27 mm/yr (Muhs et al. 2012). This potential for age-platform mismatch can be tracked
across a spectrum of uplift rates in Fig. 3 by comparing high stands (dashed line) and long sea level occupation (dark
streaks).
Evidence at global and local scales
A global compilation of presumed MIS 5e marine terrace ages and elevations (Pedoja et al., 2014) suggests that
time-averaged rock uplift rates at convergent margins since MIS 5e cluster around a primary peak at 0.2–0.3 mm/yr
and a secondary peak around 0.9 mm/yr (Fig. 4A). We calculated these uplift rates assuming a globally consistent
MIS 5e sea level equivalent to the present. Individual regions included in the compilation show similar bimodality
(Fig. 4B). We fail to identify a geological process that would explain an abundance of uplift rates between 0.8 and
1.1 mm/yr or a lower representation around 0.6 mm/yr.
Elevation, m
A
MIS 5e terraces at active margins D >500
Total compilation 0
4.1 -12
5m -500
-1000
northing, 106 m
Santa Cruz -1500
California
4.08 -2000
E
-2500
n = 343
-3000
PDF
-0.5 0 0.5 1 1.5 2 2.5
B 4.06
Region breakdown
10 km 30 km
n = 86 Mediterranean
n = 100 Japan
5.5 6
n = 39 Andes easting, 105 m
n = 15 Cascadia
n = 18 New Zealand
n = 85 rest E total sea level occupation since 300 ka
-1 -0.5 0 0.5 1 1.5 2 2.5 250
at 0.3 mm/yr rock uplift (Fig. 2B)
Destruction potential
sea level occupation, kyr
60 sea level occupation 20–40 m below MIS 5e
~ 10 km wide platform
40 Creation potential 0
occupation 0–20 m below MIS 5e
20 -125
0 -250
-20 Net difference between
-40 C creation and destruction
-500
-1 -0.5 0 0.5 1 1.5 2 2.5 0 5 10 15 20 25
rock uplift rate (mm/yr) distance, km
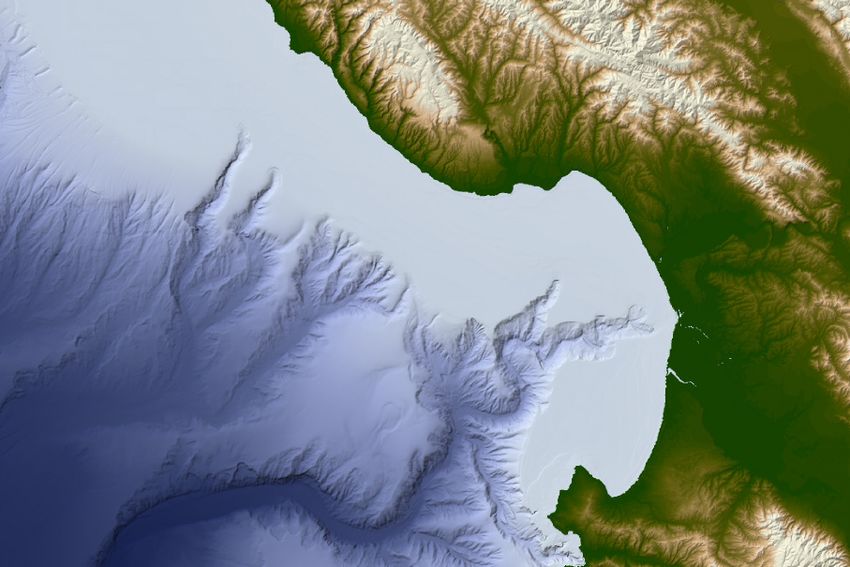
Figure 4 A. Total distribution of uplift rates at convergent margins around the globe (Pedoja et al., 2014). B. distribution of uplift rates at
the six sub-sites composing A. C. total sea level occupation at the elevation of the 5e terrace and immediately below (using 20 m windows)
and their difference (sea level from Spratt & Lisiecki, 2016). D. and E., Topography and profile of the Santa Cruz and Monterey Bay
area (Ryan et al., 2009).
We suggest that this bimodality in apparent rock uplift rates may arise from a propensity for rock uplift rates around
0.9–1.2 mm/yr to favor the creation and preservation of MIS 5e terraces. MIS 5e sea levels reoccupy the same
bedrock elevation as MIS 6d–e for uplift rates around 0.9–1.2 mm/yr (Fig. 2 & 3). This leads to a significantly
longer total duration of occupation at MIS 5e elevation at these rock uplift rates (creation potential), as well as a
brief occupation below (destruction potential, Fig. 4C). A MIS 5e terrace on a coastline uplifting at 0.9–1.2 mm/yr
may be wider and more easily identifiable, leading to a potential sampling bias. This may explain the
5overrepresentation of these rock uplift rates in the global marine terrace record. The range and distribution of rock
uplift rates that can be inferred from the marine terrace record is biased by the considerable influence that rock uplift
rates exert on the duration of sea level occupation at a given bedrock datum.
The coast around Santa Cruz, CA, USA, is characterized by an extensive terrace staircase uplifting at ~0.4 m/yr
(Bradley and Griggs, 1976, Anderson, 1990, Valensise and Ward, 1991, Gudmonsdottir et al., 2013) and a ca. 10
km-wide, 10km width of the marine platform uplifting at ca. 0.4 mm/yr off the coast of Santa Cruz, CA,
USA. Representing the distribution of sea level occupation time over a range of rock uplift rates illustrates the
likelihood of marine terrace creation and the potential for bias in the record, improving the quality and reliability of
morphostratigraphic analyses.
Acknowledgments:
Thanks to Shigeru Sueoka and Sumiko Tsukamoto for support translating Yoshikawa et al. (1964); to Anne-
Morwenn Pastier and Alessio Rovere for fruitful discussions. Malatesta was supported by a Swiss National Science
Foundation Post.Doc Mobility at UCSC (P2SKP2 168328).
6Bibliography
Adams, P. N., Storlazzi, C. D., and Anderson, R. S., 2005, Nearshore wave-induced cyclical flexing of sea cliffs, J.
Geophys. Res., 110, F02002, doi:10.1029/2004JF000217.
Alessio, P., Keller, E. A., Short-term patterns and processes of coastal cliff erosion in Santa Barbara, California,
2020, Geomorphology, v. 353, p. 106994, doi:10.1016/j.geomorph.2019.106994
Armijo, R., Meyer, B.G.C.P., King, G.C.P., Rigo, A. and Papanastassiou, D., 1996. Quaternary evolution of the
Corinth Rift and its implications for the Late Cenozoic evolution of the Aegean. Geophysical Journal
International, 126(1), pp.11-53.
Bard, E., Jouannic, C., Hamelin, B., Pirazzoli, P., Arnold, M., Faure, G., et al. (1996). Pleistocene sea levels and
tectonic uplift based on dating of corals from Sumba Island, Indonesia. Geophysical Research Letters, 23(12),
1473–1476. https://doi.org/10.1029/96GL01279
Bouma, A. H., Berryhill, H. L., Brenner, R. L., & Knebel, H. J. (1982, January). Continental Shelf and
Epicontinental Seaways. Sandstone Depositional Environments, 31, 0.
Bradley, W. C., 1958, Submarine abrasion and wave-cut platforms, Geological Society of America Bulletin, v. 69,
p. 967–974, doi:10.1130/0016-7606(1958)69[967:SAAWP]2.0.CO;2
Bradley, W.C., and Griggs, G.B., 1976, Form, genesis, and deformation of central California wave-cut platforms:
Geological Society of America Bulletin, v. 87, p. 433–449, doi: 10.1130/0016-
7606(1976)872.0.CO;2.
Broecker, W. Thurber, D. L., Goddard, J. Ku, T.-L., Matthews, R. K., Mesolella, K. J., 1968, Milankovitch
Hypothesis Supported by Precise Dating of Coral Reefs and Deep-Sea Sediments, Science, v. 159, p. 297–300
Chappell, J., 1974, Geology of Coral Terraces, Huon Peninsula, New Guinea: A Study of Quaternary Tectonic
Movements and Sea-Level Changes, Geological Society of America Bulletin, v. 85, p. 553–570, doi:
10.1130/0016-7606(1974)852.0.CO;2.
Dufaure, J.J. & Zamanis, A., 1980. Styles néotectoniques et étagements de niveaux marins sur un segment d’arc
insulaire, le Péloponnèse, in Proc. Conf. Niveaux Marins et Tectonique Quaternaire dans l’Aire
Méditerranéenne, pp. 77-107, CNRS, Paris, France.
Gudmundsdottir, M. H., Blisniuk K., Ebert Y., Levine N. M., Rood D. H., Wilson A., Hilley G. E.; Restraining bend
tectonics in the Santa Cruz Mountains, California, imaged using 10Be concentrations in river sands. Geology;
41 (8): 843–846. doi: 10.1130/G33970.1
Huppert, K. L., Perron, J. T., Ashton, A. D., 2020, The influence of wave power on bedrock sea-cliff erosion in the
Hawaiian Islands. Geology, 48 (5): 499–503. doi:10.1130/G47113.1
Jara-Muñoz, J., D. Melnick, P. Zambrano, A. Rietbrock, J. González, B. Argandoña and M. R. Strecker, 2017,
Quantifying offshore fore-arc deformation and splay-fault slip using drowned Pleistocene shorelines, Arauco
Bay, Chile, J. Geophys. Res. Solid Earth, 122, 4529–4558, doi:10.1002/2016JB013339.
Kennedy, D.M., Paulik, R. and Dickson, M.E. (2011), Subaerial weathering versus wave processes in shore platform
development: reappraising the Old Hat Island evidence. Earth Surf. Process. Landforms, 36: 686-
694. https://doi.org/10.1002/esp.2092
Lajoie, K.R., 1986. Coastal Tectonics. In: Press, N.A. (Ed.), Active tectonic. National Academic Press, Washington
D.C., pp. 95–124.
Machida, H. (1975) Pleistocene sea level of South Kanto, Japan, analysed by tephrochronology Suggate, R. P. and
Cresswell, M. M. (eds.) Quaternary studies. Royal Society of New Zealand Bulletin, 215-222.
Mackey, B.H., Scheingross, J.S., Lamb, M.P., and Farley, K.A., 2014, Knickpoint formation, rapid propagation, and
landscape response following coastal cliff retreat at the last interglacial sea-level highstand: Kaua‘i, Hawai‘i:
Geological Society of America Bulletin, v. 126, p. 925–942, https:// doi.org/10.1130/B30930.1.
Mitrovica, J., Tamisiea, M., Davis, J., Milne, G. A., 2001, Recent mass balance of polar ice sheets inferred from
patterns of global sea-level change. Nature 409, 1026–1029, doi:10.1038/35059054
Muhs, D. R., Simmons K. R., Schumann, R. R., Groves, L. T., Mitrovica, J. X., Laurel, D., 2012, Sea-level history
during the Last Interglacial complex on San Nicolas Island, California: implications for glacial isostatic
adjustment processes, paleozoogeography and tectonics, Quaternary Science Reviews, v. 37, p. 1-25,
doi:10.1016/j.quascirev.2012.01.010.
Ota, Y. and Yoshikawa, T., 1978. Regional characteristics and their geodynamic implications of late Quaternary
tectonic movement deduced from deformed former shorelines in Japan. Journal of Physics of the
Earth, 26(Supplement), pp.S379-S389.
7Otuka, Y., 1934. Marine Pleistocene terraces near Kusiro, Hokkaido. 東京帝國大學地震研究所彙報二, Bulletin of
the Earthquake Research Institute, Tokyo Imperial University, 12(4), pp.798-803.
Pastier, A.-M., Husson, L., Pedoja, K., Bézos, A., Authemayou, C., Arias-Ruiz, C., & Cahyarini, S. Y.,
2019, Genesis and architecture of sequences of Quaternary coral reef terraces: Insights from numerical
models. Geochemistry, Geophysics, Geosystems, 20, 4248– 4272. Doi:10.1029/2019GC008239
Pedoja, K., Husson, L., Johnson, M. E., Melnick, D., Witt, C., Pochat, S., Nexer, M., Delcaillau, B., Pinegina, T.,
Poprawski, Y., Authemayou, C., Elliot, M., Regard, V., Garestier, F., 2014, Coastal staircase sequences
reflecting sea-level oscillations and tectonic uplift during the Quaternary and Neogene, Earth-Science Reviews,
v. 132, p. 13-38, doi:10.1016/j.earscirev.2014.01.007
Pedoja, K., Husson, L., Bezos, A., Pastier, A.-M., Imran, A. I., Arias-Ruiz C., Sarr A.-C., Elliot M., Pons-Branchu
E., Nexer M., Regard V., Hafidz, A., Robert, X., Benoit, L., Delcaillau, B., Authemayou, C., Dumoulin C.,
Choblet, G., 2018, On the long-lasting sequences of coral reef terraces from SE Sulawesi (Indonesia):
Distribution, formation, and global significance, Quaternary Science Reviews, v. 188, p. 37-57,
doi:10.1016/j.quascirev.2018.03.033.
Ryan, W. B. F., S.M. Carbotte, J. Coplan, S. O'Hara, A. Melkonian, R. Arko, R.A. Weissel, V. Ferrini, A.
Goodwillie, F. Nitsche, J. Bonczkowski, and R. Zemsky (2009), Global Multi-Resolution Topography (GMRT)
synthesis data set, Geochem. Geophys. Geosyst., 10, Q03014, doi:10.1029/2008GC002332.
Spratt, R. M. and Lisiecki, L. E., 2016, A Late Pleistocene sea level stack, Clim. Past, 12, 1079–1092,
https://doi.org/10.5194/cp-12-1079-2016
Trenhaile, A.S., 2019. Hard-rock coastal modelling: past practice and future prospects in a changing world. Journal
of Marine Science and Engineering, 7(2), p.34.
Valensise, G., Ward, S. N., 1991, Long-term uplift of the Santa Cruz coastline in response to repeated earthquakes
along the San Andreas fault, Bulletin of the Seismological Society of America, 81 (5): 1694–1704
Walker, R., Telfer, M., Kahle, R., Dee, M. W., Kahle, B., Schwenninger, J.-L., Sloan, R.-A., Watts, A. B.,
2016, Rapid mantle-driven uplift along the Angolan margin in the late Quaternary. Nature Geosci 9, 909–914,
https://doi.org/10.1038/ngeo2835
Yoshikawa, T., Sōhei, K., Ota, Y., 1964, 年 度 日本地理学会春季大会 におい て発表 した 内容 を補足訂正 し
た ものであ る.研 究 費の一部 は 1962, 63 年 度 文部 省科学 研究費に よる. [Marine terraces and crustal
movements on the northeastern coast of Tosa Bay]
Young, A. P., Guza, R. T., Matsumoto, H., Merrifield, M. A., O'Reilly, W. C., & Swirad, Z. M., 2021, Three years
of weekly observations of coastal cliff erosion by waves and rainfall. Geomorphology, 375, 107545,
https://doi.org/10.1016/j.geomorph.2020.107545
81 Supplementary files for the article “The influence of rock uplift
2 rate on the formation and preservation of individual marine
3 terraces during multiple sea level stands”
4 Luca C. Malatesta1 2 3
, Noah J. Finnegan3 , Kimberly L. Huppert1 ,Emily Carreño3
5
6 1 Code to generate the occupation plot
7 The Python code used to plot Fig. 2 and 3 and is available in the Zenodo repository doi:xyz
8 [Pending revision, the code will not be assigned a doi. Instead it can be accessed at
9 https://github.com/geo-luca/RSL-plotting
10 and it can be run directly in a browser using the Binder links in the read-me file
11 Summary of the code
12 The code can be summarized as following.
13 Import eustatic curves
14 Compute eustatic curve at different rock uplift rates
15 Calculate kernel distribution of sea level occupation time along elevation
16 Store kernel distribution in a matrix for each uplift rate
17 Represent the distribution as a heat map in elevation vs. rock uplift space
18 2 Sea level occupation since 600 ka
19 Figure 1 takes the last 600 kyr into account instead of the 300 kyr presented in the main manuscript.
20 The longer record yields additional loci of repeated occupation and spans a greater vertical
21 3 Plots with alternative sea level curves
22 Figure 2 shows alternative versions of the illustration of total sea level occupation time as a function
23 of rock uplift rate (Figure 3 in the main manuscript) with the sea level curves of Lea et al. (2002)
24 and Lisiecki and Raymo (2005). Additional plots can be generated using the Python code available
25 in Section 1.
1
Section of Earth Surface Process Modelling, GFZ Potsdam, Germany
2
Institute of Earth Surface Dynamics, University of Lausanne, Lausanne, Switzerland
3
Department of Earth and Planetary Sciences, UC Santa Cruz, Santa Cruz, CA 95060, USA
1Figure 1: Total occupation time of sea level from 600 ka over a range of rock uplift rate of 0 to 1.5
mm/yr using the sea level curves of Spratt and Lisiecki (2016).
2Figure 2: Alternative display of total occupation time over a range of uplift (Figure 3 in manuscript)
using the sea level curves of Lea et al. (2002) and Lisiecki and Raymo (2005).
26 References
27 D. W. Lea, P. A. Martin, D. K. Pak, and H. J. Spero. Reconstructing a 350ky history of sea level
28 using planktonic mg/ca and oxygen isotope records from a cocos ridge core. Quaternary Science
29 Reviews, 21(1):283–293, 2002. ISSN 0277-3791. doi: 10.1016/S0277-3791(01)00081-6.
30 L. E. Lisiecki and M. E. Raymo. A pliocene-pleistocene stack of 57 globally distributed benthic
31 δ 18 O records. Paleoceanography, 20(1), 2005. doi: 10.1029/2004PA001071.
32 R. M. Spratt and L. E. Lisiecki. A late pleistocene sea level stack. Climate of the Past, 12(4):
33 1079–1092, 2016. doi: 10.5194/cp-12-1079-2016.
3You can also read