Quantitative Evaluation of Encrustations in Double-J Ureteral Stents With Micro-computed Tomography and Semantic Segmentation
←
→
Page content transcription
If your browser does not render page correctly, please read the page content below
Quantitative Evaluation of Encrustations in Double-J
Ureteral Stents With Micro-computed Tomography
and Semantic Segmentation
Shaokai Zheng ( shaokai.zheng@outlook.com )
University of Bern
Pedro Amado
University of Bern
Bernhard Kiss
University Hospital of Bern
Fabian Stangl
University Hospital of Bern
Andreas Haeberlin
University Hospital of Bern
Daniel Sidler
University Hospital of Bern
Dominik Obrist
University of Bern
Fiona Burkhard
University Hospital of Bern
Francesco Clavica
University of Bern
Research Article
Keywords: Double-J ureteral stents, micro-computed tomography, semantic segmentation, Quantitative
evaluation, encrustations
Posted Date: August 18th, 2021
DOI: https://doi.org/10.21203/rs.3.rs-763507/v1
License: This work is licensed under a Creative Commons Attribution 4.0 International License.
Read Full License
Page 1/13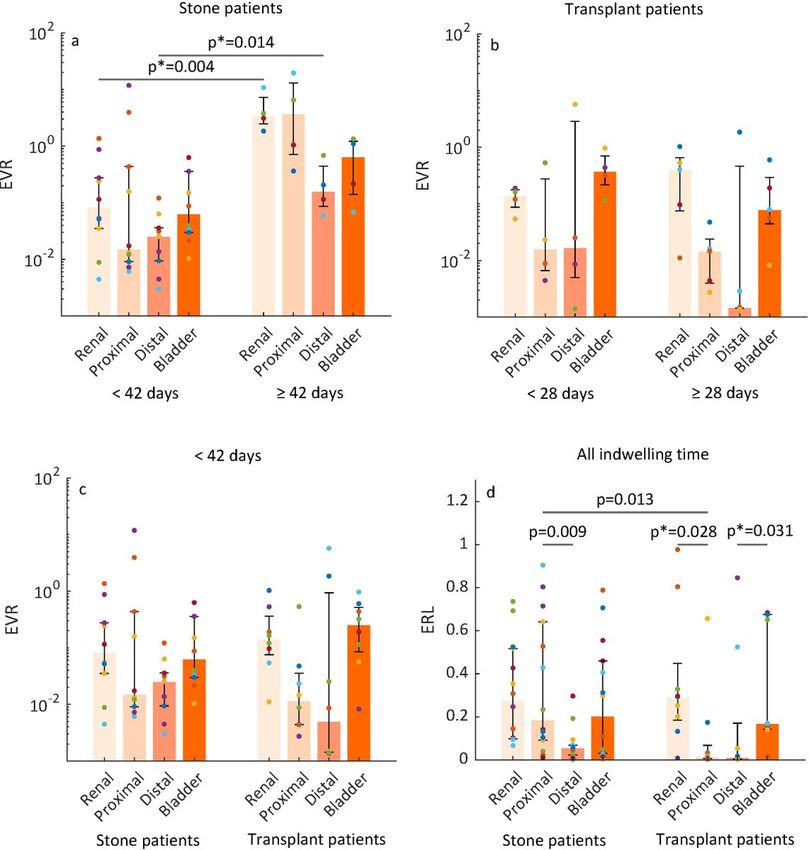
Abstract
Accurate evaluations of stent encrustation patterns, such as volume distribution, from different patient
groups are valuable for clinical management and the development of better stents. This study compared
stent encrustation patterns from stone and kidney transplant patients. Twenty-three double-J ureteral
stents were collected at a single center from patients with stone disease or underwent kidney
transplantation. Encrustations on stent samples were quantified by means of micro‑computed
tomography and semantic segmentation using Convolutional Neural Network models. Luminal
encrustation volume per stent unit was derived to represent encrustation level, which did not differ
between patient groups in the first six weeks. However, stone patients showed higher encrustation levels
over prolonged indwelling times (p = 0.036). Along the stent shaft body, the stone group showed higher
encrustation levels near the ureteropelvic junction compared to the ureterovesical junction (p = 0.013),
whereas the transplant group showed no such difference. Possible explanations were discussed
regarding vesicoureteral refluxes. In both patient groups, stent pigtails were more susceptible to
encrustations, and no difference between renal and bladder pigtail was identified. Our results suggest
that excessively long stents with superfluous pigtails should be avoided.

Introduction
Double-J ureteral stents are commonly used for pain management in acute obstruction prior to
endoscopic stone treatment, or to stent the ureterovesical anastomosis after kidney transplantation to
avoid obstruction due to swelling in the early postoperative phase. In spite of various material upgrades
and design modifications, encrustation remains a major problem causing stent associated complications
with a significant impact on patients’ quality of life 1,2. Encrusted stents can become obstructed and lead
to infections including pyelonephritis. Severely encrusted stents can no longer be retrieved
cystoscopically and require more invasive approaches to be removed. As a result, indwelling stents have
to be replaced in regular intervals. For stone patients, indwelling times longer than six weeks have been
associated with significantly higher encrustation rates2–4. For transplant patients, indwelling times from
two to six weeks after transplantation have all been advised based on urinary tract infection (UTI) rates
and stent-related complications such as pain, haematuria, encrustation and migration5–8.

In this study, we are interested in clarifying the encrustation level over indwelling time in both stone and
transplant patient groups, with an emphasis on the localization of the encrustations in each group.
Therefore, evaluation of the encrustation volume is crucial. Earlier approaches were mainly qualitative,
relying on visual examination of Scanning Electron Microscopy9 or kidney-ureter-bladder (KUB)
radiography images10,11. Extracting quantitative information from KUB images had been attempted by
measuring the projected area of encrustations12. Unfortunately, the inherent uncertainty is not negligible
as encrustations are three-dimensional. Another established approach proposed to measure the level of
encrustation by weighing the stent sample before and after oxidative acid treatment to dissolve the
encrustations13. The spatial distribution of encrustations, however, is destroyed during the process.

                                                   Page 2/13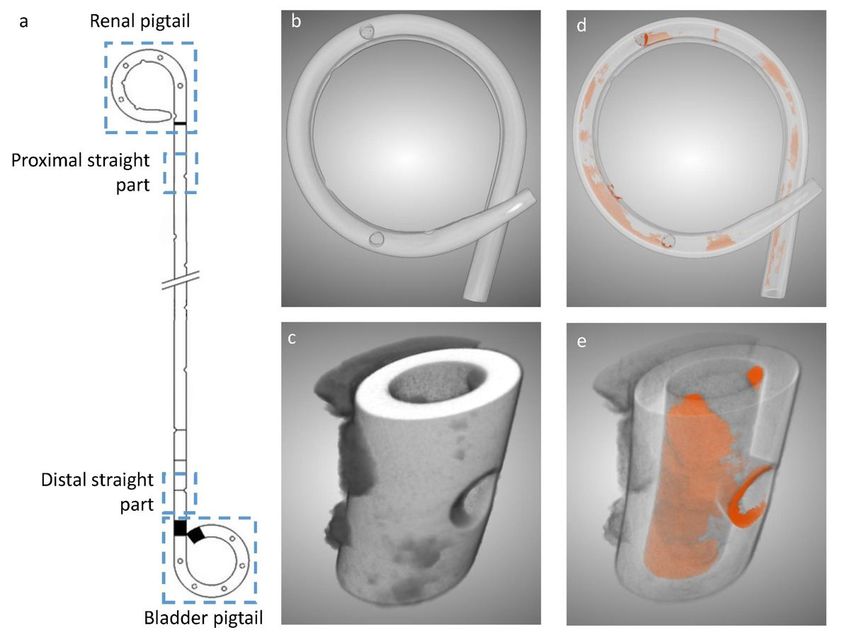
Practically, encrustations on external stent surfaces can be significantly affected during removal and
consequently introduce significant uncertainties to quantitative results. It is therefore desirable to isolate
the luminal encrustations (in the stent lumen), which are less affected by stent removal and critical for
luminal blockage of indwelling stents.

In a recently published work, micro-computed tomography (µ-CT) was applied to analyse stent
encrustation volumes to assess the anti-encrustation efficacy of two commercially available stents14.
The authors performed morphological segmentation on the µ-CT images, and managed to distinguish
between luminal and external encrustations. Based on their results, more than 90% of the stent had
luminal encrustations, which also appeared more in the shaft body (the straight part of the stent) than in
the renal and bladder pigtails, respectively. Nonetheless, one limitation associated with the method was
that the volume of individual stent remained unknown, so the encrustation volume might be biased
according to the actual stent sizes. Moreover, treating the entire stent shaft body as a unified section
inherently ignores any heterogeneity of the distribution of encrustation volume along the shaft, which
might overlook some key characteristics along the shaft body.

In this study, we compared patterns of luminal stent encrustations in stone and transplant patients. A
semantic segmentation approach was first evaluated and implemented by means of Convolutional
Neural Network (CNN) to simultaneously quantify the volume of luminal encrustations and the stent.
Luminal encrustation volume per stent unit was derived, representing the normalized encrustation level,
where the inter-subject changes of stent volume were accounted for. Further, luminal encrustation levels
along the stent were assessed to evaluate the heterogeneity along the stent, and comparisons were made
between stone and transplant patients.

Results
Study population. A total of 23 stents were collected from 23 ureter units, as summarized in Table 1.
Stent indwelling times were 11–90 days for stone patients and 22–42 days for kidney transplant
patients, with no significant difference between the groups (p > 0.05). All retrieved stents (KUARTZ
GUARDIAN Black Loop, PURE Medical Device SA, Geneva, CH) were made of thermosensitive
polyurethane with hydrophilic coatings.

                                                   Page 3/13
Table 1
Characteristics of patients and stents.
Stone patients Transplant patients
Patients, n 13 9
Female, n (%) 6 (46%) 5 (56%)
Median age, yr (IQR) 50.5 (47–69) 56 (38-73.5)
Presence of UTI, n (%) 3/13 (23%) 3/9 (33%)
Stone location, n (%)
Nephrolithiasis 9/13 (69.2%) NA
Ureterolithiasis 3/13 (23.1%) NA
Nephro- & Ureterolithiasis 1/13 (7.7%) NA
Collected stents, n 14* 9
Stent size, Fr/cm 6/26 6/10
Median indwelling time, d (IQR) 32.5 (23–42) 28 (25.5–33.3)
IQR = interquartile range; UTI = urinary tract infection; yr = year; d = day.
* From 14 ureter units.
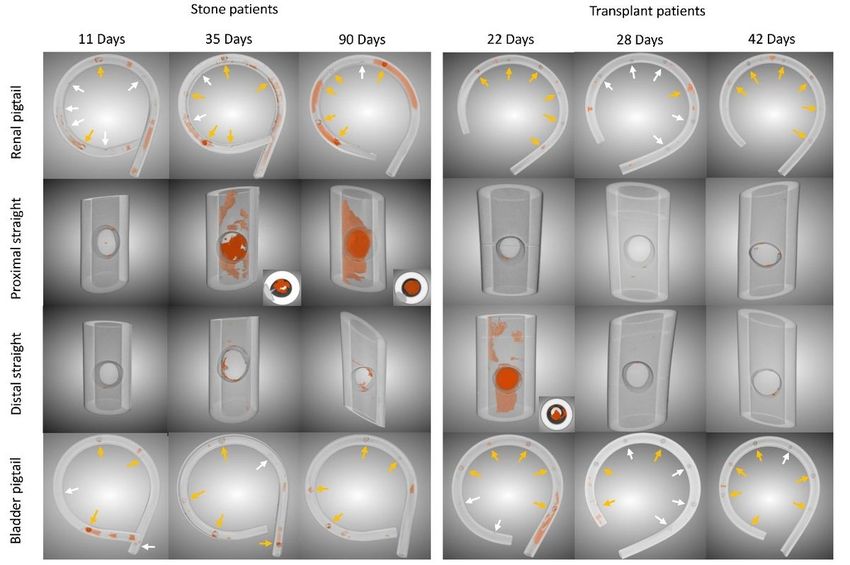
Encrustations near side holes. Segmented images from stents with minimal, median (or nearest), and
maximal indwelling times are shown in Fig. 1, respectively, for each patient group. The amount of luminal
encrustations (orange) in the stone group seems to increase over time, which is not observed in the
transplant group. The increasing encrustation in the stone group is more apparent on the renal pigtail and
proximal straight part of the stent (see Methods section). Aggregates of encrustations were mostly found
near the side holes (SHs), whose locations along the pigtails are marked (arrows) in Fig. 1. The example
with indwelling time of 90 days showed complete blockage in the proximal lumen, as evidenced by the
cross-sectional inset in Fig. 1.
Encrustation over time. The total encrustation volume ratios (TEVRs, see Methods section) from stone
patients were significantly different with indwelling times < 42 d (median: 0.45, IQR: 0.10–0.80) and ≥ 42
d (median: 8.4, IQR: 4.0–21, p = 0.036). Further comparisons of the encrustation volume ratios (EVRs, see
Methods section) in each section (Fig. 2a) revealed that encrustations increased significantly in the renal
pigtail (p = 0.004) and the distal straight part (p = 0.014). The EVR in the proximal straight part also
showed considerable increase over six weeks but did not reach statistical significance (p = 0.054). In the
transplant group no significant difference was found between short indwelling time (< 28 d) and long
indwelling time (≥ 28 d) groups (see Supplementary Material S2), while the median EVRs were higher in
Page 4/13both pigtails (Fig. 2b). The comparison was also made between stents from stone and transplant groups
with indwelling times < 42 d (Fig. 2c) and no differences were found in EVR (p > 0.05 in all sections) or
TEVR (p = 0.3).
Most encrusted stent region. Subsequent comparisons of encrustation risk levels (ERLs, see Methods
section) were made between stone and transplant groups for each stent section (Fig. 2d). In both patient
groups, the ERLs were higher in the pigtails with not significantly difference between renal and bladder.
Interestingly, in stone patients, the ERL of the proximal straight part was higher than that of the distal part
(p = 0.009). In contrast, no significant difference was found between the straight parts in transplant
patients. The ERLs of the pigtails were significantly higher than in the proximal (p = 0.028) and distal (p =
0.031) straight parts, respectively. Comparison of ERLs between stone and transplant groups revealed a
significant difference in the proximal straight part, with the higher ERL in the stone patients (p = 0.013).
Further data can be found in the Supplementary Material S2.
Discussion
The CNN model15 based on deep-learning allowed us to evaluate luminal encrustation and stent volumes
simultaneously with unparalleled accuracy. Once trained, the model can be applied to subsequent data
sets without further tuning, and therefore reduces random error or bias imposed during the quantitative
analyses. Moreover, to the best authors’ knowledge, this study is the first to measure both the
encrustation volume and the stent volume. As such, the encrustation volume per stent unit was
calculated, which is more representative than directly comparing the encrustation volumes, as was done
in several previous studies13,14.
One observation in our study was that SHs were often the anchoring sites of encrustations even for
stents with short indwelling times regardless of the patient group (Fig. 1). The initial deposits of
encrustations near SHs might be explained by recent in vitro experiments such that SHs facilitate local
urine flow stasis and promote particle accumulation in the neighbouring regions16–18. These initial
deposits exacerbate the local encrustation process, causing severe stone burden near SHs11,19. The stony
encrustation could compromise the stent tensile strength at the SHs, which deteriorate into fractures11,19.
Another observation was that that encrustation levels did not differ between patient groups in the first six
weeks, but stone patients had a higher tendency to build up encrustations over prolonged indwelling time
than transplant patients. We also observed the highest ERLs in the pigtails in both patient groups,
suggesting higher risks of excessive encrustations per stent unit. Both pigtails exhibited high median in
ERL and did not differ from each other, so the risk seemed equivalent in the renal and bladder ends. Since
our results were based on encrustation volume per stent unit, the use of excessively long stents with
superfluous pigtail materials should be avoided in both patient groups.
In practice, proximal stone burden has been associated with multiple surgical complications 20, and
accurate determination of the stent section most susceptible to encrustations has been an active topic of
Page 5/13discussion. Previous studies on stent encrustation patterns mainly focused on stone patients and no
consensus was reached. While some suggested the renal pigtail as the most susceptible section followed
by the bladder pigtail4,11,13, others reported that the two pigtails or the distal part of the stent were equally
susceptible9, or that the distal part of stent12 was most encrusted. The recent study using µ-CT14
suggested the stent’s shaft body (the entire straight part) as the most susceptible region. However, no
previous efforts attempted to derive encrustation volume per stent unit as an endpoint, which should be
more meaningful than direct comparison of encrustation volumes. For one thing, the disputed
conclusions can be attributed to the lack of quantitative tools to accurately measure the encrustation
volumes. For another, the fact that there were no significant differences between certain comparisons, as
demonstrated in Fig. 2, should also be acknowledged.
Other than stone patients, quantitative evaluation of stent encrustation patterns in transplant patients are
still lacking to the best of the authors’ knowledge. Following kidney transplantation, stents are usually
placed to prevent strictures or urine leakage. These prophylactic stents are usually much shorter than
those in stone patients since the allograft ureter is kept short to ensure a good blood supply.
Consequently, vesicoureteral reflux (VUR) in transplant patients often reaches up to the renal pelvis21.
This retrograde flow might create a flushing effect, periodically removing the deposits on the luminal
surface of the stent, whereas in stone patients the VUR would not reach up to renal pelvis as easily since
the stents are often longer. This might explain the higher encrustation level in the proximal straight part in
stone patients.
Moreover, stent implantation significantly impedes the peristalsis of the ureter22, and thus the urine
transport from kidney to bladder is largely passive. The longer tube in stone patients creates larger
resistance to the fluid, and local stasis of urine can be formed near the UPJ as the tract narrows, whereas
the shorter tube in transplant patients could better facilitate urine flows through the stent, either from
kidney to bladder or in presence of VUR. As such, both forward and retrograde urine flows influences the
dynamics, co-creating the different encrustation patterns presented above.
In terms of limitation, the current study consists of stents collected from a single center with limited
sample size, preventing further subgroup analysis. Moreover, the mechanism of urine flow dynamics in
stented ureters remains unclear, which plays a pivotal role in stent encrustation23. Further studies in this
regard could help elucidate the process of encrustations in stented native or allograft ureters.
Conclusion
The semantic segmentation approach delivered accurate and intuitive results and is worth further
applications to image analyses in urology. Our results highlighted the similarities and differences in
encrustation patterns between stone and renal transplant groups, and possible explanations were
discussed. Further investigations in both engineering and clinical disciplines are required to fully
understand the dynamics of encrustations in order to develop the “perfect stent”.
Page 6/13Materials And Methods
Study guidelines and ethics. The retrospective study was reported in accordance with guidelines from the
STROBE statement24. The stone and transplant cohorts consisted of double-J stents removed
endoscopically from patients underwent stone treatment and kidney transplantation, respectively,
between January and December 2020 at the Department of Urology, Bern University Hospital. Only stents
manufactured by PURE Medical Device SA were included in the study. Size of stents were limited to
6Fr/26cm and 6Fr/10cm in the stone and transplant cohorts, respectively. The age, gender, stent
indwelling time from the transplant cohort were matched with that of the stone cohort (p > 0.05).
Exclusion criteria included: (1) stents placed for external obstructions such as pregnancy and urothelial
carcinoma; and (2) stents with unknown indwelling times.
Since all data were collected as by-products of regular urological treatment and anonymized, this study
did not fall within the scope of the Swiss Federal Act on Research involving Human Beings (Human
Research Act, Art. 2, The Federal Assembly of the Swiss Confederation), and therefore did not need
approval of the local ethics committee. General consent (v5.0 February 2016, Bern University Hospital,
Directorate of Teaching and Research, Insel Gruppe AG) was obtained from all patients. Informed consent
was waived under the Human Research Act Art. 34. All methods were carried out in accordance with
relevant guidelines and regulations.
Material preparation. Each collected stent was dried in an oven at 60°C for three hours to remove residual
urine To quantify the encrustation volume in different sections of the stent, each stent was divided into
four sections, that is, the renal pigtail, the proximal straight part (near the UPJ), the distal straight part
(near the UVJ), and the bladder pigtail (see Fig. 3a). This was done under the assumption that the two
junctions are critical regions for the development of encrustations as they are the entrance and exist of
the ureter, where urine flows are regulated by the physiologically narrowing tract.
Imaging and segmentation. Subsequently, each section was scanned using a µ-CT scanner (SCANCO
Medical AG, Bruettisellen, CH) to acquire a three-dimensional image, which was segmented using a CNN
model known as U-Net15, available in the Dragonfly software (v2020.1, Object Research Systems Inc.
Quebec, CA, http://www.theobjects.com/dragonfly). The segmentation result allowed evaluation of the
luminal encrustations including the luminal space of the SHs without losing their spatial distribution (see
Fig. 3b-e), thus offering a more reliable representation of the encrustations14. Full technical details on µ-
CT, discussion on accuracy, and examples can be found in the Supplementary Material S1.
Study outcomes and definitions. By defining the encrustation volume ratio (EVR) as the encrustation
volume normalized by the corresponding stent volume, which gives the encrustation volume per stent
unit, the bias introduced by the different volumes of individual stent samples was eliminated. The total
encrustation volume ratio (TEVR) was defined by summing EVR over the four stent sections. To study the
relative level of encrustations at different sections, we defined the encrustation risk level (ERL) by dividing
EVR over TEVR. The stent section with highest ERL would be most likely to attract encrustations.
Page 7/13To compare the encrustation level over time, stents from stone patients were divided into 2 groups: group
1 with indwelling time < 42 d, and group 2 with indwelling time ≥ 42 d. This discrimination was based on
the fact that an indwelling time over six weeks is commonly associated with significantly higher
encrustation levels2–4. Since optimal removal time in transplant patients has been reported to range
between two and six weeks and no consensus has been reached, subgroups with indwelling times < 28 d
or ≥ 28 d were chosen for comparison.
Statistical analysis. For statistical comparisons, median values with interquartile range (IQR) were used,
and the two-sided Mann-Whitney U-test was used for significance tests. P-values from multiple
comparisons were corrected using the Bonferroni-Holm method, and p < 0.05 was considered significant
in this study.
Declarations
Acknowledgement
This publication is based upon work from COST Action "European Network of Multidisciplinary Research
to Improve the Urinary Stents - CA16217", supported by COST (European Cooperation in Science and
Technology). The authors also acknowledge the financial support from Swiss National Science
Foundation (SNSF grant number IZCOZ0_182966). S.Z. acknowledges Mr. Michael Indermaur from the
Musculoskeletal Biomechanics group at ARTORG for his support in operating the Micro-CT scanner, and
Mr. Emile Talon for his contribution in the preliminary study.
Author contributions
Conception and design: F.B., F.C., D.O., S.Z.; Acquisition of data: P.A., F.B., B.K., F.S., S.Z.; Analysis and
interpretation of data: P.A., S.Z.; Figure preparation: P.A., S.Z; Drafting of the manuscript: S.Z.; Statistical
analysis: A.H., S.Z.; All authors provided critical revision of the manuscript.
Competing interests
The authors declare no competing interests.
Additional Information
Supplementary materials are available online. Further requests on technical details should be addressed
to S.Z.
References
1. Bibby, L. M. & Wiseman, O. J. Double JJ Ureteral Stenting: Encrustation and Tolerability. European
Urology Focus 7, 7-8, doi:10.1016/j.euf.2020.08.014 (2020).
Page 8/132. Tomer, N., Garden, E., Small, A. & Palese, M. Ureteral Stent Encrustation: Epidemiology,
Pathophysiology, Management and Current Technology. Journal of Urology 205, 68-77,
doi:10.1097/JU.0000000000001343 (2021).
3. El-Faqih, S. R. et al. Polyurethane Internal Ureteral Stents in Treatment of Stone Patients: Morbidity
Related to Indwelling Times. The Journal of Urology 146, 1487-1491,
doi:https://doi.org/10.1016/S0022-5347(17)38146-6 (1991).
4. Kawahara, T., Ito, H., Terao, H., Yoshida, M. & Matsuzaki, J. Ureteral Stent Encrustation, Incrustation,
and Coloring: Morbidity Related to Indwelling Times. Journal of Endourology 26, 178-182,
doi:10.1089/end.2011.0385 (2011).
5. Tavakoli, A. et al. Impact of Stents on Urological Complications and Health Care Expenditure in Renal
Transplant Recipients: Results of a Prospective, Randomized Clinical Trial. Journal of Urology 177,
2260-2264, doi:10.1016/j.juro.2007.01.152 (2007).
6. Thompson, E. R., Hosgood, S. A., Nicholson, M. L. & Wilson, C. H. Early versus late ureteric stent
removal after kidney transplantation. Cochrane Database of Systematic Reviews,
doi:10.1002/14651858.CD011455.pub2 (2018).
7. Visser, I. J. et al. Timing of Ureteric Stent Removal and Occurrence of Urological Complications after
Kidney Transplantation: A Systematic Review and Meta-Analysis. Journal of Clinical Medicine 8,
doi:10.3390/jcm8050689 (2019).
8. Wilson, C. H., Rix, D. A. & Manas, D. M. Routine intraoperative ureteric stenting for kidney transplant
recipients. Cochrane Database of Systematic Reviews, doi:10.1002/14651858.CD004925.pub3
(2013).
9. Arkusz, K., Pasik, K., Halinski, A. & Halinski, A. Surface analysis of ureteral stent before and after
implantation in the bodies of child patients. Urolithiasis, doi:10.1007/s00240-020-01211-9 (2020).
10. Acosta-Miranda, A. M., Milner, J. & Turk, T. M. T. The FECal Double-J: A Simplified Approach in the
Management of Encrusted and Retained Ureteral Stents. Journal of Endourology 23, 409-415,
doi:10.1089/end.2008.0214 (2009).
11. Singh, I. et al. Severely encrusted polyurethane ureteral stents: management and analysis of
potential risk factors. Urology 58, 526-531, doi:10.1016/S0090-4295(01)01317-6 (2001).
12. Rana, A. M. & Sabooh, A. Management Strategies and Results for Severely Encrusted Retained
Ureteral Stents. Journal of Endourology 21, 628-632, doi:10.1089/end.2006.0250 (2007).
13. Sighinolfi, M. C. et al. Chemical and Mineralogical Analysis of Ureteral Stent Encrustation and
Associated Risk Factors. Urology 86, 703-706, doi: 10.1016/j.urology.2015.05.015 (2015).
14. Yoshida, T. et al. A randomized clinical trial evaluating the short-term results of ureteral stent
encrustation in urolithiasis patients undergoing ureteroscopy: micro-computed tomography
evaluation. Scientific Reports 11, 10337, doi:10.1038/s41598-021-89808-x (2021).
15. Ronneberger, O., Fischer, P. & Brox, T. in Medical Image Computing and Computer-Assisted
Intervention – MICCAI 2015. (eds Nassir Navab, Joachim Hornegger, William M. Wells, & Alejandro F.
Frangi) 234-241 (Springer International Publishing).
Page 9/1316. Mosayyebi, A. et al. Particle Accumulation in Ureteral Stents Is Governed by Fluid Dynamics: In Vitro
Study Using a “Stent-on-Chip” Model. Journal of Endourology 32, 639-646 (2018).
17. Clavica, F. et al. Investigating the flow dynamics in the obstructed and stented ureter by means of a
biomimetic artificial model. PloS one 9, e87433 (2014).
18. Carugo, D., Zhang, X., Drake, J. M. & Clavica, F. in Proceedings of the 18th International Conference
on Miniaturized Systems for Chemistry and Life Sciences, MicroTAS.
19. Zisman, A., Siegel, Y. I., Siegmann, A. & Lindner, A. Spontaneous Ureteral Stent Fragmentation.
Journal of Urology 153, 718-721, doi:10.1016/S0022-5347(01)67697-3 (1995).
20. Weedin, J. W., Coburn, M. & Link, R. E. The Impact of Proximal Stone Burden on the Management of
Encrusted and Retained Ureteral Stents. The Journal of Urology 185, 542-547,
doi:https://doi.org/10.1016/j.juro.2010.09.085 (2011).
21. Ness, D. & Olsburgh, J. UTI in kidney transplant. World Journal of Urology 38, 81-88,
doi:10.1007/s00345-019-02742-6 (2020).
22. Mosli Hisham, A., Farsi Hasan, M. A., Al-Zimaity Mohammed, F., Saleh Tarik, R. & Al-Zamzami
Mokhtar, M. Vesicoureteral Reflux in Patients with Double Pigtail Stents. Journal of Urology 146, 966-
969, doi:10.1016/S0022-5347(17)37976-4 (1991).
23. Zheng, S. et al. Fluid mechanical modeling of the upper urinary tract. WIREs Mechanisms of Disease
n/a, e01523, doi:10.1002/wsbm.1523 (2021).
24. Vandenbroucke, J. P. et al. Strengthening the Reporting of Observational Studies in Epidemiology
(STROBE): Explanation and Elaboration. PLOS Medicine 4, e297, doi:10.1371/journal.pmed.0040297
(2007).
Figures
Page 10/13Figure 1
Examples of luminal encrustations (orange) in the renal pigtail, proximal straight part, distal straight part,
and bladder pigtail of the stents from stone and transplant patient groups. Stents are rendered semi-
transparent for better visualization. Side hole locations on the pigtails are marked by arrows, where
yellow arrows indicate clear evidence of encrustations and white arrows suggest otherwise. Cross
sectional insets are given for visually significant encrustations to show the blockage level in the stent
lumen.
Page 11/13Figure 2
Encrustation volume ratios (EVR) compared with respect to indwelling time for (a) stone patients and (b)
transplant patients. (c) EVR compared between patient groups with stent indwelling time < 42 days. (d)
Encrustation risk levels (ERL) from stone and transplant patients for each stent section. The median (bar)
and interquartile range (error bars) are shown. Raw data from the same stent are coded by color (filled
Page 12/13circles). P-values corrected by the Bonferroni-Holm method is indicated by the asteroid (*). Further data
can be found in Supplementary Material S2.
Figure 3
(a) Illustration of the four divided sections from a ureteral stent. Three dimensional µ-CT images from the
pigtail and straight part before (b, c) and after (d, e) segmentations, respectively. Luminal encrustations
from the segmentation results are shown in orange, where stents are rendered semi-transparent for better
visualization.
Supplementary Files
This is a list of supplementary files associated with this preprint. Click to download.
SupplementaryMaterialS1.docx
SupplementaryMaterialS2.docx
Page 13/13You can also read