The INTA AHS system Alix Fernández-Renau, José Antonio Gómez, Eduardo de Miguel* Remote Sensing Laboratory, INTA, Cta Ajalvir s/n, Torrejón de ...
←
→
Page content transcription
If your browser does not render page correctly, please read the page content below
The INTA AHS system
               Alix Fernández-Renau, José Antonio Gómez, Eduardo de Miguel*
    Remote Sensing Laboratory, INTA, Cta Ajalvir s/n, Torrejón de Ardoz, 28850 Madrid, Spain

                                                      ABSTRACT

The Remote Sensing Laboratory at INTA owns and operates an 80-band airborne hyperspectral line-scanner radiometer,
alias AHS. This instrument is based on previous airborne hyperspectral scanners as MIVIS and MAS. This instrument
has been installed in the INTA´s aircraft (CASA C-212), and integrated with a GPS/INS.
The acquired imagery is processed and archived by INTA. For this purpose, a processing chain has been implemented at
the INTA premises in Madrid. In this chain, raw data (level 0 product) is transformed to at-sensor radiance (level 1b)
and later to geolocated at-sensor radiance (level 1c). Other processing levels, as atmospherically corrected reflectance,
brightness temperature or surface emissivity could also be produced. The radiometric calibration is based on laboratory
measurements using an integrating sphere for the reflective bands, and on in-flight blackbodies measurements for the
thermal bands. The geolocation procedure is based on processing of GPS/INS data synchronized with the imagery
collection. Finally, direct parametric georeferencing is achieved by means of the commercial software PARGE.
The resulting system is available to the international remote sensing community through specific agreements
(contractual or based on joint collaborations).
As an example of the use of this system, an on-going project to evaluate water stress in olives in southern Spain is
presented. In this project, high resolution thermal radiometry is used to evaluate tree temperature, while reflective bands
are used for identifying individual trees and for simultaneous monitoring of plant health.

Keywords: AHS, hyperspectral, airborne remote sensing

                                                  1. INTRODUCTION

The AHS is an imaging 80-band line-scanner radiometer, built by Sensytech Inc (currently Argon ST, and formerly
Daedalus inc.) and purchased by INTA on 2003. It is based on previous airborne hyperspectral scanners as MIVIS1
(Multispectral Infrared and Visible Imaging Spectrometer) and MAS2 (MODIS Airborne Simulator).

This instrument has been installed in the INTA´s aircraft (CASA C-212), and integrated with a GPS/INS POS-AV 410
from Applanix.

The AHS was first flown by INTA on September 2003. During 2004 the instrument was validated during a number of
flight campaigns which included extensive ground surveys (SPARC-2004 and others), and is fully operational from
beginning of 2005.

It has a design which has very distinct spectral performances depending on the spectral range considered. In the
VIS/NIR range, bands are relatively broad (28-30 nm): the coverage is continuous from 0.43 up to 1.0 microns. In the
SWIR range, there is an isolated band at 1.6, useful to simulate the corresponding band found in a number of satellite
missions. Next, there is a set of continuous, fairly narrow bands (13 nm) between 2.0 and 2.5 microns, which is well
suited for soil/geologic studies. In the MIR and TIR ranges, spectral resolution is again high (30 to 50 nm), and the
atmospheric windows (3 to 5 microns and 8 to 13 microns) are fully covered. With this spectral features, AHS is best
suited for multipurpose studies/campaigns, when a wide range of spectral regions are required, specially if no detailed
spectroscopy is required; and, in particular, is a very powerful instrument for thermal remote sensing.

The resulting system is available to the international remote sensing community through specific agreements
(contractual or based on joint collaborations).

* email: demiguel@inta.es, website: www.inta.es
2. THE AHS SYSTEM
We call AHS system the suite of instruments, software tools and procedures used to produce image data from the initial
user requirements. The main elements of the AHS system are detailed below.
2.1. The platform
The INTA platform (figure 1) is a non pressurized cabin, twin engine aircraft Aviocar CASA C-212-200 S/N 270. It has
been configured and instrumented as a remote sensing platform by INTA engineers.
Cabin volume: 22 m3
Max pay-load: 2100 kg
Cruising speed: 140 kts (260 Km/h)
Service ceiling: 25000 ft (7620 m)
Maximum range: 950 NM (1760 km)
Maximum endurance: 6 hours
Navigations systems: GPS, ADF, VOR, ILS, etc.
Two windows in the cabin floor to install in tandem
two nadir-looking cameras
Figure 1: Aviocar C-212-200.
The aircraft is property of INTA, but it is maintained and operated by an Spanish Air Forces body (Centro Cartográfico
del Ejército del Aire, CECAF) through a dedicated agreement. This aircraft is included in the EUFAR consortium
(www.eufar.net).
2.2. AHS
The main characteristics of AHS are:
Optical design: scan mirror plus reflective optics with a single IFOV determining field stop (Pfund assembly)
FOV (Field Of View) / IFOV (Instantaneous Field Of View): 90º / 2.5 mrad
GSD (Ground Sampling Distance): 2.1 mrad (0.12 degrees)
Scan rates: 12.5, 18.75, 25, 35 r.p.s., with corresponding ground sampling distances from 7 to 2 meters.
Digitization precision: 12 bits to sample the analog signal, with gain level from x0.25 to x10.
Samples per scan line: 750 pixels/line
Reference sources: two controllable thermal black bodies within the field of view, set to a temperature range from -15ºC
to +25ºC with respect to scan head heat sink temperature
Spectrometer: four dichroic filters to split radiation in four optical ports, and diffraction gratings within each port
Detectors: Si array for VIS/NIR port; InSb and MCT arrays, cooled in N2 dewars, for SWIR, MIR and TIR ports.
Spectral bands: continuous coverage in four spectral regions + single band at 1.5 micrometers, as shown in table 1.
PORT 1 PORT 2A PORT 2 PORT 3 PORT 4
coverage(micrometers) 0.43 -> 1.03 1.55 -> 1.75 2.0 -> 2.54 3.3 -> 5.4 8.2 -> 12.7
bandwidth (FWHM) 28 nm 200 nm 13 nm 30 nm 40-50 nm
λ/∆λ (minimum) 16 8 150 110 160
nº of bands 20 1 42 7 10
Table 1: AHS spectral configuration.The spectral bands in the narrower ports (1 and 2) fit quite well a gaussian distribution with FWHM equal to bandpeak- to-bandpeak spacing, as assumed by processing tools (typically ENVI). Bands in the thermal ports (3 and 4) are also well approximated by the gaussian curve, but their broader size would require the use of the spectral responsivity for detailed analysis. Band AHS-21 (port 2A) is the less regular one, and band center, peak response and FWHM have a singular relation. A sample of thermal bands spectral responsivity is shown in figure 6, along with a sample of the effect of the selectable gains in the instrument radiometric resolution. With the above configuration, some bands are located close to atmospheric absorption regions. AHS-18 (0.94 microns) is affected by a water vapour absorption band; in fact, it is possible to use the signal in AHS18 as a starting point for a estimation of water vapour content. AHS-67 (4.17 microns) is affected by a strong absorption by CO2. AHS-64(3.18) and AHS-70 (5.31) are too close to the 3-5 window edges, and are usually rather noisy. AHS74 (9.60) is affected by absorption by O3 , though usually this is not an issue for airborne images. 2.3. GPS/INS system During AHS remote sensing surveys, position and attitude measurements are provided by an Applanix POS AV 410, installed on top of the AHS. Table 2 shows the POSAV specifications in terms of absolute accuracy. For comparison, an AHS pixel subtends 0.12 degrees, and the minimum pixel size is 2 m. magnitude position velocity roll & pitch true heading post-processed 0.05-0.3 m 0.005 m/s 0.008 deg 0.015 deg absolute accuracy Table 2: Applanix POS AV 410 absolute accuracy (from specifications). The synchronization of Applanix records and AHS scanlines is obtained by a hardware trigger: a dedicated pulse is generated by the AHS each time there is a scanline acquisition; this pulse is received by the Applanix POSAV unit, and the corresponding record is marked with an "event true" flag. This mechanism ensures, theoretically, a one to one correspondence between POSAV records and scanlines. However, some minor adjustments performed by the onboard recording SW modifies the scenario: some scanlines are generated at the end of each imaging run, and no corresponding event pulse is sent to POSAV. A specific marker bit, stored with each scanline, makes it possible to identify these extra lines in the AHS image and therefore to perform the corresponding correction in synchronization. The installation of Applanix IMU on top of the AHS body is done with the help of engraved marks, in order to minimize misalignment. Nevertheless, boresight calibration flights are planned each time the IMU is mounted back on the AHS. From the analysis of the 2005 boresight flight, it is estimated that in a normal installation the resulting misalignment is below 1 pixel. 2.4. Laboratory calibration equipment The main element of the calibration setup is a Labsphere 90 cm diameter integrating sphere. This sphere is operated periodically to compute calibration coefficients for VIS+NIR+SWIR range. MIR and TIR bands are calibrated continuously on flight by the two onboard reference black bodies, but the AHS test-bench also includes a laboratory blackbody for ground measurements and tests. The spectral calibration is performed by a dedicated monochrometer, with spectral resolution of 0.2 nm. There are a small group of additional instruments which are used sometimes in specific tasks to help in the calibration or operation of the AHS system. These are: -a differential GPS, which could be used as master station for POSAV post-processing if the support of automatic, public stations is not guaranteed; -a field spectroradiometer GER 1500, which is used for vicarious calibration in the VIS/NIR spectra; -a thermal infrared camera, AGEMA ThermaCam PM595, used for vicarious calibration of TIR bands.
3. AHS PRODUCTS

3.1. AHS processing levels
The Remote Sensing Laboratory performs the processing of the images acquired with the AHS. Different products are
available to the users, according to the processing level, following the classical categories L1a, L1b, L1c, L2.

In the AHS filenames, the processing level is identified with a five character code following the processing level flag
"L". These five characters describe respectively the Radiometric, S-bend, Thermal, bits/pixel (Value) and geolocation
(X,Y) status (RSTVXY order). Any combination of the individual status allowed for those parameters is feasible.
However, only a subset of the possible combinations are nominally offered to the users. These are the ones detailed in
the table 3, along with the nominal procedures used at the INTA processing chain.

identification         format     radiometric processing          geometric processing        specification
L1a                    ENVI       no processing                   no processing               raw data imported to ENVI, 753
(raw data)                                                                                    values per line (includes maker
L0R000                                                                                        bit, BB1-DV and BB2-DV)
L1b                    ENVI       transformation to Ls          no processing                 NedL VIS:
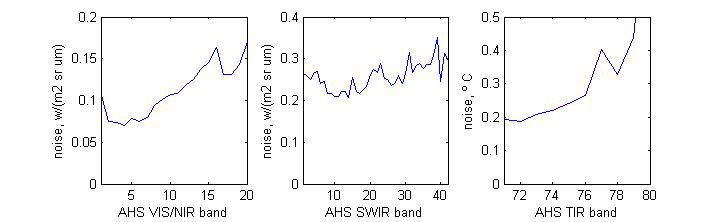
Actual noise figures in the operational environment are currently within specifications for almost all AHS bands, but
slightly over specs in some SWIR bands. Figure 3 displays the values estimated from the standard deviation of black
bodies readings in a flight campaign on June 2005 over Dijle (Belgium).

                         Figure 2. Onboard Blackbody digital counts for different AHS bands.

                 Figure 3: NEdL and NEdT, measured as 1-sigma BlackBody readings, for a June 2005 image.

3.2. Metadata
INTA has put a significant effort in documenting all the AHS image products with complete and accurate metadata.
This is considered a key factor for the efficient use of the data. Clearly, metadata has to be documented according to a
widely accepted standard. Following a review of the status of the art in this field, it was decided to follow the ISO
international standard 19115:2003 "Geographic information: Metadata". This standard is best suited for pure
cartographic information (maps), and is not straightforward to apply it to raster remote sensing images. Specific
standards for such images are planned (specifically ISO19115 part 2, but also ISO19130 for the so-called "sensor
model", which refers mainly to the description of the image acquisition process and its geometric properties), but are
still in development stages.

A second input used to define the AHS metadata is the Norma Española de Metadatos (NEM). The NEM is a profile
(i.e., a subset of the ISO19115 metadata which is coherent and complete for certain purpose) recommended by the
Spanish public institutions to be used as core of any geographic metadata compilation.
Finally, INTA has created its own AHS profile as a extension of the Spanish NEM, complemented with some elements
taken (in advance) from the draft standard ISO19130 or completely new when it was required. This profile has been
implemented in XML following the schema proposed in the draft standard ISO19139. This is itself a hard task, as the
schema puts a high number of constraints in the structure of a metadata file, constraints that are not easy to test or
validate. So, a dedicated SW tool (INTA Metadata Editor, IME) has been developed to help in the generation of the
XML files structure; IME is available for public download at www.crepad.rcanaria.es. This tool is used to create for
each campaign and for each processing level what is call the "master MD file". A second tool is used to fill
automatically this master file with the specific values for each image and processing level, so that metadata generation is
done with a minimum operator time. The final output is therefore a text file with XML structure, which is attached to
each image product.
4. APPLICATION: THE HYPERVAL PROJECT
Hyperval is a project aimed to test the use of airborne imaging spectrometers in precision agriculture. It is funded by the
Spanish national R+D programme. The project partners are IAS-CSIC (acting as coordinator), INTA, Universidad de
Valladolid and the Global Change Unit of the Universidad de Valencia.
One of the partial objectives is to test the feasibility of detecting water stress in olive trees (Olea europaea L.) by
monitoring the tree temperature. Both the objective and the method are interesting challenges, as water stress in olive
trees is usually not easy to detect, and individual tree temperature is difficult to asses due to the complex mixture of
leaves, branches and soil that compose all pixel in an image of a olive parcel, even at 2-meter spatial resolution. A wide
spectral coverage is thus required: VIS/NIR bands are used to isolate tree pixels and eventually to check plant health
through usual remote sensing parameters (for example LAI), while TIR information is the main magnitude to be
measured. The methodology and some result are being currently published3, confirming the great potential of this
techniques in precision farming.
AHS image acquisition campaigns were planned in 2004 and 2005. The flight campaign design was difficult for two
reasons. First, several overflight times within the same day were required to test if the thermal differences (if any)
between water stressed trees and well irrigated trees were more significant at a particular time of the day; this tight
schedule, together with the requirement of flying other test site in the same day, put a nice set of constraints to the
airplane operation. Second, coordination with ground teams was critical: the ground teams sampled the olive trees for
leaf water potential and other parameters relevant for detecting plant status and performed atmospheric and thermal
measurements to enable a proper radiometric correction of the images; therefore, timing was to be as accurate as
possible and the operation window reduced to the days the ground team was available.
The 2004 campaign was affected by the arrival of a southern, dusty air mass. So, overflights had to be delayed for two
days, and finally took place on July 25th 2004 with the planned schedule being covered with a maximum of 15 minutes
delay. The 2005 campaign was mainly a repetition of the 2004 one. This time, no atmospheric troubles were present,
and the campaign took place on the planned day and following the planned schedule.
Once all flight data was recorded, the AHS data were converted to L1b data (at-sensor radiance); figures 4 and 5 show
some results both in the VIS/NIR and TIR spectral regions. Next, the project partners have been responsible for
atmospheric correction, including emissivity correction in the thermal bands. During this process, some radiometric
problems were detected and corrected, thus fulfilling one of the project goals.Figure 4: AHS at-sensor radiance @ 10.56 um through a
olive trees row. The periodic minima corresponds Figure 5: VIS/NIR at-sensor radiance for an individual olive
approximately to individual trees. The peak in pixel #10 tree.
corresponds to a missing tree in the olives row 9.
L1c images have not been produced for these scenes, as the methodology used to identify single trees and to obtain their
crown temperature rejects any resampling algorithm. However, accurate georeferencing is critical for some other of the
partial objectives in Hyperval, focused on fruit crops with a smaller spacing than olive trees or on vineyards. In these
cases, the ground truth and image data matching must rely on absolute geographic coordinates; this is a demanding task,
and the success depends on the available auxiliary data. The image in figure 6 shows a georeferenced AHS image in
Barrax (Spain), where geolocation accuracy is satisfactory; for this case, terrain is nearly flat and a 1:5000 DEM was
used. However, in non-flat areas where no suitable DEM is available the results obtained are not so good. It is assumed
that high resolution DEMs are currently the limiting input for the AHS system geolocation capabilities.
Figure 6: Sample georeferenced AHS image (Barrax, Spain). Vectors correspond to Spanish national cartography5. CONCLUSION AND FUTURE WORK
The AHS is an instrument designed to help the remote sensing community in a wide range of applications. With a
monochrometer, an integrating sphere, an Applanix POSAV 410, and a differential GPS station, the INTA-AHS system
is ready to provide hyperspectral images with the required quality for quantitative analysis. ENVI, PARGE and
ATCOR, plus some in-house developments, guarantee a proper processing of the images to L1b, L1c and L2 images.
External inputs, as atmospheric measurements and high resolution DEMs are not part of the system, and so must be
provided by users and planned in a case by case basis.
Future improvements of the system include purchasing a VIS to SWIR ground spectroradiometer to help in the data
radiometric calibration, and further automatization of image processing to shorten delivery times. In the field of
instrument/product characterization, we plan to measure and monitor the AHS spatial response (MTF).
Finally, the generation of metadata following the ISO19115 standard is considered a critical point to guarantee the
utility of the AHS images for the principal user or for the scientific community through their inclusion in earth
observation inventories and data bases. In this field, future work is to create templates and tools to allow the users a
friendly display of metadata when no specific tool is available at their side.
6. REFERENCES
1. Remo Bianchi, Carlo M. Marino, Stefano Pignatti , "Airborne hyperspectral remote sensing in Italy", Recent
Advances in Remote Sensing and Hyperspectral Remote Sensing, Pat S. Chavez, Jr., Carlo M. Marino, Robert A.
Schowengerdt (Eds), Proc. SPIE Vol. 2318, p. 29-37, Dec. 1994.
2. Jeffrey S. Myers, "MODIS and ASTER airborne simulators", Earth Observing Systems IV, William L. Barnes
(Ed.), Proc. SPIE Vol. 3750, p. 269-273, Sep 1999.
3. G. Sepulcre-Cantó, P.J. Zarco-Tejada, J.A. Sobrino, J.C. Jiménez-Muñoz, and F.J. Villalobos, "Spatial
variability of crop water stress in an olive grove with high-spatial thermal remote sensing imagery", Precision
Agriculture ’05, J.V. Stafford (Ed.), pg. 267-272, Wageningen Academic Publishers, 2005.
Figure 6: left- AHS radiometric resolution as a function of gain level for two bands. right-Spectral responsivity of some
AHS thermal bandsYou can also read