The Living Circle A Case for Micro Living Real Estate Investments in Europe - Corestate Capital

Page created by Amber Vasquez
 
CONTINUE READING
The Living Circle A Case for Micro Living Real Estate Investments in Europe - Corestate Capital
The Living Circle
A Case for Micro Living Real Estate Investments in Europe
The Living Circle A Case for Micro Living Real Estate Investments in Europe - Corestate Capital
1   Micro Living – a multifaceted asset class

2   COVID-19

3   Micro Living Market Environment

4   Student Apartment Market

5   Co-Living Market

6   Serviced Apartments Market

7   Assisted Living Market
The Living Circle A Case for Micro Living Real Estate Investments in Europe - Corestate Capital
The Living Circle

Micro Living Real Estate Investments in Europe

Executive Summary

•   We see Micro Living as a young and dynamic asset class of which student housing,
    serviced apartments, co-living and independent & assisted living are sub-segments
•   Demand for Micro Living is broad based: Demographic trends are multi-faceted and                       Student
                                                                                                           Housing
    diverse and generate demand for a wide range of concepts of living, which can be
    captured with specific concepts and strategies
•   Modern businesses generally require employees to be well trained,
    internationally experienced and flexible, further strengthening demand
    for a variety of Micro Living solutions
                                                                                            Independent   Micro         Serviced
•   While Micro Living properties’ usage is clearly residential based,                       & Assisted
                                                                                                          Living
                                                                                                                       Apartments
                                                                                               Living
    they share aspects of commercial real estate investments:
•   Micro Living properties are mostly operator-run under a master lease, bearing
    a form of single tenant risk; the building structures, however, are often close
    to the classic residential sector, maximising the alternative use potential
•   Being operator run assets, Micro Living investments typically feature a                                Co-Living
    longer than usual lease contract
•   At an operator level, shorter individual tenancies allow for regular rent adjustments
•   As a result, as an investment product, Micro Living assets may benefit from a higher
    initial yield profile than the classic residential segment
    Micro Living investments can be an attractive and higher yielding alternative to the classic residential sector,
    but require a specific expertise and market knowledge to manage risks and maximise returns
                                                                                                                                    3
The Living Circle A Case for Micro Living Real Estate Investments in Europe - Corestate Capital
1. Micro Living – A multifaceted asset class
The Living Circle A Case for Micro Living Real Estate Investments in Europe - Corestate Capital
The Living Circle

The Demographics Strata

Demographic and societal changes in Europe are creating multifaceted opportunities for real
estate investors over the coming years and are making Micro Living relevant in several stages of
life. Investors will be able to adopt multiple strategies to capture opportunities.

           • Co-Living                                                                                       • Serviced apartments
           • Co-working                                              Millennials             Generation X    • Branded residences
           • Serviced apartments                                      (1981 – 1996)          (1965 – 1980)   • Business apartments
                                                                      97.8m (19%*)           108.3m (21%*)

          • Student apartments                                   Generation Z                Baby Boomers
                                                                     (1997 – 2012)           (1946 – 1964)    • „Golden age living“
          • Co-working office
                                                                     82.7m (16%*)            124.8m (24%*)    • Senior living concepts
          • Serviced apartments
                                                                                                              • Assisted living

Population figures for the EU; *percentage of total population

Sources: Organisation for Economic Co-operation and Development (OECD), CORESTATE Research
                                                                                                                                         5
The Living Circle A Case for Micro Living Real Estate Investments in Europe - Corestate Capital
The Living Circle

The “Living Circle”

Micro Living offers concepts for various stages of life

                                                                                           • Business travellers
           • Business travellers
                                                                                           • Professionals and executives
           • Young professionals
                                                                                           • Project workers
           • Project workers                                   Co-Living   Serviced        • Employees starting a new job
           • Expatriates                                                   Apartments      • Commuters
           • Job nomads
                                                                                           • Tourists visiting city

           • Students                                                                      • Retired professionals
                                                                Student    Independent &
           • Erasmus students                                                              • “Golden Agers”
                                                                  Living   Assisted
           • Post Doc/ Ph.D.                                                               • Seniors who seek a high level
                                                                           Living            of autonomy combined with
             students
                                                                                             privacy with the benefit of
           • Project workers
                                                                                             supervision or assistance
                                                                                             as needed

Sources for pictures: Joyn, Youniq, Envato Elements Pty Ltd.
                                                                                                                             6
The Living Circle A Case for Micro Living Real Estate Investments in Europe - Corestate Capital
The Living Circle

The buzz word “Micro Living“

Sources: Screenshots – various online articles
                                                 7
The Living Circle A Case for Micro Living Real Estate Investments in Europe - Corestate Capital
The Living Circle

Micro Living Concepts

No services                                                       Selective services on demand                                     Services included
Traditional Residential                                                                                                                 Micro Living

           Segment     Student/Micro Apartments       Co-Living                      Assisted Living                 Serviced Apartments
             Zoning    Residential                    Residential                    Residential                     Commercial
                                                                                     •   Retired professionals       •   Business travellers
                       •   Students
                                                                                     •   Golden Ager                 •   Professionals and executives
                       •   Erasmus students
                                                      •   Business travellers        •   Best Ager                   •   Project workers (B2B and B2C)
                       •   Post Doc/ Ph.D. students
 Main target group                                    •   Young professionals        •   Seniors who seek a high     •   Returnees (expats)
                       •   Research assistants
                                                      •   Project workers                level of autonomy and the   •   Employees starting a new job
                       •   Young professionals
                                                                                         benefit of supervision or   •   Commuters
                       •   Project workers
                                                                                         assistance as needed        •   Tourists visiting city
                       Modern furnishings                                                                            Lifestyle furnishing with individual
                                                      Modern furnishings             Furnishings adapted
         Furnishing    (fully equipped kitchen                                                                       furnishings (including a fully
                                                      (fully equipped kitchenette)   to senior users
                       or kitchenette)                                                                               equipped kitchenette)
                                                                                     • TV Lounge
                       • Common area with                                                                            •   Co-working
                                                                                     • Fitness studio
                         leisure facilities                                                                          •   TV lounge
                                                      • Common area with leisure     • Spa
                       • Learning                                                                                    •   Fitness facilities
    Common areas                                        facilities                   • Common area with leisure
                       • TV and laundry rooms                                                                        •   Laundry room
                                                      • laundry room                   amenities
                       • Fitness facilities                                                                          •   Food and Beverage offer
                                                                                     • F&B offer (depending on
                         (depending on site)                                                                             (depending on site)
                                                                                       site)
      Period of stay   + 1 year (no upper limit)      + 3 months (no upper limit)    + 1 year                        + 1 day (upper limit: 6 months)

                                                                                                                                                            8
The Living Circle A Case for Micro Living Real Estate Investments in Europe - Corestate Capital
The Living Circle

Micro Living assets are mostly operator-run

Classic residential                                 Micro Living                                                   Micro Living lease terms
                                                                                                                   •   Micro living concepts typically consist of a multi-party
                                                                                                                       set-up, comprising, the landlord, an operator and the
                                                                                                                       ultimate customers
        Investors                                        Investors
                                                                                                                   •   Typically, the micro living lease terms with operators
                                                                                                                       are long-term, exceeding 10 years
                                                    ‚Single tenant‘
                                                    Lease between                                                  •   The form of the lease can vary from a classic lease to
                                                 Operator and landlord                                                 management contracts as well as hybrid forms, consisting
                                                                                                                       of a base rent plus a turnover-based component
                                                                                                                   •   The operator is responsible for the facility management,
                                                                                                                       the management of third-party service providers and the
                                                                                                        Service        operation of the business including strategic set-up,
                                                        Operator                                                       marketing and leasing and rent collection
   Rental payment:                                                                                     providers
     Individually                                    Occupier rental
     by occupiers                                       payments                                                   Micro Living brands (examples)*
                                                       to operator

                                                                                            Additional
                                                                                             services

                                                  Branded Micro
                                                   Living Facility

*Linked Living, Youniq and Joyn are CORESTATE entities, Source: CORESTATE Research, Brands’ websites
                                                                                                                                                                                  9
The Living Circle A Case for Micro Living Real Estate Investments in Europe - Corestate Capital
The Living Circle

Excerpt 1: Asset Management I

Operational insights: Asset Management: Why it is not ‚just‘ residential
                                                                                                                                   •
Innovative concepts of living are essential in today‘s highly mobile times. Demographic and urbanisation processes as
well as a shortage of housing in Europe‘s metropolises cause traditional forms of living and residential unit sizes to be
insufficient to satisfy demand. Here we see Micro Living offering smaller, fully furnished and serviced apartments as a
viable solution.

Within CORESTATE, we run four different micro living concepts, YOUNIQ, Linked Living, JOYN and CRM in the UK, which
are specifically tailored to a variety of target users like expats, students or project workers. By segmenting our
                                                                                                                                   Lambros Reppas
                                                                                                                                   Head of Asset Management
operational entities, we are in the position to meet the requirements of very individual demand groups. This complexity            Micro Living & Residential
is both challenging and exciting.                                                                                                  Lambros has 15 years of experience in
To assess individual assets from an operational and asset management perspective, we identify the potential target                 Real Estate /-Finance, Investments and
                                                                                                                                   Asset Management, most recently at
audience including the number and distance of universities in the market (student housing) or relevant companies or
                                                                                                                                   AXA Investment Manager.
trade fairs (micro living). Ultimately, our supply and demand analysis results in a forecast of the all-in rent per unit that is
                                                                                                                                   Lambros is Managing Director of Asset
achievable at the location as well as the expected cost side to assess the economic viability of a project. As we offer our
                                                                                                                                   Management Micro Living &
tenants a stable all-in cost, a precise estimate is essential. A few example aspects to be considered here are:
                                                                                                                                   Residential, he is responsible for the
• How will we deal with the summer months in student housing when the semester term ends and student move out?
                                                                                                                                   operating units of our two subsidiaries
• What does a student or student apartment need today and – similarly important – in the future?
                                                                                                                                   Upartments – with the brands JOYN,
• Is there any risk to demand for a serviced apartment asset, if, for example, a certain company or industry that the
                                                                                                                                   Youniq and Linked Living – as well as
   asset benefits from is facing difficulties?
                                                                                                                                   CRM Students. His focus lies on the
To answer these and other questions, a high degree of expertise, experience and local market knowledge is key (see                 operational performance, strategic
market study, next page). Micro Living is a complex and unique asset class, that requires a dedicated team of experts on           direction and expansion of the Micro

various levels. If that perquisite is met, it is well suited to deliver strong returns to investors.                               Living and Residential business units in
                                                                                                                                   Europe.

                                                                                                                                                                              10
The Living Circle

Excerpt 1: Asset Management II

Sneak-Peek: Local micro living analyses

                                                                                                   Lambros Reppas
                                                                                              Head of Asset Management
                                                                                               Micro Living & Residential

Market analyses
• In depth analysis to capture supply
  and demand at a city level for a
  variety of micro living concepts
• With people on the ground in 7
  countries, and an international
  Micro Living track record, we are                                 Micro Living Facility 1
                                                                    Micro Living Facility 2
  well equipped to address the asset                                Micro Living Facility 3
                                                                    Micro Living Facility 4
  class’ challenges                                                 Micro Living Facility 5

Source: CORESTATE Asset Management analysis using various sources
                                                                                                                            11
The Living Circle

ESG integration enhances value for investors and the society

ESG as a value driver for investors                                                                         Micro Living – an answer to today´s challenges
A proactive application of environmental                                                                    As the housing shortage in prime locations surges, the
and social criteria delivers benefits for investors:                                                        implications of the digital age has had a detrimental effect on
                                                                                                            social communities. As real life interactions have been
                                                                                                            changing and oftentimes decreasing, loneliness has become
                                                                                                            an issue of significant proportions. The U.S. has recently
                                                         Environmental Reporting                            labeled it epidemic, requiring public health intervention and
                                                         provides detailed information on CO2               the U.K. has appointed a Loneliness Minister. This is not
                                                         emissions, consumption and cost
                                                                                                            without reason, as mortality risk significantly increases with
                                                                                                            higher perceived rates of loneliness, similarly as smoking 15
                                                         Cost Optimisation
                                                         through data-driven sustainable                    cigarettes a day does1. COVID-19 only aggravates this
                                                         asset management                                   situation according to mental health experts2.
                                                         Formalised Approach                                Equipped with social spaces, working stations and trained
                                                         of sustainability in the asset life cycle          staff, micro living contributes to a solution to the issue of
                                                                                                            loneliness. Creating a social community beyond the spaces is
                                                         Social Factors                                     a crucial element of the operating concept.
                                                         like mobility and community are
                                                         key considerations in micro living

1https://journals.plos.org/plosmedicine/article?id=10.1371/journal.pmed.1000316, 2https://www.mentalhealth.org.uk/coronavirus/coping-with-loneliness
                                                                                                                                                                            12
2. COVID-19
The Living Circle

COVID-19 I

The pandemic is the most impactful social, cultural and economic event of our generation

The COVID-19 pandemic had been confronted with unprecedented measures to contain its         Impact on property
impact and flatten the curve of infections. Now increasingly health and security measures
                                                                                             At a very macro level, the effects of the COVID-19 pandemic will mostly concern the
are being relaxed. However, at the time of finishing this document in early June 2020, the
                                                                                             income (rental) side of the real estate market, while the yield side should remain relatively
further development of the COVID-19 pandemic remains clouded with many unknowns. As
                                                                                             defensive – supported by the low interest rate environment, which will support investor
a result, both the short-term economic outlook as well as the impact on commercial and
                                                                                             demand for property. The income side strongly depends on economic activity and is
residential real estate markets remain difficult to predict. We have, however, formulated
                                                                                             complex and heterogenous among property sectors and geographies. While residential,
macro scenarios that we believe are likely to materialise.
                                                                                             with its high diversity of tenants and relative inelasticity of demand, is likely to be the least
Impact on the economy                                                                        affected in the current environment, impacts on the retail, hotel and leisure side are direct
                                                                                             and deep. On the investment side, which is highly impacted by the interest rate situation,
The short-term impact on the economy will be severe. We are in the middle of a rare global   particularly the core end of the market should remain a stable asset during the downturn.
recession and it becomes increasingly likely that Europe’s economic decline will be more     Core meaning specifically security of income, which is quality and length of the tenancy.
pronounced than during the 2008/09 GFC recession. The short-term impact on the labour
market is unprecedented around the globe. To support the economy and labour markets,
governments implement stimulus packages and central banks have become very
accommodative very quickly. As a result of this and the overall market uncertainty,
government bond yields for countries seen as safe have plummeted to all-time low levels.
In this ‘even-lower-for-even-longer’ interest rate environment, higher yielding asset
classes, like real estate, are likely to see strong investor demand.

Source for picture: Envato Elements Pty Ltd.
                                                                                                                                                                                            14
The Living Circle

COVID-19 II

The impact of COVID-19 on micro living is diverse

Impact on Micro Living                                                                                      Co-living
The impact of COVID-19 on micro living is diverse and dependent on the specific sub-class.                  Co-Living rental agreements tend to be longer term of three, six or more months.
It also differs at a country level. While there will be a short-term impact for most micro                  Anecdotal evidence suggests that the impact on the existing Co-Living facilities was
living segments, we believe that structural trends will support growth in a mid- to long-                   relatively low. In case of re-letting a unit or initial letting in a new building, the situation
term perspective and outweigh cyclical distortions. Nevertheless, the deep economic                         was more difficult, due to the lower short-term demand for concepts that tailor to business
recession dictates a high degree of selectiveness and risk awareness for serviced living                    travellers and young professionals.
asset investments. Below is a macro view of the expected short-term impact on the
                                                                                                            Student housing
individual micro living segments:
                                                                                                            The short-term impact so far has been relatively low. As an operator we have noticed that
Serviced apartments                                                                                         occupancy rates in most student housing facilities have remained high. The COVID-19
While serviced apartments tend to tailor to a similar guest cohort as business hotels, the                  impact has been higher, the more the asset is tailored to international students. In the mid-
average length of stay is typically longer. From our experience, as a result most existing                  term the situation of student housing assets strongly depend on the further development
long-term occupations remained intact when COVID-19 hit, while the impact was more                          of the pandemic and how universities react to it. Just recently, for example, Oxford
significant in the shorter-stay segment. As a result, occupancy rates for serviced apartment                University announced some digital-only courses in 2020. While such measures have not yet
units remained somewhat higher than for classic hotels helped by long-term occupiers but                    been announced in other countries like Germany, it is a decisive factor to observe.
fell significantly overall. As the situation normalises and particularly international travel
recovers, so will occupancy rates.
                                                                                                            Assisted Living
                                                                                                            Tailored to the elderly population, assisted living occupants tend to be counted as a
                                                                                                            high-risk cohort, so safety measures were typically high.

*market expert panel discussion - Urban Living Webinar: Investor Sentiment, Source for picture: Envato Elements Pty Ltd.
                                                                                                                                                                                                         15
3. Micro Living Market Environment
The Living Circle

European Economy

COVID-19 causes a significant (and global) recession / high uncertainty remains

GDP Growth                                                                                                                               Consensus forecast:
                                                                          Germany                   Euro Zone                           range of contributions
   12
   10
    8
    6                                                                                                                                                            5.9%
                                                                                                                                                 5.0%
    4
    2
    0
   -2
   -4                                                                                                                                           max
   -6                                                                                                                             Mean: -6.3%
   -8                                                                                                                                                   -8.1%
  -10
  -12                                                                                                                                           min
  -14
           2005       2006      2007       2008      2009       2010      2011        2012   2013    2014   2015   2016   2017   2018   2019    2020     2021

• While some easing efforts from the lockdown measures are                                     • A significant recession, which is more pronounced than 2009’s
  under way in Europe it remains highly uncertain what the                                       GFC is probable.
  economic impact of the COVID-19 pandemic will be.
• As a result, the range of GDP forecasts for this year and next
  remains the highest it has ever been.

Sources: IMF, Macrobond, Consensus (May 2020), Oxford Economics, CORESTATE Research
                                                                                                                                                                  17
The Living Circle

European Interest rate situation

Accommodative central banks and market risk aversion are pushing government bond yields down
Government bond yields (by maturity in years)
                            1               2              3               4   5   6        7         8        9         10
     Switzerland
        Germany
            Japan
    Netherlands
           Austria
         Sweden
        Denmark
           France
         Belgium
            Spain
         Portugal
              Italy
                                                                                                                                 Yield is:
          Norway
               UK                                                                                                                        positive
             USA                                                                                                                         negative

• With low or negative fixed income yields, real estate is seen as                 • In Germany, for example, the yield spread between 10-year
  an attractive and higher yielding alternative asset class                          government bonds and prime student housing yields was close
• There is a clear divide in risk perception between core and                        to 400 bps at the end of 2019
  southern Europe

Sources: Investing.com as of June 2020; WSJ, Savills, CORESTATE Research
                                                                                                                                                    18
The Living Circle

European Demographics

•     Demographic trends are multifaceted and diverse.            Population pyramid Germany                                                                                       Population pyramid EU
      Clearly, there is a megatrend of an ageing population,       ≥ 85                                                                                       85 and over
      with strong growth rates of the 60+-agers.               80 to 84                                                                                           80 to 84
                                                               75 to 79                                                                                           75 to 79
                                                               70 to 74                                                                                           70 to 74
•     At the same time, there is a new tech-savvy              65 to 69                                                                                           65 to 69
                                                               60 to 64                                                                                           60 to 64
      generation entering the workforce as well as a           55 to 59                                                                                           55 to 59
      growing number of 15 to 24 year-olds in Europe.          50 to 54                                                                                           50 to 54
                                                               45 to 49                                                                                           45 to 49
                                                               40 to 44                                                                                           40 to 44
•     There is a continuous trend of urbanisation, which       35 to 39                                                                                           35 to 39
                                                               30 to 34                                                                                           30 to 34
      tends to drive the young working-age-population into     25 to 29                                                                                           25 to 29
      the economic, cultural and education hubs.               20 to 24                                                                                           20 to 24
                                                               15 to 19                                                                                           15 to 19
                                                               10 to 14                                                                                           10 to 14
•     In the context of digitisation, knowledge capital as a     5 to 9                                                                                             5 to 9
                                                                 0 to 4                                                                                             0 to 4
      production factor is becoming increasingly important                                            2019          2029                                                                                              2019   2029
      to ensure competitiveness and innovative strength.
      These experts need direct exchange and cooperation                                                                   % of urban population                                                                                    AT
                                                                  105
      and increasingly live and work in corresponding
                                                                   95                                                                                                                                                               FR
      agglomeration clusters and metropolitan areas.
                                                                   85                                                                                                                                                               DE
•     In the short term, the urbanisation trend could be           75                                                                                                                                                               NL
      slowed by people considering to move into the more           65
                                                                                                                                                                                                                                    ES
      rural surrounding areas of urban centres in response         55
      to the COVID pandemic. However, we don’t expect                                                                                                                                                                               IT
                                                                   45
      this to break the general trend of urbanisation.             35
                                                                                                                                                                                                                                    UK
                                                                          1950
                                                                                 1955
                                                                                        1960
                                                                                               1965
                                                                                                      1970
                                                                                                             1975
                                                                                                                    1980
                                                                                                                           1985
                                                                                                                                  1990
                                                                                                                                         1995
                                                                                                                                                2000
                                                                                                                                                       2005
                                                                                                                                                              2010
                                                                                                                                                                     2015
                                                                                                                                                                            2020
                                                                                                                                                                                   2025
                                                                                                                                                                                          2030
                                                                                                                                                                                                 2035
                                                                                                                                                                                                        2040
                                                                                                                                                                                                               2045
                                                                                                                                                                                                                      2050
                                                                                                                                                                                                                                    SE

Sources: Eurostat; OECD
                                                                                                                                                                                                                                         19
The Living Circle

Demographic cohorts – what shapes and defines them

Demographic cohorts in Europe are shaped by the common experience of increasing technological,
societal and economic development of Europe overall. Nevertheless, for every generation there are
key experiences and circumstances that shape the way they think and behave.

                            Baby Boomers              Generation X                      Millennials                 Generation Z / Zoomers
                            (1946 – 1964)             (1965 – 1980)                     (1981 – 1995)               (1996 – 2012)
 Age bracket 2020           56 - 74                   40 – 55                           24 - 39                     8 -23
 Percentage of              24%                       21%                               19%                         16%
 population (2020)

 Influential                Cold War                  End of Cold War                   9/11 terrorist attacks      Effects of Great Recession
 experiences                Post-War boom             Fall of Berlin Wall               PlayStation                  on their parents
                            “Swinging Sixties”        Live Aid                          Internet and Social media   Global warming &
                            Apollo Moon landing       Introduction of first PC          Invasion of Iraq            environmentalism
                            Youth culture             Early mobile technology           Reality TV                  Globalisation
                            Woodstock                  “Latchkey“ kids;                 Google Earth                Mobile devices
                            Family-orientated         Rising levels of divorce          Economic downturn           Produce own media
                                                                                                                    Cloud computing
                                                                                                                    Influence of social media
 Family experience          Traditional               Women widely expected to work     Merged families             Diverse family structures
                            Mothers often stayed at   outside the home                  Coddled kids                „Bubble wrap generation“
                            home                      The first “day care” generation
                                                      Dual income families

Sources: CORESTATE Research, based on Barclays
                                                                                                                                                 20
The Living Circle

Demographic cohorts – what shapes and defines them

Demographic cohorts in Europe are shaped by the common experience of increasing technological,
societal and economic development of Europe overall. Nevertheless, for every generation there are
key experiences and circumstances that shape the way they think and behave.

                            Baby Boomers                Generation X                      Millennials                  Generation Z / Zoomers
                            (1946 – 1964)               (1965 – 1980)                     (1981 – 1995)                (1996 – 2012)
 Atittude towards           Job Security                Career driven                     Success driven               Highly entrepreneurial
 work                       Workaholic                  But – work as “means to an end”   Lifestyle-orientated         Want jobs to be interesting
                                                                                                                       Career multitaskers
 Values                     Family                      Family                            Freedom                      Diversity
                            Socially liberal            Independence, Transparency        Flexibility                  Equality
                            Prosperity                  Balance                           Happiness – living for the   Self actualization
                                                                                          moment                       Stability & security
 Characteristics            Largely conservative        Imaginative innovators            More educated than           Socially aware
                            Idealistic and visionary    Pragmatism                        previous generations         Global attitude
                            movements                   Seek life balance                 Connected                    Environmentally conscious
                            Optimistic                  Self-reliance                     Self-confident               Distrust and frustration with
                            Property owners                                               Environmental attitude       politics and corporations
 Techonology                Innovators and early        Digital pioneers                  Digital natives              Mobile natives
                            adopters of PC technology

 Signature product          Television                  Personal Computer                 Tablet / Smart Phone         VR / Self-Driving Cars / 3D printer
 Housing                    Mostly homeowners; some     Mostly homeowners, often with     Mostly renters               First renters (Student Housing) or
                            downsizing to senior        large mortgage                                                 still living home
                            accommodation

Sources: CORESTATE Research, based on Barclays
                                                                                                                                                             21
The Living Circle

European Demographics

•     One third (34 percent) of households in the EU were                           Percentage of single person households in 2018
      single-person households in 2018.                                   60%

•     According to calculations by the Federal Statistical Office, the    50%

      number of one-person households in Germany is expected to           40%
      rise by a further 4% to 44% by 2035, representing almost 19         30%
      million one-person households. This expected growth relates         20%
      to an additional demand of about 730.000 one-person
                                                                          10%
      apartments.
                                                                              0%
•     As the above example indicates, the demand for apartments                     EU    BE    DK    DE      IE   ES      FR    IT   NL    AT   PL   PT    SE   UK
                                                                                    28
      in Europe will exceed the change in population as living
      circumstances keep evolving. This is particularly the case for
      smaller apartments.                                                      Percentage of single households per age group in 2018
                                                                         50
•     In Europe, there generally is a north-south disparity, with
                                                                         40
      larger households in the south. Broken down in age groups,
      the age cohort with the largest share of single-person             30

      households are the 65+-year-olds.                                  20

                                                                         10

→ The mobility of the population, the urbanisation trend, as well        00
                                                                                   SE      DK        NL       DE        AT       FR        IT    PL        UK    ES
as the growth in demand for smaller residential units is expected
to remain high. We therefore expect demand for Micro Living                        15 to 29 years         30 to 49 years        50 to 64 years    65 or more years
concepts to remain strong in the longer-term.

Source: Eurostat
                                                                                                                                                                      22
The Living Circle

Excerpt 2: Investment Management

Operational insights : Why a dedicated Micro Living team is key
While Micro Living as an investment class has evolved out of the niche, it remains a relatively young
sector that requires a specific expertise and market knowledge. Being a young asset class, it still is a
relatively non-transparent market segment that is also less liquid than, say, the classic residential
market.
Therefore successful sourcing capabilities depend on a number of aspects, most notably recognition
and track record in the market as well as a local network on the ground. As an early mover in the          Tobias Gollnest
segment, we have closed Micro Living transactions of 10.000 units representing a transaction volume
                                                                                                           Group Head of Investment
of EUR 1.4 bn and acquired CRM, a leading UK based student housing operator, managing 23.000
units. Another 5.500 units are in the pipeline as of June 2020.                                            Tobias Gollnest is responsible for
                                                                                                           all national and international
                                                                                                           purchases/sales of commercial
As an operator asset class, the                                                                            properties and products in the
investment process is highly complex                                                                       CORESTATE Capital Group, as
                                                                                                           well as the two investment
A high share of the roughly 197 Micro Living assets
                                                                                                           areas Micro Living and
we analysed in 2019* comprises project                                                                     Residential.
developments. While developments and forward
funding deals add to the complexity of a                                                                   Before joining CORESTATE, the
transaction, it helps securing assets in a highly                                                          lawyer worked for the FREO
                                                                                                           Group and Merrill Lynch. During
competitive environment.
                                                                                                           his career, he was responsible
To ensure a successful investment process and                                                              for transactions with a total
profitable venture in the long run, of course, a high                                                      volume of over € 6 billion.
degree of exchange and collaboration with the
individual teams very early in the process is key.

* Number of sourced opportunities in 2019
                                                                                                                                             23
The Living Circle

Micro Living Investments – Emerging from the niche

• Investor demand in the Micro Living sector has increased                                                                             Europe – Micro Living* transaction volume
                                                                                                            EUR bn
  remarkably over the last 10 years, reaching an all-time high                                               16
  of about EUR 14 bn in 2019 for Europe.                                                                     14
                                                                                                             12
• While varying considerably from year to year, on average the
                                                                                                             10
  transaction volume rose by 40% p.a. since 2010.
                                                                                                              8
• Typically, a relatively high share of the micro living market is                                            6

  traded as portfolio deals. As such, during the twelve months to                                             4
                                                                                                              2
  end of March 2020, 65% of the transaction volume was
                                                                                                              0
  generated by portfolio transactions.

                                                                                                                   Q1 2010
                                                                                                                             Q3 2010
                                                                                                                                       Q1 2011
                                                                                                                                                 Q3 2011
                                                                                                                                                           Q1 2012
                                                                                                                                                                     Q3 2012
                                                                                                                                                                               Q1 2013
                                                                                                                                                                                         Q3 2013
                                                                                                                                                                                                   Q1 2014
                                                                                                                                                                                                             Q3 2014
                                                                                                                                                                                                                       Q1 2015
                                                                                                                                                                                                                                 Q3 2015
                                                                                                                                                                                                                                           Q1 2016
                                                                                                                                                                                                                                                     Q3 2016
                                                                                                                                                                                                                                                               Q1 2017
                                                                                                                                                                                                                                                                         Q3 2017
                                                                                                                                                                                                                                                                                   Q1 2018
                                                                                                                                                                                                                                                                                             Q3 2018
                                                                                                                                                                                                                                                                                                       Q1 2019
                                                                                                                                                                                                                                                                                                                 Q3 2019
                                                                                                                                                                                                                                                                                                                           Q1 2020
• While the UK was – and still is – a leader in the micro living
                                                                                                                                                           Rolling 4-Quarter Volume                                                        Quarterly Volume
  investment market, more recently the share of the other
  European countries has risen notably over the last few years.
                                                                                                                  United Kingdom                                     France                        Germany                        Sweden                         Netherlands                                 Other

→ As the transaction volume rose, the Micro Living asset class                                                                     7%                                                                                                                           12%
                                                                                                                 6%
  became not only more liquid, but also more transparent.                                                      2%                                                                                                                                3%
                                                                                                                                                                                                                                                4%
→ As such, Micro Living’s risk profile has eased and it has
                                                                                                             7%                                                                                    +51%
                                                                                                                                                                                                                                           9%
  become an institutional asset class. In fact, over the last                                               5%                         2015                                                                                                                               2019
  three years, institutional investors have been the strongest or                                                                                                                                                                                                                                                59%
  second strongest net buyer in the sector in Europe.                                                                                                                                                                                           13%
                                                                                                                                                                     73%

* Long-stay, limited service hotel; student housing; senior housing, Source: Real Capital Analytics (RCA)
                                                                                                                                                                                                                                                                                                                           24
The Living Circle

Significant yield spread over classic residential

• The increased demand for micro living assets is reflected in                                                                                         Europe – Average yields by sector
  the pricing profile.                                                                                             7%

• Both the classic residential market as well as the micro                                                         6%
  living market have experienced yield compression over the
                                                                                                                   5%
  last couple of years.
• On average, across Europe, net initial yields were 5.1%                                                          4%

                                                                                                                         Q1 2010
                                                                                                                                   Q3 2010
                                                                                                                                             Q1 2011
                                                                                                                                                       Q3 2011
                                                                                                                                                                 Q1 2012
                                                                                                                                                                           Q3 2012
                                                                                                                                                                                     Q1 2013
                                                                                                                                                                                               Q3 2013
                                                                                                                                                                                                         Q1 2014
                                                                                                                                                                                                                   Q3 2014
                                                                                                                                                                                                                             Q1 2015
                                                                                                                                                                                                                                       Q3 2015
                                                                                                                                                                                                                                                 Q1 2016
                                                                                                                                                                                                                                                           Q3 2016
                                                                                                                                                                                                                                                                     Q1 2017
                                                                                                                                                                                                                                                                               Q3 2017
                                                                                                                                                                                                                                                                                         Q1 2018
                                                                                                                                                                                                                                                                                                   Q3 2018
                                                                                                                                                                                                                                                                                                             Q1 2019
                                                                                                                                                                                                                                                                                                                       Q3 2019
                                                                                                                                                                                                                                                                                                                                 Q1 2020
  during the first quarter of 2020.
• While being volatile over time, on average, micro living                                                                                                                                 Classic residential                                             Micro Living
  properties featured a yield premium over classic
  residential of 110 bps.
  5
                                                                              Europe – Prime net yields 2019*

  4

  3

  2

*Prime net yields as of end 2019 or latest available; due to the COVID-19 impact and a very limited transparency in the market, more recent pricing indication often is not available,
                                                                                                                                                                                                                                                                                                                                  25
** Gross yield netted down; **** B-Market average, Sources: RCA; PMA; Savills; Knight Frank; CBRE; Riwis, bulwiengesa, CORESTATE
The Living Circle

Excerpt 3: Development

Operational insights: Good communication with all stakeholders is key!
 In order to be able to develop a well thought-out and designed Micro Living product, various aspects must be
 considered:
 • Sustainability to optimise value for owners and users
 • Flexibility for a possible asset conversion in case of changing market conditions
 • Forward-looking - both in the short term because of the duration of a development project (approx. 3 years) and in
   the long term because of the operating time of +10 years of a micro living object until the first revamp is necessary          Peter Wittel
                                                                                                                                  Head of Project Development
 • Branding & design - a profile and character of the asset adapted to the target group/customers                                 Germany
 When searching for land or existing properties, it should be considered that, depending on the target group, the
                                                                                                                                  Peter has more than 25 years
 operation of an object is usually only really profitable starting at 100 units (young professionals, commuters, etc.) or
                                                                                                                                  experience in all areas of
 150 units (students). In addition, the location must fit the target group (e.g. city centre or proximity to campus.
                                                                                                                                  project development &
 It is important to engage all parties involved in the project implementation at an early stage - e.g. neighbourhood              management, facility &
 information, utilities, road traffic offices, local authorities and neighbourhood associations - as “building today for          property management,
 tomorrow” should not only lead to acceptance but also to identification and enthusiasm for the project.                          operational optimisation and
 Likewise, the general contractor or the most important subcontractors, e.g. elevator technology, heating, ventilation,           risk management of
 sanitation and air conditioning, must already be involved in the preliminary design phase. This ensures, for example,            commercial, residential and
 that the built-in recesses match the furniture and the furniture does not have to be adapted to the building later. In           special-purpose properties like
 order to use both time and money as effectively as possible, very effective coordination is essential when building on           refurbishments, museums,
 an inner-city plot that is difficult in terms of construction logistics. In addition, the operator must already be involved in   hospitals and monument listed
 an advisory and informative capacity when the business plan is drawn up and regularly updated during the construction            buildings as well as in
 phase. After completion it is important to transfer all the experiences gained into the next or parallel running projects        transaction management in
 in order to become even better and more effective.                                                                               Germany.
 Developments can be successfully realised if one acts in a preventive, appreciative, open and respectful manner and is
 prepared to lend a hand for the overall success and to make decisions quickly and with clarity. In this way, companies
 can gain the partners they need to realise a (building) project together.

                                                                                                                                                                    26
4. Student Apartment Market
The Living Circle

Introduction – Student Housing

What distinguishes purpose-built student housing from private rented apartments?
• The unit mix is designed for student occupancy
• The property is operated and leased on a ‘by-the-bed’ basis,
  with fully furnished units and a rental period of 6 months
  minimum
• Usually there is a range of amenities included in student
  housing projects, as well as high-speed internet service

Student Housing – then and now
• Student requirements have risen over the years due to the increasing choice available
• There is a tendency towards private rooms rather than shared dormitories
• Nowadays, it is no longer about ‘a bed’; students want larger rooms, double beds,
  study space, communal space, excellent customer service and hassle-free living
• With regards to services, focus on wellbeing and security continues to gain momentum
• Events are aimed at helping students to connect with each other; no longer
  “beer-and-pizza focused”, there is now a wide range of events on offer to suit
  all tastes – from fitness classes, to meditation, to cooking lessons

Source for pictures: CRM Students
                                                                                          28
The Living Circle

Student Housing – Historic development

Student Housing – development as an asset class

•     The private, purpose-built, student housing market emerged                   •       In Europe, investment in private student housing initially
      originally in the US in the early 1990s. The sector was                              focussed on the UK and then expanded to other European
      developed in response to outdated on-campus                                          countries. In 2015, Savills saw the student housing market as
      accommodation, coupled with growing demand from                                      recognised as a mainstream real estate asset class with
      domestic and international students seeking superior living                          worldwide potential.
      space. The expansion of the sector has seen an increase in
      higher-quality, single student rooms in purpose-built
      residences, both on and off campus.

                                             Student Housing – Transaction Volume
 20.000.000.000
 18.000.000.000
 16.000.000.000
 14.000.000.000
 12.000.000.000
 10.000.000.000
  8.000.000.000
  6.000.000.000
  4.000.000.000
  2.000.000.000
              0
                        2007   2008   2009   2010       2011      2012   2013     2014       2015    2016    2017   2018    2019

                                                    Volume Globals ($)   Volume EMEA ($)

Sources: RCA; Savills
                                                                                                                                                      29
The Living Circle

Generation Z‘s lifestyle drives Student-living

Generation Z students’ lifestyle- with increased mobility and demands for connectivity and services
– drives demand for modern student housing. Private PBSA* is especially well positioned to adapt
and respond to the special requirements and needs of Generation Z students – and internationally
mobile students in particular.

                  Education is seen as the most important good.   Generation Z being digital natives, expect to find
                  Generation Z is highly driven and competitive   digital excellence and connectivity in student
                  and see higher education as a launch pad to a   housing
                  career

                  In consequence there is an increasing number    Millennials and Generation Z students (and their
                  of internationally mobile students              parents) expect MORE and want to see clear
                                                                  value from their purchases, including from
                                                                  student housing
                  There is a strong focus on achieving academic
                  excellence as Generation Z competes with a
                  global workforce

*PBSA refers to Purpose Built Student Accomodation
                                                                                                                       30
The Living Circle

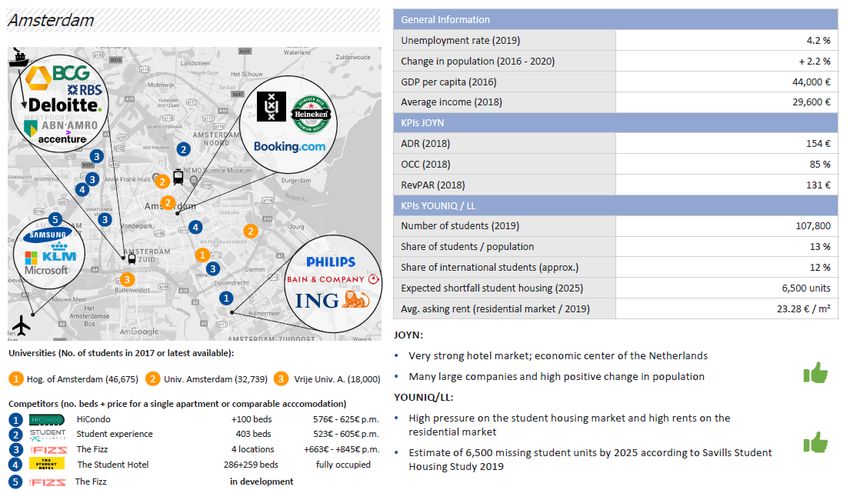
Student Apartments Markets in Europe

Some markets are acutely undersupplied to meet the
demand for beds of local and international students

                                                                                                                    Student housing supply rate
                                                                                                                          0–5%
        United Kingdom                                  Germany                                                           6 – 10 %
    1.97m full time students                   2.87m full time students
                                                                                                                          11 – 20 %
  23% international students                 14% international students
                                                                                                                          21 – 30 %
   No. of units: approx 627k                  No. of units: approx 316k
                                                                                                                          > 30 %

              Sweden                                       Spain                                     Poland
    0.41m full time students                   1.56m full time students                   0.80m full time students
  11% international students                  8% international students                 8.5% international students
    No. of units: approx 94k                   No. of units: approx 93k                   No. of units: approx 80k

               France                             The Netherlands                                      Italy
    2.62m full time students                   0.73m full time students                   1.89m full time students
  13% international students                 10% international students                  4% international students
   No. of units: approx 350k                  No. of units: approx 130k                   No. of units: approx 57k

Sources: National statistical offices and ministries of higher education; The Class of 2020 – „Trend Report 2020“
                                                                                                                                                  31
The Living Circle

European Student Apartment Market

• Most of the European countries this study focusses on have                                           European countries by size of student body
  registered a steady increase in student numbers over the past                            3.500.000
  ten years. Germany, the UK and France have seen the biggest                              3.000.000
  increase in numbers.
                                                                                           2.500.000
• According to UNESCO, the UK, France, Germany,                                            2.000.000
  Italy and the Netherlands are among the top 20 destinations
                                                                                           1.500.000
  for global students studying abroad.
  This is one reason for the relatively strong increase                                    1.000.000

  in student numbers compared to other European countries.                                  500.000

• However, there is a general trend towards higher education                                      0
                                                                                                         DE    UK    NL      FR     IT   DK   PL      ES     SE    AT
  with a rising proportion of the population in Europe pursuing a                                                         2008    2013   2018
  university education. In the OECD member countries, for
  example, the share of the population aged 25 to 34 holding a                                                Number of international students
  tertiary exam has gone up from 35% in 2008 to 44% in 2018.                                 500.000
                                                                                             450.000
• We expect demand for higher education to keep rising in a                                  400.000
  longer-term perspective, because global businesses                                         350.000
  increasingly require well trained employees. This will                                     300.000
                                                                                             250.000
  strengthen demand for student accommodation.
                                                                                             200.000
                                                                                             150.000
                                                                                             100.000
                                                                                                       07/08 08/09 09/10 10/11 11/12 12/13 13/14 14/15 15/16 16/17 17/18
                                                                                                                          UK       DE      FR

Sources: Eurostat; National statistical offices and ministries of higher education; OECD
                                                                                                                                                                        32
The Living Circle

European Student Apartment Market

• The university sector is becoming more commercialised on an                           Number of English Taught Programmes (Bachelors /Masters)
  international scale and the number of English Taught
                                                                                        1800
  Programmes (ETPs) is increasing across Europe as universities                         1600
  seek to attract the best (and ultimately more) students.                              1400
  Students have increasing choice in terms of destination, cost,                        1200
  and method of study. The cost of a degree across European                             1000
  universities differs significantly with many countries offering                        800
  free or limited cost study.                                                            600
                                                                                         400
• A more internationally mobile, more flexible student                                   200
  population with more choice in what and where they study                                   0
  means that demand for student accommodation is expected to                                       AT      NL       FR    IT     DK      PL      ES      SE      DE
  remain high.
• Of the QS World University Rankings 2019, 381 European                                     Tuition fees at public universities per academic year in €
  universities are listed, roughly 38% of all universities, with the                             For EU/EEA students     For students from other countries
                                                                                        AT                    -          726.72
  UK (76 universities), Germany (45), and France (35) the most                          NL       700 – 2,100             8,000 – 20,000
  significant contributors.                                                             UK       10,725                  7,000 – 40,000
                                                                                        FR       170 – 650               170 – 650
                                                                                        IT       0 – 5,000               0 – 5,000
                                                                                        DK                    -          6,000 - 16,000
                                                                                        PL       500 – 8,000 (English)   1,000 – 8,000 (English)
                                                                                        ES       150 - 3,500             1500 – 4500
                                                                                        SE                    -          7,500 – 25,500
                                                                                        DE                    -          3,000 in Baden Württemberg; otherwise free

Sources: CORESTATE Research; QS Quacquarelli Symonds Ltd. - World University Rankings
                                                                                                                                                                      33
The Living Circle

European Student Apartment Market

• The European student accommodation investment landscape                          Transaction volumes in Europe in €m
  has continued to evolve in the past year and competition and       60
  transaction activity intensified, reaching a transaction volume    50
  of almost €9 bn in 2019.
                                                                     40
• In 2019, the strongest investment activity was seen in the UK
  (+84% year-over-year to €6.2bn) and France (+232% year-over-       30

  year to €1.2bn). In these markets large portfolio deals were       20
  closed in 2019.
                                                                     10
• The student housing market is still dominated by the UK, but
                                                                      0
  expanding stock is seen in France, Germany and the                        2010   2011     2012 2013 2014 2015 2016 2017           2018   2019
  Netherlands in particular.                                                                    Student Housing Multifamily

                                                                               Student Housing Yields in Europe Q2 2019
                                                                    6,00%
                                                                    5,00%
                                                                    4,00%
                                                                    3,00%
                                                                    2,00%
                                                                    1,00%
                                                                    0,00%
                                                                              DK       FR      DE       IT   NL      PL       ES      SE        UK
                                                                             Prime net multifamily yields    Prime net student housing yields

Sources: RCA; Savills
                                                                                                                                                     34
The Living Circle

Excerpt 4: Operational Management

Operational insights
Integrated operational management is the key for success
It is commonly understood that the European market lags both the UK and US markets for maturity within
the micro-living space. Whilst some may see this as a challenge, it can also be viewed as an outstanding
opportunity. Key learnings for success can be utilised from these two markets to ensure that the operational,
or ‘delivery side’ of the business is optimised to deliver the real asset value.

CRM Students was the UK’s largest independent manager of student accommodation in the UK, with over                  Stewart Moore
20,000 beds under management. Now part of the CORESTATE Group, the operating platform which the CRM                  Chief Executive Officer
team now manages has expanded beyond the UK and now covers Poland in the east, Spain and Portugal in                 CRM Students
the South, UK and the DACH region. The next expansion will see management of schemes in Italy, Ireland
and the Nordics. The sectors in which CRM operates have also expanded with co-living, micro-living and BTR           Originally starting out in advertising
now being managed. Operating in these markets and sectors, with almost 400 staff delivering value day in,            agencies, Stewart Moore worked at
day out to our clients, provides unique insight into the needs and wants of the key audience - an important          McCann-Erickson before moving to
factor for the success of Micro Living products.; today’s students will be the target audience for co-living and     Saatchi & Saatchi to be a member of
in turn will become a driver for the BTR market.                                                                     their experiential and B2B team.
                                                                                                                     In 2011 Stewart joined CRM as
Integrating the operating platform into investment and asset management is fundamental to continued
                                                                                                                     Marketing and Commercial Director
success. As an operating platform, CRM recognises the ‘real-world’ opportunities and challenges, and these
                                                                                                                     and was appointed as CEO in 2018.
can be fed in to the entire process; from initial research to acquisition and then in a cyclical relationship with
the asset management team. The complete management cycle enables assets to be developed and acquired                 At CRM he is responsible for
which will deliver predictable value over their entire lifetime.
                                                                                                                     • Management services provided
More and more funds and investment houses recognise these benefits and are forming long-term strategic                   to nearly 30,000 beds across
partnerships with operating platforms and in some cases, purchasing a platform to ensure that value is                   Europe
maximised.                                                                                                           • Almost 400 staff delivering value
                                                                                                                         day in, day out to clients.

                                                                                                                                                              35
The Living Circle

European Student Apartment Market Comparison

                                                                                                      % students
                                                    International                                                             No. of units        No. Of English             PBSA supply                Adjusted
  Country                  Total students                                     Prime Yield         live away from
                                                        students                                                                  approx.          programmes                       rate            supply rate**
                                                                                                           home

  Sweden                             0.41m                       37k                 4.25%                      87%                  96000                     1199                     23%                 27%

  Germany                            2.87m                     374k                  3.70%                      79%                316000                      1342                     12%                 13%

  The
                                     0.73m                       86k                 4.10%                      58%                130000                      1690                     18%                 28%
  Netherlands

  UK                                 1.97m                     458k                  4.50%                    81%*                 627000                        n.a.                   32%                 37%

  Poland                             0.80m                       78k                 5.75%                      59%                  80900                      678                     10%                 16%

  France                             2.62m                     341k                  4.25%                      67%                340000                      1086                     13%                 18%

  Denmark                            0.27m                       34k                 4.00%                      92%                  68000                      460                     25%                 27%

  Spain                              1.56m                     121k                  5.10%                      45%                  94000                      194                      6%                 12%

  Italy                              1.89m                       97k                 5.00%                      31%                  57000                      425                      3%                   9%

Sources: National statistical offices and ministries of higher education; The Class of 2020 – „Trend Report 2020“; Savills; Eurostudent.eu; The Sodexo International University Lifestyle Survey;
                                                                                                                                                                                                                36
CORESTATE Research, *source:www.officeforstudents.org.uk **based on % of national students living away from home and international students
5. Co-Living Market
The Living Circle

Introduction – Co-Living

What distinguishes co-living from regular                               Co-Living – Still a comparatively new
housing?                                                                segment within Micro Living

• Co-living is aimed at and designed for digital or job nomads,         • Co-living as an industry is still at an early development stage
  young professionals and project workers who value flexibility         • The most dynamic region in the world for co-living is Asia. The
  to move and community with like-minded people                           region has exhibited the strongest growth in co-living spaces
• Properties are operated and leased on a ‘by-the-bed’ basis,             globally and is gaining increased institutional interest from
  with a rental period of 12-18 months on average                         global investors. By comparison, the existing US and European
• Units come fully furnished and usually accompanied by an                markets are much smaller, currently with a focus on the
  inclusive range of amenities and services                               Germany and the UK. From there, co-living has developed also
                                                                          in other large cities in Europe.
• Currently lacking a clear definition, there are different co-living
  concepts available – ranging from self contained apartments           • The concept currently appeals to the target audience that is
  with shared spaces in large apartment blocks to houses with             most willing to live in community: the millennials. However,
  bedroom units and shared bathrooms, kitchen and lounges.                some industry experts believe that there will be a rise of more
  In this document, we concentrate on concepts with a stronger            inclusive co-living spaces, including those focussed on
  focus on community and sharing                                          multigenerational and family living.

Source for pictures: Envato Elements Pty Ltd.
                                                                                                                                            38
The Living Circle

Millennials’ lifestyle drives Co-Living

Due to globalization and digitisation, Millennials and Generation Z are increasingly mobile when it
comes to their jobs and their home. Co-Living appeals to this demographic – offering flexibility,
designed spaces, a range of services for hassle free living and community with like-minded people.

                    As a consequence of globalisation and               According to a study, the gig economy appeals to
                    digitalisation, employees change their job more     four in five millennials and Zoomers. This in
                    often and move to another city or another           combination with their wish to travel makes
                    country.                                            project work or short-term assignments abroad
                                                                        interesting for Millennials and Zoomers and has
                    Millennials stay single longer and start a family   lead to the emergence of the so-called “nomad
                    later than the generations before them. This        lifestyle”
                    puts homeownership in the background.
                                                                         In order to make the most of their experiences,
                                                                         Millennials want to be able to have access to a
                    Shifting consumption habits mean less focus on       range of services that facilitate hassle free
                    owning cars or apartments but a preference for       living.
                    experiences and sharing
                                                                         Even though highly connected, Millennials can
                                                                         struggle with loneliness, do not have an easy
                                                                         time making friends and may long for
                                                                         community.

                                                                                                                           39
The Living Circle

Co-Living Markets in Europe

Currently, a few major European cities dominate the
co-living market in Europe

                 Germany                                           France                                            Top 5

      Largest market currently in                          3rd largest markets                                       Medium size market
               Europe                                  by number of current beds
                                                                                                                     Small market
  Supply spread across Top7 cities*                         Paris is main focus

                                                           The Netherlands
           United Kingdom
                                                   Smaller pure co-living market in
     2nd largest market in Europe                   Europe as spaces available in
    London largest market by city                   Amsterdam closer to serviced
                                                            apartments

                  Belgium                                         Sweden
     4th largest market in Europe                     Smaller market with current
     Focus is currently on Brussels                      focus on Stockholm

                    Spain                                          Austria
      Smaller market with few co-                   Smaller market with some beds
      living beds available yet but                   available and good pipeline
              solid pipeline                                  Focus on Vienna

*Top 7 cities are: Berlin, Frankfurt, Munich, Stuttgart, Cologne, Hamburg, Düsseldorf , Source: CORESTATE Research
                                                                                                                                          40
The Living Circle

European Co-Living Market - Supply

• Since 2015, global investment into co-living developments has       Largest Co-Living Markets by City:
  increased threefold each year. There is a substantial pipeline of   1.   London
  co-living projects across Europe.
                                                                      2.   Berlin
• In terms of already available co-living space, Germany, the UK      3.   Paris
  and France are Europe’s largest co-living markets.                  4.   Frankfurt
• Nearly three-quarters of the current co-living stock can be         5.   Brussels
  found in the top 4 cities.                                          6.   Munich
                                                                      7.   Copenhagen
• Many new co-living developments are projects from
  established developers of student housing, with all-inclusive
  bills and regular community events. Others are developed by
  coworking providers, with the added benefit of a coworking
                                                                      Top 5 Providers in Europe
  membership in the rent.
                                                                      Provider                             Number of beds
• Currently, several different concepts are being pursued under
                                                                      Homefully                                      923
  the term co-living - some closer to the serviced apartment
  concept, others more oriented towards the shared flat               The Collective                                 900
  concept.                                                            Station F                                      600
                                                                      LifeX                                          358
• We focus on the shared living concept than on the concept of
                                                                      Quarters                                       356
  self-contained units with their own kitchen and bathroom.

Source: CORESTATE Research using various sources and providers
                                                                                                                            41
The Living Circle

European Co-Living Market - Demand

• In our globalised, digitalised world, professionals often change                                          • This development is reflected in the development and supply
  jobs and move to another city in the process. Internships in                                                of co-living space. While co-living in Europe focused mainly on
  different countries, project work and fixed-term contracts                                                  London and Berlin initially, there can now be found an
  attract young professionals to the major hubs of Europe.                                                    increasing number of co-living spaces in other large European
• Europe has generated more tech IPOs than the US for the last                                                cities.
  five consecutive years. And while investment focused mostly
  on the top three cities (London, Berlin and Paris) in 2015,
  capital flows into European Tech has extended to a range of
  other large cities in Europe by the end of 2019. Among these
  are Barcelona, Lisbon, The Hague, Munich, Zürich and Dublin.

  Capital flow – European Tech                                   Capital flow – European Tech                                 Top 10 Cities for Millennials*
  2015                                                           2019                                                          • Berlin
                                                                                                                               • London
                                                                                                                               • Amsterdam
                                                                                                                               • Barcelona
                                                                                                                               • Cologne
                                                                                                                               • Manchester
                                                                                                                               • Hamburg
                                                                                                                               • Bristol
                                                                                                                               • Paris
                                                                                                                               • Munich

Sources: Atomico (UK) Partners LLP - State of European Tech Report 2019; Nestpick Global Services GmbH -2018 Millennial Cities Ranking, *Nestpicks 2018 Millennial Cities Ranking
                                                                                                                                                                                    42
6. Serviced Apartments Market
The Living Circle

Introduction – Serviced Apartments

What distinguishes serviced apartments from
regular housing and hotels?                                                                             Development of the Serviced Apartment segment
• Serviced apartments have been growing in popularity as an                                             • Serviced apartment units/rooms offer more space than classic
  alternative accommodation concept since the 1990s – initially                                           hotel rooms and a kitchenette. The self-contained apartments
  in the US and from there also in Australia and Asia.                                                    resemble micro-apartments, but are available for shorter rent
• While there were still only 114,000 units in Europe in 2016, the                                        periods and are considered “commercial” use;
  market has expanded in Europe to now 204,733 units in 4,068                                           • units come fully furnished and both short to medium (1-28 days)
  locations.                                                                                              and long (28+ days) stays are possible
• While supply was initially very fragmented across smaller                                             • the property is operated and rented on a ‘by-the-bed/unit’ basis
  providers, the number of serviced apartments in branded                                               • Usually there is a range of amenities and services included, such
  residences has increased in recent years.                                                               a laundry rooms, fitness facilities, etc.

Source for pictures: Joyn, Sources: CORESTATE Research, The Global Serviced Apartments Industry Report 2020-2021
                                                                                                                                                                        44
The Living Circle

The Mobile Society drives Serviced Apartments

Serviced Apartments appeal to a certain demographic with a particular lifestyle and mind-set.
The main target audience are business travellers (Generation X), but also project workers or job
nomads (Millennials), seeking a product with a more residential flair, with flexible length of stay,
while not sacrificing location, service, amenities or quality.

              Companies are increasingly interested in              Business travellers now more often combine
              booking serviced apartments for business              travel for work with leisure travel. Serviced
              travellers rather than hotels to save on costs        apartments offer maximum flexibility for
                                                                    extended work and private travel

              Generation X and Millennials appreciate               “Nomad lifestyle“ of Millennials is driven by
              independence, flexibility, but also the possibility   flexible working, the desire for a global life and
              to use common rooms - if they feel like it. The       also the need to travel and creates demand for
              feeling of privacy for the duration of the stay is    the flexibility serviced apartments offer
              perceived as luxury, as is a ”home, away from
              home“-feeling

                                                                                                                         45
The Living Circle

Serviced Apartments Markets in Europe

                                                                                        Top 3
          United Kingdom                                       Ireland
    Largest market with the strongest              Crrent stock focuses on Dublin       Medium size market
            pipeline in Europe
                                                  Strong pipeline for the next three    Small market
     Focus on London, Manchester &                              years
               Edinburgh

               Germany                                         Austria
                                                 Vienna among the top 15 cities for
      2nd largest market and strong
                                                      pipeline units in Europe
   pipeline spread over the top 7 cities

                                                               Poland
                 France
                                                  Relatively new market with good
  Strong expansion over recent years            pipeline due to increased interest in
  and solid pipeline over the next four                          CEE
                  years
                                                          Focus on Warsaw

          The Netherlands
    Strong focus on Amsterdam with
     more than 50% of the serviced
           apartments supply

Sources: CORESTATE Research; The Global Serviced Apartments Industry Report 2020-2021
                                                                                                             46
The Living Circle

Serviced Apartments offer maximum flexibility

             Segment      Serviced Apartments                                        Hotel

                          Maximum flexibility with both short to medium
    Stay of Duration                                                                 Average stay duration between 1-5 days
                          (1-28 days) and long (28+ days) term stays possible

                          Apartment options include studios, one, two or             Room options usually studios, meeting short stay
     Apartment Size
                          three-bedroom spaces with separate workspace               requirements

                          Daily rate which has an inverse relationship with
                Pricing   duration of stay, thus providing more attractive pricing   Volatile pricing dependent on occupancy
                          than hotels

                                                                                     • Room: Hotel standard bed, desk, bathroom,
                          • Apartment: Hotel standard with (optional) fully
                                                                                       wardrobe, mini-bar
                            equipped kitchen, work/relaxation space
            Amenities
                                                                                     • Communal: Usually limited hour Food and
                          • Communal: (Included) Concierge, fitness centre,
                                                                                       Beverages, fitness centre
                            terrace, laundry facilities, resident lounges

                                                                                                                                        47
The Living Circle

Serviced Apartments Supply

• According to GSAIR, there are currently 1,174,012 serviced               European extended stay market size (US$m)
  apartment units globally in 15,464 locations. In Europe there    3500                                                     7,0%
  are now 204,733 units in 4,068 locations.                        3000                                                     6,0%

• While the serviced apartment market was initially very           2500                                                     5,0%

  fragmented with many small providers, there are now a            2000                                                     4,0%

  number of lifestyle brands offering innovative and stylish       1500                                                     3,0%

  concepts in the market and large hotel groups have expanded      1000                                                     2,0%

  into the sector.                                                 500                                                      1,0%
                                                                     0                                                      0,0%
• Now more than 50% of the serviced apartments available in               2014   2015    2016     2017        2018   2019
  Europe are branded
                                                                                          EU    Growth rate

Source: The Global Serviced Apartments Industry Report 2020-2021
                                                                                                                              48
The Living Circle

Serviced Apartments Demand

• Business travel, assignment and relocation remain the core                              International Tourism – Number of arrivals (in m)
  market for extended-stay products. However, also more and                     90
  more tourists discover serviced apartments as an interesting                  80
  alternative to hotels.                                                        70
                                                                                60
• Global business travel spending reached $1.4 trillion in 2018
                                                                                50
  according to the Global Business Travel Association (GBTA).                   40
• The COVID pandemic has had a strong impact on the travel                      30

  industry, but the drop in occupancy has been less severe in the               20

  serviced apartment sector than in the traditional hotel sector.               10
                                                                                 0
• Experts expect at least a short-term decrease in business travel                   AT       DK    FR   DE          IT          NL          PL   ES   SE   UK
  even after lockdown restrictions are eased. Providers of                                                    2010        2015        2018

  serviced apartments could, however, compensate for losses
  due to fewer business travellers by increased interest from
  leisure travellers. Especially in the short-term, travellers will be
  interested in accommodation with reduced exposure to shared
  facilities and a large number of people, and the option to use
  the kitchenette or order food in.

Sources: The Global Serviced Apartments Industry Report 2020-2021; World Bank
                                                                                                                                                             49
You can also read