The Luck of the Draw: The Causal Effect of Physicians on Birth Outcomes - Arlen Guarin Christian Posso Estefania Saravia Jorge Tamayo - Harvard ...
←
→
Page content transcription
If your browser does not render page correctly, please read the page content below
The Luck of the Draw: The Causal
Effect of Physicians on Birth
Outcomes
Arlen Guarin
Christian Posso
Estefania Saravia
Jorge Tamayo

Working Paper 22-015
The Luck of the Draw: The Causal
  Effect of Physicians on Birth
  Outcomes
  Arlen Guarin
  University of California, Berkeley

  Christian Posso
  Banco de la Republica de Colombia

  Estefania Saravia
  Harvard business School

  Jorge Tamayo
  Harvard Business School

 Working Paper 22-015

Copyright © 2021 by Arlen Guarin, Christian Posso, Estefania Saravia, and Jorge Tamayo.
Working papers are in draft form. This working paper is distributed for purposes of comment and discussion only. It may
not be reproduced without permission of the copyright holder. Copies of working papers are available from the author.
Funding for this research was provided in part by Harvard Business School.

The Luck of the Draw:
   The Causal Effect of Physicians on Birth Outcomes

   By ARLEN GUARIN, CHRISTIAN POSSO, ESTEFANIA SARAVIA, JORGE TAMAYO ∗

                                         February 21, 2021

                                                Abstract
             We estimate the effect of physicians on health outcomes by exploiting a Colombian
         government program that randomly assigns newly graduated physicians to hospitals
         across the country. Using administrative data from the program, vital statistics records,
         and individual records from the mandatory field-specific college graduation exams, we
         show that more-skilled physicians improve health at birth of infants whose mothers
         received care in those hospitals during their pregnancy. We show that the mechanisms
         underlying the results are the time physicians spend with the patient and their success
         in targeting care toward the most vulnerable patients.

       Keywords: Physicians’ skills, health birth outcomes, experimental evidence
       JEL Codes: H51, I14, I15, I18

   ∗
    Guarin: University of California, Berkeley (email: aguariga@berkeley.edu); Posso: Banco de la Republica
de Colombia (email: cpossosu@banrep.gov.co); Saravia: Harvard University, Harvard Business School (email:
esaravg@gmail.com); Tamayo: Harvard University, Harvard Business School (email: jtamayo@hbs.edu). The
opinions expressed herein belong to the authors and do not necessarily reflect the views of Banco de la
Republica or its Board of Directors. We thank Manuela Cardona, along with Santiago Velasquez, Silvia
Granados, Gabriel Suarez, Nicolas Mancera and Brayan Pineda for excellent research assistance. We thank
Maria Aristizabal, Francesco Bogliacino, Leonardo Bonilla, David Card, Kaveh Danesh, Margarita Gafaro,
Robert Gonzalez, Hilary Hoynes, Rembrand Koning, Juliana Londono, Edward Miguel, Paul Rodriguez,
Emmanuel Saez, Molly Schnell, Christopher Walters, Danny Yagan and seminar participants at Banco de la
Republica, ESSEN health conference 2020, EEA congress 2020, Universidad Eafit, Universidad del Rosario,
Development and Labor Lunch (at UC Berkeley) for insightful comments. We also thank the Colombian
Ministry of Health, the Administrative Department of Statistics - DANE and the Instituto Colombiano para
la Evaluación de la Educación - ICFES for providing access to the data and insighful discussions.

                                                    1
1 Introduction
Origins of inequality can be found as early as the nine months that infants are in utero. These
critical months shape children’s endowments at birth, which have been shown to be predictive
of future abilities and health trajectories that cannot be explained by genetics (Almond et al.,
2005; Currie, 2011; Currie and Almond, 2011). In trying to understand the causes of such
differences in birth outcomes, most of the literature has focused on parents’ decisions during
pregnancy, families’ socioeconomic conditions (Currie, 2011), environmental factors (Currie
and Schwandt, 2016b), and access to the health system in the extensive margins (Currie and
Gruber, 1996; Finkelstein et al., 2012) and intensive margins (Almond et al., 2010). Yet an
unresolved important question is whether more-skilled healthcare professionals can improve
health outcomes at birth.
In this paper, we break a new ground by providing causal evidence on the role that
skilled physicians play in newborns’ health at birth. Studying this matter is important
because physicians are arguably the health professionals who make the greatest contribution
to patient health (Das and Hammer, 2005) and can affect investments in utero that determine
infants’ health at birth. Moreover, poor health at birth has long-lasting adverse impacts on
future outcomes (and the outcomes of the next generation) such as earnings, education, and
disability (Adhvaryu et al., 2018; Almond et al., 2018; Currie, 2011; Persson and Rossin-
Slater, 2018).
The lack of causal evidence regarding physicians’ effect on birth outcomes is not sur-
prising, since answering this question poses a substantial empirical challenge. It requires to
account for the selection bias associated with the match between physicians and hospitals
or patients (Doyle et al., 2010).1 We overcome this challenge by exploiting a Colombian
government program that randomly assigned 2,365 physicians to 592 small hospitals. We
estimate the impact on the 104,358 children whose mothers received care in those hospitals
during their pregnancy, using administrative data from the program, vital statistics records,
and individual records from mandatory field-specific college graduation exams.
We leverage data available on teams of newly graduated physicians in Colombia. Colom-
bia requires medical school graduates to work for the first year of their career in the national
Mandatory Social Service (SSO), which randomly assigns them to hospitals across the coun-
try. We combine several rich granular administrative records and collect data on the reports
1
There is an extensive literature on positive assortative matching (PAM) that affirms that companies and
high-productivity workers match together (for instance, Abowd et al., 1999; Becker, 1973; Kremer, 1993;
Roy, 1951; Shimer and Smith, 2000; Woodcock, 2008).
2published by Colombia’s Ministry of Health after the SSO lotteries.2 There are few measure-
ments of the skills of recent medical graduates; we use individual records from the mandatory
field-specific college graduation exams to measure physician skills. Finally, we link the hospi-
tals to which doctors were randomly assigned to the national Vital Statistics Records (VSR),
from which we obtain birth outcomes and maternal sociodemographic characteristics.
Our random assignment setting has many advantages. For example, hospitals’ charac-
teristics do not covariate with physicians’ skills, and new physicians arriving at a specific
hospital have access to the same facilities as well as the same administrative and health staff.
Also, by comparing across hospitals, we can estimate the causal effect physicians have on
patients’ health outcomes.
We find that an increase of one standard deviation in the college graduation exam scores
of the team of physicians assigned to a hospital decreases the probability of low birth weight
by 7.4%. These effects are consistent across alternative health measures at birth: we also
find a negative impact of 10% on prematurity and a 13.7% decrease in the probability of low
Apgar scores.3
To shed light on the potential channels through which physicians can impact child out-
comes, we first analyze several heterogeneous effects across different mothers’ characteristics.
Although the effects are slightly more pronounced among first-time mothers,4 mothers with
low education, and married women, the differences between groups are not statistically dif-
ferent. We then estimate effects separately for male and female newborns. It has been well
established that in utero, males are more vulnerable to health shocks than females (Eriks-
son et al., 2010; Kraemer, 2000; Naeye et al., 1971; Pongou et al., 2017). We investigate
whether skilled physicians help to mitigate adverse shocks in utero. Although the reduction
in low birth weight was particularly pronounced among male newborns, we do not find any
statistical difference between male and female newborns.
Further, using health measures at the hospital level for the years before the SSO cohorts
we consider in this paper, we study heterogeneous effects between hospitals with high and
low incidence of poor newborn health during the three years before the cohorts we analyze.
The effects on low birth weight are driven by hospitals with a high incidence of poor newborn
health, which we define as the hospitals in the top quartile of the low birth weight baseline
2
We focus on the lotteries that took place between 2013 and the third quarter of 2014.
3
According to WHO (2016), Almond et al. (2005) and Gonzalez and Gilleskie (2017), prematurity is
highly correlated with low birth weight and mortality. The Apgar score has also been used in the literature
as an indicator of health at birth; for example, Almond et al. (2010) and Lin (2009).
4
Similar to a large fraction of the literature, main estimates throughout the paper are based on first-time
mothers.
3incidence distribution. We find that an increase of one standard deviation in college grad-
uation exam scores decreases low birth weight by 11.7% in hospitals with a high incidence
of poor health at the baseline. Similar results are found in prematurity and Apgar score.
Thus, more-skilled physicians improve low birth weight, prematurity, and Apgar score, but
these effects are driven by hospitals with a high (pre-program) incidence of poor newborn
health.
We next explore two key mechanisms through which physicians may improve health at
birth. First, we study the time physicians spend with the mother during pregnancy. We
split the data between teams of physicians for whom the mother’s gestation period falls
completely within the 12-month period that the physician spent in the hospital and the
complement (i.e., mothers who had only partial exposure). We find much stronger effects in
cases when the mother has more exposure time to the physicians.
Second, we explore the role of the number of prenatal consultations. According to WHO
(2016) and the Colombian government (Gomez et al., 2013), better and more frequent pre-
natal care during pregnancy can improve the health of both the mother and her newborn.5
We follow the standard recommended by WHO (2016) in 2013 and define “adequate pre-
natal care” as having at least four visits to the doctor during pregnancy.6 We find that
more-skilled doctors, on average, do not schedule more prenatal checkups.7 We then test
whether the more-skilled physicians target prenatal consultations toward the most vulner-
able mothers, measured as those with predicted likelihood of giving birth to a baby with
low birth weight. We use several machine learning techniques to generate two groups of
predictions about mothers’ low birth weight probability.8 We use a set of mother-hospital
characteristics available for physicians at the time of prenatal care. The results show how,
regardless of the method we use to predict low birth weight, more-skilled doctors do not
increase the suggested number of antenatal consultations with mothers with a low predicted
probability of low birth weight. Still, they seem to target those prenatal checkups toward
5
This is due to the fact that during a prenatal checkup, pregnant women are screened and treated for
risk of complications, avoiding preterm births and other problems. Also, pregnant women are given critical
information on nutrition, diet, and other general mother and child safety practices, which have been shown
to play a crucial role in in utero infant growth (Amarante et al., 2016; Kramer, 1987). Further, in Colombia,
the Ministry of Health requires that prenatal checkups be carried out by physicians (Gomez et al., 2013);
thus, physicians are responsible for prenatal care, and they are the professionals who attend 98% of deliveries.
6
In our sample, 87% of mothers have at least four visits to the doctor.
7
Carrillo and Feres (2019) found no evidence of increase in prenatal care when physicians are replaced by
nurses.
8
We apply four algorithms: random forest, XGBoost (Chen and Guestrin, 2016), neural network (Hoffman
et al., 2018), and logistic regression models.
4more vulnerable mothers, measured as mothers with a higher predicted probability of low
birth weight. Finally, we show that the effects on birth outcomes are particularly pronounced
among mothers with an ex ante high predicted probability of low birth weight. Altogether,
these results are consistent with physicians being time constrained and unable to increase
the average amount of time spent in prenatal consultations but improving the targeting of
care toward the more vulnerable mothers.
To assess the internal validity of our identification strategy, we implement two tests.
First, we assign a placebo treatment to infants born before the arrival of the physicians in
our sample. We run placebo tests similar to our main specification using data for the three
previous years (2010-2012) for which the doctors working at hospitals were randomly assigned
(2013-2015). We find that the treatment generates precisely estimated zeros. Second, we run
similar estimation procedures using the municipality and hospital characteristics before the
physicians’ arrival as a dependent variable and find no significant relationship. Altogether,
we read these results as evidence of the randomness of the assignment of physicians to
hospitals.
Our identification strategy and the availability of granular administrative records allow
us to contribute to several strands of the literature. First, we contribute to the literature on
physicians’ effects on health outcomes. This literature documents the relationships between
health outcomes and healthcare costs (Alsan et al., 2019; Clemens and Gottlieb, 2014; Moli-
tor, 2018), quality of physicians’ academic institutions (Doyle et al., 2010), physicians’ per-
formance on qualifying examinations (Carrera et al., 2018; Tamblyn et al., 2002; Wenghofer
et al., 2009), physicians’ competence (Das et al., 2016)9 , physicians’ ability to facilitate ad-
herence to prescription medications (Iizuka, 2012; Simeonova et al., 2020), physicians’ fees
and payment for performance (Basinga et al., 2011; Ho and Pakes, 2014a,b), general practi-
tioners and specialists (Baicker and Chandra, 2004), and physicians’ communication (Curtis
et al., 2013). To our knowledge, our paper is the first to document experimental evidence of
the impact that more-skilled physicians have on health at birth outcomes.
Our research is also related to the literature that studies the effects of healthcare access
on health outcomes (Almond et al., 2010; Finkelstein et al., 2012).10 In particular, our paper
relates to Currie and Gruber (1996), who show that access to health insurance for pregnant
women lowered the incidence of low birth weight.
9
See Das and Hammer (2005), Das and Hammer (2007), Das et al. (2008), Das and Sohnesen (2007),
Leonard and Masatu (2007), Leonard et al. (2007) for literature studying physicians’ competence.
10
See Aron-Dine et al. (2015), Bardach et al. (2013),Michalopoulos et al. (2012), Anderson et al. (2012),
Anderson et al. (2014) for studies related with the effects of healthcare access on population health.
5Our study adds to the literature on overuse and inefficient resource allocation by physi-
cians and hospitals (Abaluck et al., 2016; Chandra and Staiger, 2020; Currie and MacLeod,
2017). In particular, Abaluck et al. (2016) show that physicians do not target testing to
the highest-risk patients, since observable risk factors receive little attention in physicians’
testing decisions. In this paper, we take advantage of recent advances in machine learning
techniques to show that more-skilled physicians target prenatal consultations toward mothers
with the highest risk of low birth weight.
We add to the large body of research that has studied the origins of inequality at birth
(Black et al., 2007; Chetty et al., 2011; Currie, 2011) and how heterogeneity of endowments
at birth affects future outcomes such as earnings, education, and health (Currie, 2009; Ore-
opoulos et al., 2008; Persson and Rossin-Slater, 2018). We provide new evidence by showing
that children born under the care of less knowledgeable physicians are indeed more likely to
exhibit worse health at birth.
Finally, our paper is related to the literature on teacher value added, where the effect on
students of a high-quality (effective) teacher has proved to be significant (Araujo et al., 2016;
Chetty et al., 2011; Rivkin et al., 2005; Rockoff, 2004). While this literature estimates that a
one standard deviation increase in teacher quality is associated with an increase in students’
test scores of 0.19 standard deviations, we find that a one standard deviation increase in
physicians’ quality decreases the probability of low birth weight by 7.4 percent. Our findings
suggest that, similar to teachers, good doctors have the potential to effect great social value
through better child outcomes at birth.
The rest of the paper is organized as follows: In Section 2, we describe the Colombian
health system and the SSO program, the setting that we exploit to identify parameters of
interest. Section 3 describes the rich administrative data we derive from doctors’ college
exit exams and patients’ outcomes at birth. In Section 4, we introduce our estimation
strategy, while in Section 5, we show evidence on the randomness of physicians’ assignment to
hospitals and present our main estimated effects. Section 6 discusses potential mechanisms,
and Section 7 concludes.
62 Institutional Background and the Experimental Set-
ting
2.1 Institutional Background
According to Colombia’s political Constitution, access to health services is an individual basic
right. The principles of the system are based on progressivity and equity in the distribution
of subsidies and access to health services (Law 100 of 1993). Law 100 of 1993 introduced two
types of health insurance: subsidized and contributive. The contributive regime is made up
of formal employees (and their families) who contribute a fixed share of their employment
income to the system. The subsidized regime is made up of poor household members who
do not have formal employment.11 By 2011, the access to health-care was close to universal,
and even in the poorest population, the coverage was 87%, while in rural areas it was about
88% (Páez et al., 2007)
One of the main characteristics of high coverage is the greater use of reproductive-health-
related services, an essential aspect of reducing risks associated with pregnancy, childbirth,
and infant mortality (WHO, 2016). For our period of analysis, the percentage of women
with at least four prenatal examinations in Colombia is 87.7%, while the percentages of
newborn with low birth weight and prematurity were 8.8% and 9.3% respectively. Still, the
system faces important challenges. In 2017, according to the United Nations database12 , the
neonatal mortality rate (deaths per 1,000 live births) was 7.8 and the infant mortality rate
(infant deaths per 1,000 live births) was 12.2.
An important characteristic of the Colombian health system is that prenatal examinations
must be carried out by physicians. According to the practical guide for the prevention, early
detection and treatment of pregnancy complications by the Colombian Ministry of Health
(Gomez et al., 2013), prenatal visits should be carried out by physicians or nurses specializing
in maternal-perinatal care13 and, in fact, calculations from the VSR show that physicians
are responsible for all prenatal check-ups and 98% of deliveries are attended by physicians.
To become a physician in Colombia, one must study an undergraduate program in
medicine. Similar to the college programs in nursing, bacteriology, and dentistry, medicine is
considered a health program. Students accepted into health programs earn a BA after five to
11
The eligibility for the subsidized regime is defined by the SISBEN score, a household-level wealth score
used to target public program beneficiaries in Colombia.
12
https://data.un.org/, consulted in May 2020.
13
Nurses who have just graduated from college cannot perform prenatal examinations in Colombia.
7six years of education. According to Colombian law, all professionals graduating from health
programs are social servants, and right after graduation, they must provide professional ser-
vices in urban and rural areas lacking access to health services for one year before practicing
as professionals. This service is provided under the Mandatory Social Service (SSO). The
current SSO program was created by Law 1164/2007, but it was only adopted by 2010, when
its implementation was legislated by Resolution 1058/2010. Besides the objective of improv-
ing access and quality of health services in depressed urban and rural populations or those
with difficult access to health services and stimulating an adequate geographical distribution
of human talent in health, the SSO also targets the promotion of spaces for the personal and
professional development of those beginning their careers in the health sector.14
2.2 The experimental setting: SSO program
By 2007, as the number of people getting medical training in Colombia increased, the avail-
able positions for SSO physicians were fewer than the number of applicants. Therefore, how
the applicants were chosen and which hospitals they were assigned became one of the pro-
gram’s most critical decisions. In regard to this decision, the Law 1164/2007 required that
an assignment was to be “guided by the principles of transparency and equal conditions for
all applicants”. In concordance, Resolution 1058/2010 established that decisions regarding
who is selected and for which locations must be made through state-level random draws.
At the end of 2012, a more organized way of running the random assignments was intro-
duced. The first years of implementation of the new SSO program proved that the directions
given by Resolution 1058/2010 were not strong enough to guarantee a transparent and or-
ganized assignment of physicians. Resolution 4503/2012 was introduced to give clearer and
more organized guidance about how the random draws should be conducted. Resolution
566/2012 mandated that starting in January 2013 there would be four yearly waves of SSO
draws15 where professionals who applied to a specific state would be randomly assigned to
the available positions in that state. To avoid strategic application behavior and to take
advantage of the fact that the number of newly graduated physicians was around two times
the number of available positions, Resolution 4503/2012 established that physicians could
apply only to one state and only when the number of applicants for that state was still lower
than two times the number of available places. The aforementioned feature of the process
about the number of available places guaranteed an excess of demand for spots in each state
14
See resolution 1058/2010.
15
Taking place in January, April, July, and October in each of the 32 states.
8and cohort.
After the application process is closed, each state runs a public random assignment of
the available spots for each profession, according to the following steps: First, an oversight
board consisting of one civil servant from the state secretariat of health, and four health
professionals are chosen. The civil servant then publicly announces the number of spots
available and who registered for each profession. At this point, she also states the rules
for the lotteries, typically through the use of ballots. If a health professional gets a white
ballot, then they are exempt of the social service and will receive a certificate that allows
them to work in Colombia as a professional. Otherwise, the professional gets a red ballot
with the code of the specific hospital where they will provide their services as professionals.
If there are fewer professionals than spots available, all professionals registered are assigned
to a hospital. Still, the specific hospital is assigned through the lotteries. Finally, the civil
servant of the secretariat of health prepared a report stating the winners and their assigned
hospitals, as well as the professionals who are exempt from the SSO program.
The social service at the assigned hospitals begins around one or two months after the
draw and lasts for 12 months. If a health professional refuses to work in the place they
were assigned to or unilaterally quits before the official end of the service, they are given
a six-month sanction where they cannot work as health professionals. After that period,
they have to apply to the SSO program again. This sanction imposes strong costs for
quitters and has proved to be a good deterrence for dropping the program.16 The system of
assigning professionals to hospitals randomly lasted for seven draws.17 Since October 2014,
a new centralized system giving more weight to professionals stating preferences and a list
of prioritizations has replaced the random assignment.
The random assignment period is a perfect setting to estimate causal relationships that
would otherwise be difficult to identify. The SSO assignment has implications for both the
professionals who are randomly selected and the communities that get assigned doctors with
various skills. The latter are the focus of this paper; the implications for the professionals
are studied in Guarin et al. (2021). We use the exogenous rule of assignment to compare
the birth outcomes of patients in hospitals who were assigned professionals with different
skills but are otherwise comparable. In this paper, we focus on birth outcomes, given the
relevance of these variables for future human development, and on medium- and long-term
16
We cannot confirm whether physicians did actually work for the hospitals they were assigned to, but
using information from payments to the social security system, we observe that 80% of the winners got a
job as physicians after the draw. This gives us a measure of the level of compliance of the program.
17
All the four 2013 cohorts and the first three of 2014.
9inequalities.
Despite the SSO being mandatory for health graduates of different fields18 , in this paper
we focus on physicians for three reasons. First, it was the profession for which the excess
demand for the state-level draws was clearer, creating perfect conditions for lotteries. Second,
in Colombia, prenatal examinations must be carried out by physicians (Gomez et al., 2013).
Finally, these professionals arguably make the greatest contribution to the health of the
patient (Das and Hammer, 2005) and in particular to birth outcomes.
3 Data
We use data from four main administrative records. The primary dataset comes from the
reports written after each state-level draw and published by the Ministry of Health for the
draws implemented in January, April, July, and October 2013 and January, April, and July
2014 (Ministry of health, 2014). From this data, we obtained individual identifications, the
draw date, the state that the physician applied to, whether the student “won” the lottery
or not, and notably the hospital to which each was randomly assigned and the proposed
start date. For our period of analysis, 45 % of the hospitals in the program show up in only
one draw, while 29% of the hospitals appear in two draws and 26% of the hospitals appear
between three to five times.
The second administrative dataset comes from the Colombian Institute for Educational
Evaluation (Spanish acronym, ICFES). The ICFES is the institution that administers the
mandatory college exit exam (called SABER PRO) that all professionals, including physi-
cians, must take before graduation(Colombian Institute for Educational Evaluation, 2014).
Using national ID numbers, we are able to link the physicians participating in the SSO
program to the ICFES records and recover their information from their field-specific post
medical training exams (SABER PRO). From the SABER PRO, we get physicians’ indi-
vidual performance in four different fields, including reading (comprehension), quantitative
(reasoning), public health, and health management, plus some detailed sociodemographic
information about each professional.
In our estimations, we use the scores in the four fields as proxies of the physician’s skills
before the SSO program. According to ICFES, the reading test measures how well a student
understands the meaning of words or phrases, matches the parts of a text to make it global,
and reflects on a text and evaluates its content. The quantitative test measures general
18
It is mandatory for newly graduated professionals from medicine, nursing, bacteriology, and dentistry.
10knowledge in mathematics, statistics, and data analysis. The specific medical competencies
are included in the public health and health management modules. The health management
module evaluates competencies related to understanding administrative processes, aspects
including planning, organization, management, and control of health services. In particular,
it evaluates the understanding of administrative processes for the development of health
activities, recognition of services provided to the patient in the legal framework, and appli-
cation of patient safety and ethical standards in the provision of health services. The public
health score measures basic concepts regarding prioritized treatment plans for individual
patient conditions. Essentially, the health module tests the physician’s knowledge of compo-
nents and processes of primary health care. In addition, this test is designed to recognize the
treatments related to health conditions and to apply them in the selection of intervention
actions for potentially basic medical conditions.
Our main exercises use the average score and the first principal component of the four
fields; nonetheless, the general results do not change when we use each score individually or
different ways to summarize the variation in the different fields. Since the SSO program is the
physicians’ first real work experience, and the SABER PRO is taken just before graduation,
we consider their scores a good measure of the physicians’ general and medical skills at the
time they start their SSO service and professional career. 19
In Colombia, as many other developing countries, there is high heterogeneity in the
quality of education in medicine. In 2009, only 30% of medicine programs in Colombia had
been accredited as high-quality programs by the Ministry of Education (Fernández Ávila
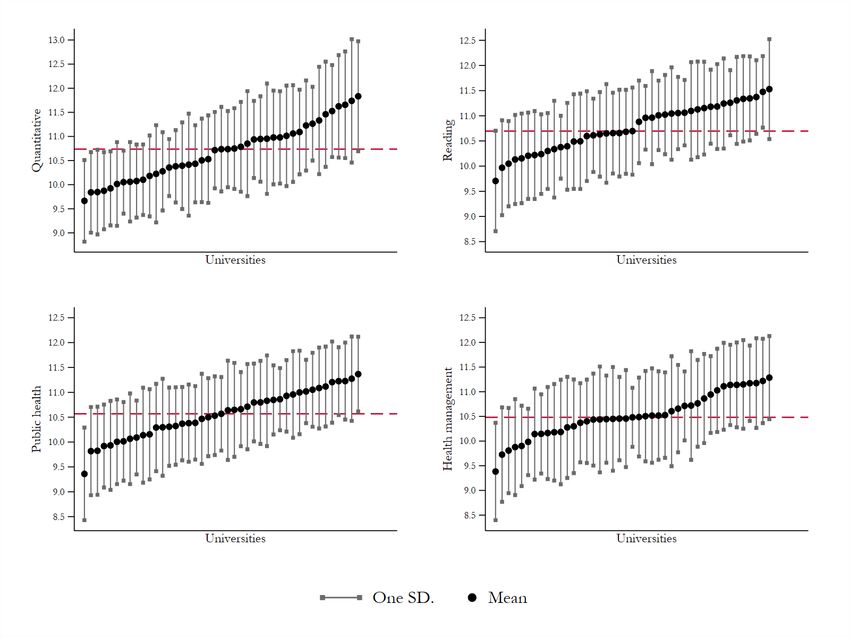
et al., 2011). Figure 1 shows high heterogeneity on the average score of the SABER PRO
test between and within programs (and universities) for the physicians in our sample.20 The
Figure shows the mean score for each university/program and an interval of one standard
deviation to each side of the average. Notice that there is a difference of almost two standard
deviations between the averages of the best and the worst programs. This high heterogeneity
plays in our favor since it allows us to compare the outcomes of patients who were randomly
exposed to physicians with very different knowledge bases and skills.
Using the scores and demographic characteristics from the SABER PRO, Guarin et al.
(2021) show that the SSO lotteries in our sample are well balanced between winners and
losers. Table A.1 and Figure A.1 replicate the balancing tests in Guarin et al. (2021). Table
A.1 shows individual regression between the lotteries and physicians’ characteristics. In
19
Schnell and Currie (2018) provide evidence on the important link between physicians education and
their professional performance.
20
In the particular case of Colombia, each university has at most one medicine program.
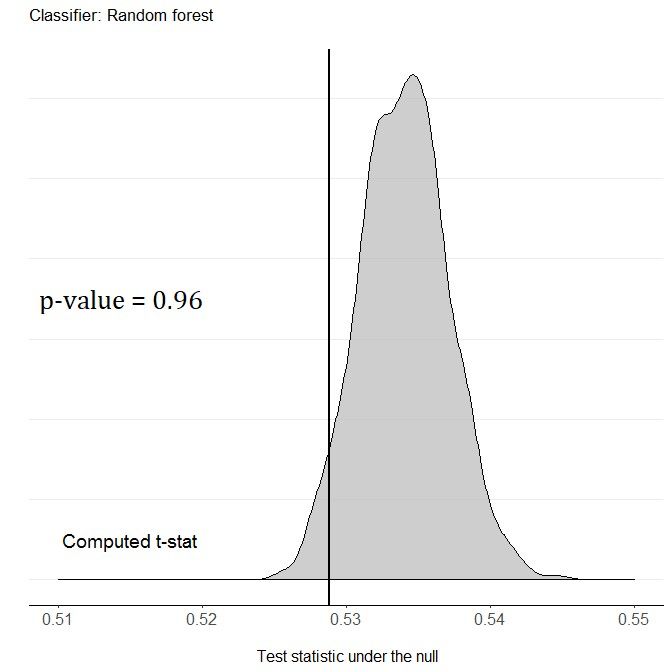
11addition, Figure A.1 uses machine learning techniques and a classification permutation test
to provide evidence of equality of multivariate distributions between treatment and control
groups (Gagnon-Bartsch et al., 2019).21
The third administrative dataset comes from the Vital Statistics Records (VSR) col-
lected by the Administrative Department of Statistics - DANE (Administrative Department
of Statistics, 2018). The VSR records have rich information for all birth certificates filed in
hospitals within Colombia’s 1,120 municipalities from 1998 to 2018. Using hospitals’ iden-
tification codes, we are able to link physicians and the birth records of the hospitals that
they were assigned to. Using the birth date and number of gestation weeks from VSR, we
are able to identify children born between 2013 and 2015 who were exposed to each team
of physicians. We also use the VSR data from 2010 to 2012 to create mother and hospital-
level controls to provide evidence of the covariate balance at the hospital level and to run
falsification tests (Administrative Department of Statistics, 2018).
Finally, the fourth administrative data set comes from the 2005 National Census, also
collected by DANE (Administrative Department of Statistics, 2005). From the census, we
get the population and other control variables at the municipality level. We also collected
additional data at the hospital level from the Colombian Ministry of Health.
3.1 Main sample
Our primary data source are the draws implemented in January, April, July, and October
2013 and January, April, and July 2014. Since the objective of the program is to provide
professional services in urban and rural areas with difficult access to health services, and
given that 77.3% of the available positions in these draws were located in small cities outside
of the main 23 Colombian metropolitan areas, in this exercise we exclude municipalities in
metropolitan areas, where we expect assigned physicians to play a less pivotal role.22 The
municipalities included in our sample cover around 58% of the Colombian population. We
further constrain our sample to hospitals with at least one physician assigned in the seven
draws and at least one birth certificate filed from 2013 through 2016. Finally, our main
estimates focus on first-time mothers, although we also show estimates for non-first-time
mothers.
For each newborn, we observe the complete birth certificate, which includes information
21
We also perform a simple reverse regression to show that the set of baseline covariates do not explain
the treatment variable. We found no evidence in this matter (test F(19,160) = 0.88, p-value=0.6128).
22
In the appendix, Table A.2, we show that our main results hold when we include all municipalities.
12Figure 1: Heterogeneity in Saber Pro scores in medicine programs
Figure 1 reports the reading, quantitative, health management, and
public health test scores for the universities that the physicians in our
sample attended. Data accounts for 44 different universities. The fig-
ure shows the mean score for each university/program and an interval
of one standard deviation to each side of the average. The dashed
horizontal line represents the overall percentile 50. The figure shows
substantial heterogeneity both within and between programs. For all
the fields reported, there is a difference of almost two standard devia-
tions between the averages of the best and the worst programs.
on low birth weight, Apgar score, weeks of gestation, and demographic information for
mother and newborn. For each physician, we observe the four scores in reading, quantitative,
public health, and health management, plus some socio-demographic information. Our final
sample contains 104,358 combinations of newborns and physicians.23
Table 1 provides the basic descriptive statistics for the main variables used from the
VSR. It also shows how our sample changes as we add the restrictions used in our main
estimations. The first column shows the mean for newborns in hospitals where at least one
SSO physician was assigned (SSO sample); column 2 shows the same statistics when we
constrain the sample to first-time mothers only; and column 3 shows the mean when we
further constrain the sample to the municipalities outside of the main metropolitan areas.
The last column corresponds to our final main sample. In our main sample, 4.9% of births
23
Several physicians were assigned to metropolitan areas and others to hospitals that did not filed a birth
certificate from 2013 through 2016.
13were low birth weight, 4.2% were early-term infants, and 4.6% of births had an Apgar score
below 7. Finally, teenage pregnancy is 54.7% of total births in the main sample, compared
with 28.4% of the total births in the SSO sample.
Table 1: Descriptive Vital Statistics Registers main sample 2013-2016
Covariate SSO sample SSO sample SSO sample
constrained to constrained to
first-time first-time
mother mother and
non-MA
Mean SD Mean SD Mean SD
Low birth weight 0.0601 0.2377 0.0675 0.2509 0.0494 0.2168
Very low birth weight 0.0061 0.0780 0.0062 0.0782 0.0035 0.0591
Prematurity 0.0623 0.2417 0.0625 0.2420 0.0415 0.1994
Apgar 1 minwhere Yh,t,i is the outcome of child i born in hospital h and exposed to a physician team t.
Zh,t is a score that measures the overall skills of the physician team t that was randomly
assigned to serve in hospital h and whose service period intersects with child i’s gestation
period.24 Xh is a vector of ex ante hospital and team characteristics. Wi is a vector with
sociodemographic information of mother-child i, and γt are draw-by-state fixed effects.25
Because physicians in each draw and state are assigned to hospitals, controlling for draw-
by-state fixed effects (γt ) is crucial to our identification strategy; otherwise, variation in
physician quality could reflect other regional differences in the assignment of physicians to
hospitals. Finally, standard errors are clustered by team and child.
The coefficient of interest is β. Under the assumption that teams of doctors within each
draw state were randomly assigned to hospitals, the β estimated by OLS cleanly identifies
the effect of a more skilled team of physicians on children potentially exposed to their ser-
vice in the assigned hospital h. To make the interpretation of the estimated coefficient β
straightforward, we divide Zh,t,i by its standard deviation and relate the effect to the average
of the outcome. Therefore, the final result is interpreted as the percentage change in the
outcome variable associated with one standard deviation increase in the skill measure. We
also estimate heterogeneous effects using the demographic characteristics of the newborns,
their mothers, and the hospitals in which they were born.
To evaluate the internal validity of our identification strategy, we implement the following
falsification tests. We assign “placebo treatment” to the newborns who show up in the VSR
of the three years before the program (2010, 2011, and 2012) instead of years 2013, 2014,
and 2015 used in our main estimation sample. We use the same draw date, proposed start
date, and hospital to which each of the physicians was randomly assigned but three years
before the actual date. We then run equation (1) under the same conditions used for the
main sample.
Like most literature in economics, we focus on low birth weight as our principal measure of
health at birth (Currie, 2011). We use prematurity and the Apgar score as related measures
of health at birth and to provide robustness for our main estimations.26 Prematurity is
24
We explore two different measures as proxies of the physicians’ skills: the average score and the first
principal component of the four tests available. The results are robust to this decision.
25
Since we use data for three years of the infants’ vital statistics, we also include year fixed effects to
control for changes over time. Sociodemographic characteristics of the newborns and their mothers include
infants’ gender and mothers’ age, education, access to subsidized health, and marital status.
26
Prematurity is highly correlated with low birth weight and mortality (Almond et al., 2005; Gonzalez
and Gilleskie, 2017). Children born prematurely are at greater risk of suffering a variety of health prob-
lems, some of which can ultimately cause death. Complications include immunological, respiratory, central
nervous system, gastrointestinal, hearing, and vision problems as well as cognitive, motor, social-emotional,
15defined as being born before the 37th gestational week. For Apgar, we use an indicator of
whether the newborn had a score below 7 in Apgar 1, as the threshold of 7 is commonly
used in the literature (Ehrenstein, 2009). Almond et al. (2005) argue that using the Apgar
score to evaluate birth outcomes has the same practical advantages as birth weight: (i) it
is relatively easy to collect; (ii) it is already available in birth records data; and (iii) it is a
measure that does not depend on a rare event (such as mortality). Similarly, Ma and Finch
(2010) recommend always including the Apgar score since it appears to be the strongest
predictor of neonatal mortality, regardless of birth weight.
We focus on the average score for most of our analysis. Nonetheless, we provide robustness
results using the first principal component and each score individually. In addition, when a
child is exposed to multiple physicians, a weighted average of the scores is computed where
the number of months exposed to each team of physicians during the pregnancy period is
used as a weight.27 Finally, for the entirely of the analysis, we focus on our main sample. In
the Appendix, as a robustness check, we present the results for other samples.
5 Results
This section describes the causal effects of physicians’ skills on birth outcomes. We first test
whether hospitals’ birth outcomes and additional covariates measured in years 2010, 2011 and
2012 from VSR (randomly assigned) arrival are correlated with their score. Our results show
that there is no correlation between different health outcomes and our proxy for physicians’
skills. Second, we find that physicians’ skills have a negative and significant effect on low birth
weight, prematurity, and Apgar. Third, we provide robustness checks to our main results
by using a standardized principal component as a proxy for physicians’ skills and excluding
the controls, and using different functional forms. Fourth, we implement a placebo test.
behavioral, and long-term growth problems (Butler et al., 2007; Currie and Walker, 2011; Taylor et al., 2001;
Veddovi et al., 2001). Callaghan et al. (2006) reexamined the top 20 causes of infant deaths in 2002 and
determined that both low birth weight and prematurity are the most common causes in the US and account
for almost a third of infant deaths. Apgar has also been used in the literature as a measure of newborn
health status; for example, Almond et al. (2010) and Lin (2009). Apgar is a measurement of the health
of newborns based on breathing, heart rate, color, reflexes, and muscle tone (Moore et al., 2014). Apgar
scoring at birth was developed to evaluate the newborn’s immediate condition and the potential need for
resuscitation. Posterior studies have shown that Apgar scoring is a good predictor of infant death and ven-
tilator use. Low Apgar scores can also predict long-term cognitive outcomes, such as neurological disability,
reduced IQ, lower math scores, and low cognitive function (Almond et al., 2005; Moore et al., 2014; Moster
et al., 2002). Among school-age children, low Apgar scores are also associated with minor language, motor,
speech, and developmental impairments (Razaz et al., 2016).
27
Our results hold when we use an unweighted average of the scores.
16Fifth, we estimate heterogeneous effects on mothers’ and hospitals’ characteristics. Finally,
we explore prenatal consultations as a mechanism to improve the quality of care and health
outcomes.
5.1 Characteristics of the hospitals and physicians’ skills
To test whether the main health at birth outcomes and additional covariates, measured before
the program, are correlated with the quality of the physicians assigned to each hospital, we
regress each hospital’s characteristics three years before the SSO program on physicians’
average college examination scores. We include date and state (where the draws took place)
fixed effects and cluster the standard errors by hospital. Table 2 shows the coefficients
and their standard errors from each regression. From Table 2, it follows that there is no
correlation between the health outcomes and the skill measure.
Table 2: Covariate balance at hospital level
Covariate Coefficient Standard
Error
Low birth weight 0.001 0.001
Prematurity 0.000 0.001
Apgar < 7 0.011 0.009
Antenatal consultations ≥ 4 0.000 0.003
Proportion of female newborns 0.000 0.001
Proportion of mothers with at least secundary education -0.002 0.003
Proportion of married mothers 0.001 0.002
Proportion of teenage mothers 0.000 0.002
LBW > p(75) 0.003 0.013
Prematurity > p(75) -0.004 0.011
Mean number of antenatal consultations -0.005 0.022
Hospitals by municipalities 0.000 0.010
Municipality population 325.7 1,032.3
Notes: This table reports the results of regressing each hospital’s characteristics. The data comes
from the 2013-2016 DANE VSR, which collects and provides information that reveals the changes
in mortality and fertility for each hospital. Low birth weight is the proportion of newborns with low
birth weight (weight5.2 Main results on health at birth
In this section, we provide our main results on health birth outcomes. Table 3 presents
the estimated coefficient β, in equation (1), using ordinary least squares. We find that our
main skill measure has a negative and significant effect on both low birth weight and the
alternative measures of health.28 The coefficient represents the effect of an increase of one
standard deviation of physicians’ average score. The standard error of the coefficient is
presented in parenthesis, and we present the relative (percent) effect in square brackets—we
divide the main coefficient by the average of the dependent variable.
In column 1 of Table 3, we see that there is a significant negative relationship between low
birth weight and the average score—a decrease in the probability of being born low weight of
0.36 percentage points. Our estimates suggest that an increase of one standard deviation in
physicians’ average score decreases the probability of low birth weight by 7.42%.29 Columns
(2) and (3) in Table 3 examine alternative measures of health at birth. The point estimate
for the standardized average score is associated with a decrease in the probability of being
premature of 0.41 percentage points (10.05 %) and a drop in the probability of being born
with an Apgar score below 7 of -0.63 percentage points (13.72 %). These results are consistent
with previous literature that finds that prematurity is an important determinant of weight
at birth (Almond et al., 2005).30
28
All regressions include draw state and year of birth of the newborn fixed effects. The set of control
variables includes: an indicator variable for the gender of the newborn, a variable that takes the value of
1 if the mother has at least secondary education and zero otherwise, an indicator variable that takes the
value of 1 if the mother is a teenager and zero otherwise, dummies for the mother’s marital status, number
of inhabitants in the municipality, number of hospitals per municipality, area of the municipality, a dummy
variable that indicates if there is at least one female physician in the cohort, a dummy variable that indicates
if there is at least one physician from a top university in the cohort, a dummy variable that indicates if there
is at least one physician from a public university in the cohort, an indicator variable that takes the value of 1
if the hospital is above the 75th percentile of the distribution of low birth weight measured in 2010-2012 and
zero otherwise, and an indicator variable that takes the value of 1 if the hospital is above the 75th percentile
of the distribution of prematurity measured in 2010-2012 and zero otherwise.
29
In the education context, the teacher value-added literature (e.g., Chetty et al., 2014; Rothstein, 2017)
finds that an increase in teacher quality of one standard deviation corresponds to an increase in students’ test
scores of 0.19 standard deviations in math and 0.14 standard deviations in reading. Our results suggest an
increase in physician quality of one standard deviation corresponds to a decrease in low birth weight by 7.4
percent. Note that in our context, a one standard deviation increase is almost equivalent to the change from
having a physician from the bottom-ranked program to having a physician from the top-ranked program
(see Figure 1).
30
We find a strong correlation between prematurity and low birth weight in Colombia. Figure A.2 in
the Appendix shows a monotonic negative correlation between the probability of low birth weight and the
number of gestational weeks for all births in Colombia between 2010 and 2012. The figure presents the local
polynomial regression fit of the probability of having a low birth weight over the number of gestational weeks
using all birth records in Colombia from 2009 to 2012.
18Our results are similar to Amarante et al. (2016) who explotes in utero exposure to a
social assistance program in Uruguay to estimate the effects on birth outcomes. They find
that participation in the program led to a “sizeable” (19% - 25%) reduction in the incidence
of low birth weight. Similarly, Currie and Schwandt (2016a) find that fetal exposure to 9/11
release of toxic dust negatively affects gestation length, prematurity, birth weight, and low
birth weight. Barber and Gertler (2010) evaluates the impact of Progresa/Oportunidades
on birth weight and finds a very large reduction in the incidence of low birth weight (44.5%
lower among beneficiary mothers).
Table 3: Main estimates using all sample and average score
Low birth weight Prematurity Apgar < 7
Average Score
(1) (2) (3)
With controls
Coefficient -0.0036 -0.0041 -0.0063
Standard Error (0.0018) (0.0015) (0.0021)
Relative Effect -7.42% -10.05% -13.72%
Average Dependent Variable 0.049 0.041 0.046
Number of Hospitals 592
Number of Observations 104,357
Notes: This table shows our main estimates. The coefficients represent the effect of an increase of one standard
deviation of the physician skill measure (average score). Relative (percent) effects are computed as the coefficient
divided by the average of the dependent variable. Low birth weight is a binary variable that takes the value of 1 if
the newborn has low birth weight and zero otherwise, prematurity is a binary variable that takes the value of 1 if
the newborn is premature (fewer than 37 weeks of gestation) and zero otherwise, and Apgar is a binary variable that
takes the value of 1 if the Apgar 1 score of the newborn is lower than 7 and zero otherwise. All regressions control
for draw state and year of birth of the newborn fixed effects and also include the following controls: an indicator
variable for the gender of the newborn, an indicator variable that takes the value of 1 if the mother has at least
secondary education and zero otherwise, an indicator variable that takes the value of 1 if the mother is adolescent
and zero otherwise, marital status, number of inhabitants in the municipality, number of hospitals per municipality,
area, a dummy variable that indicates if there is at least one female physician in the cohort, a dummy variable that
indicates if there is at least one physician from a top university in the cohort, a dummy variable that indicates if
there is at least one physician from a public university in the cohort, an indicator variable that takes the value of 1
if the hospital is above the 75th percentile of the distribution of low birth weight measured in 2010-2012 and zero
otherwise, and an indicator variable that takes the value of 1 if the hospital is above the 75th percentile of the dis-
tribution of prematurity measured in 2010-2012 and zero otherwise. Numbers in parentheses are clustered standard
errors. We interpret the high significance and consistency of these results across the different measures of health at
birth as evidence of the important role that skilled physicians play in determining infant’s health.
5.2.1 Robustness Checks
We run additional specifications in which we use the standardized principal component
instead of the standardized average score as a proxy for physicians’ skills, using the full set
19of controls, and exclude the controls from our main estimating equation.31 Figure 2 compares
the estimated coefficient (relative to the mean), β, in equation (1) using the average score
(main specification) with the three specifications mentioned above. We see from Figure 2
that our estimates for low birth weight are similar if we use the first principal component as
a proxy for skills and are robust to the set of controls included in our analysis.32
Also, while ordinary least squares allows us to compute the average effect of our skills
measure, it does not tell us much about the magnitude of this effect across the distribution
of skills. We rank the skills into quartiles and estimate equation (1) using a set of dummies
indicating the score distribution quartile to which physicians belonged. The results are pre-
sented in Appendix Table A.4. Columns (1), (3), and (5) present the coefficients associated
with the effect of belonging to the second, third, and fourth quartile, respectively, of the av-
erage score distribution for low birth weight, relative to the first quartile. Columns (2), (4),
and (6) present the coefficients associated with the effect of belonging to the second, third,
and fourth quartile, respectively, of the distribution of the first principal component score
on low birth weight relative to the first quartile. Although we lack power to find statistically
significant differences, we see that the point estimates are negative and monotonically de-
creasing with respect to the quartile, which suggests that there are potential gains associated
with getting a more-skilled physician across the whole distribution of skills.
Finally, we extend our analysis by estimating additional models for low birth weight using
alternative measures of skills. We aggregate health-related test scores (health management
and public health) into a single health score and reading and quantitative test scores into a
single academic score. We regress low birth weight on our health and academic scores, as
well as on each individual exam score. Table 4 shows that the scores have a negative effect
on low birth weight and are not statistically different from each other. The point estimates
seem to be larger and more precisely estimated for the average health scores, especially for
health management.33
31
Note that the average prevalence of the outcomes considered is usually low and around 5%. One concern
might be that a linear regression may not fit the data well. To alleviate this concern, we estimate equation
(1) using an analogous Logit model and compute the average marginal effect associated with an increase in
one standard deviation of the skill measure. Appendix Table A.3 shows that the marginal effects (signs and
magnitudes) are very similar to the ones estimated using a linear regression model.
32
Results are reported in Appendix Table A.3, where we use low birth weight, prematurity, and Apgar
score as our dependent variables, using the standardized average college examination score and standardized
principal component as a proxy for physicians’ skills.
33
The health module measures the physician’s ability to assess primary health care. In particular, the
health management score evaluates the physician’s knowledge of the administrative processes necessary for
the development of health activities and how well the physician would implement the patient safety and
ethical standards necessary to provide health services. We use the SABER PRO scores in four areas (health
20Table 4: Additional estimates using alternative measures of skills
Health Health Public Academic Reading Quantitative
Score Management Health Score Score Score
Score Score
(1) (2) (3) (4) (5) (6)
With controls
Coefficient -0.0044 -0.0039 -0.0029 -0.0037 -0.0037 -0.0020
Standard Error (0.0023) (0.0018) (0.0023) (0.0021) (0.0019) (0.0017)
Relative Effect -9.02% -7.88% -5.84% -7.60% -7.65% -3.99%
Average Dependent Variable 0.049
Number of Hospitals 592
Number of Observations 104,357
Notes: The coefficients in this table represent the effect of an increase of one standard deviation of the specific measure of physician skill.
The Health score measure is the average of the Health Management and Public Health scores, and the Academic score is the average of the
Reading and Quantitative scores. Relative (percent) effects are computed as the coefficient divided by the average of the dependent vari-
able. Low birth weight is a binary variable that takes the value of 1 if the newborn has low birth weight and zero otherwise, prematurity is
a binary variable that takes the value of 1 if the newborn is premature (fewer than 37 weeks of gestation) and zero otherwise, and Apgar
is a binary variable that takes the value of 1 if the Apgar 1 score of the newborn is lower than 7 and zero otherwise. All regressions control
for draw-state and year of birth of the newborn fixed effects and also include the following controls: an indicator variable for the gender of
the newborn, an indicator variable that takes the value of 1 if the mother has at least secondary education and zero otherwise, an indicator
variable that takes the value of 1 if the mother is adolescent and zero otherwise, marital status, number of inhabitants in the municipality,
number of hospitals per municipality, area, a dummy variable that indicates if there is at least one female physician in the cohort, a dummy
variable that indicates if there is at least one physician from a top university in the cohort, a dummy variable that indicates if there is at
least one physician from a public university in the cohort, an indicator variable that takes the value of 1 if the hospital is above the 75th
percentile of the distribution of low birth weight measured in 2010-2012 and zero otherwise, and an indicator variable that takes the value
of 1 if the hospital is above the 75th percentile of the distribution of prematurity measured in 2010-2012 and zero otherwise. Numbers in
parentheses are clustered standard errors. The table shows that while the coefficients are not statistically different from each other, the
point estimates are consistently negative for all the scores and seem to be larger and more precisely estimated for the average Health scores.
21You can also read