The Physical Activity Economy in Asia: Market Size, Participation, Barriers, and Options to Increase Movement - Asian Development ...
←
→
Page content transcription
If your browser does not render page correctly, please read the page content below

BACKGROUND PAPER

The Physical Activity Economy
in Asia: Market Size,
Participation, Barriers, and
Options to Increase Movement

Ophelia Yeung and Katherine Johnston

 DISCLAIMER
 This background paper was prepared for the report Asian Development Outlook 2020 Update: Wellness in
 Worrying Times. It is made available here to communicate the results of the underlying research work with the
 least possible delay. The manuscript of this paper therefore has not been prepared in accordance with the
 procedures appropriate to formally-edited texts.

 The findings, interpretations, and conclusions expressed in this paper do not necessarily reflect the views of
 the Asian Development Bank (ADB), its Board of Governors, or the governments they represent. The ADB
 does not guarantee the accuracy of the data included in this document and accepts no responsibility for any
 consequence of their use. The mention of specific companies or products of manufacturers does not imply
 that they are endorsed or recommended by ADB in preference to others of a similar nature that are not
 mentioned.

 Any designation of or reference to a particular territory or geographic area, or use of the term “country” in this
 document, is not intended to make any judgments as to the legal or other status of any territory or area.
 Boundaries, colors, denominations, and other information shown on any map in this document do not imply
 any judgment on the part of the ADB concerning the legal status of any territory or the endorsement or
 acceptance of such boundaries.
THE PHYSICAL ACTIVITY ECONOMY IN ASIA:
MARKET SIZE, PARTICIPATION, BARRIERS, AND
     OPTIONS TO INCREASE MOVEMENT

    White Paper for the Asian Development Bank
       Ophelia Yeung and Katherine Johnston
Authors Ophelia Yeung and Katherine Johnston, Senior Research Fellows at the Global Wellness Institute, prepared this white paper. Together, they have four decades of experience in leading research and strategy development for businesses, universities, research institutions, and multilateral and government organizations. Since 2008, Ms. Yeung and Ms. Johnston have pioneered research on the global wellness economy for the Global Wellness Summit and the Global Wellness Institute, including crafting conceptual frameworks and definitions, as well as estimating the size of various wellness sectors.
Contents

I.         The Rise of Physical Inactivity in Asia ................................................................... 1

II.        The Physical Activity Economy in Asia .................................................................. 6

III.       Overcoming Barriers to Physical Activity ........................................................... 24

IV.        Key Takeaways.................................................................................................... 32

Appendix:

Physical Activity Economy Sector Definitions ................................................................ 34

GWI Regional Grouping of Countries………………………………………………………………………….38

References ...................................................................................................................... 40
I.         The Rise of Physical Inactivity in Asia
Physical inactivity: A rising global crisis
Physical activity is intrinsic to wellness. As advocated by physicians and public health authorities
around the world, a regular and adequate level of physical activity is vital to our health in all aspects:
muscular and cardiorespiratory fitness; bone and functional health; energy, balance, and weight
control; and lowering the risks of depression and many chronic diseases (hypertension, coronary heart
disease, stroke, diabetes, and various types of cancer). Yet, in recent decades, there has been an
alarming trend of declining physical activity in countries around the world. 1 Recent data indicate that
as many as 27.5% 2–31% 3 of adults may be physically inactive. Across countries, including in Asia, low
or declining physical activity levels tend to be associated with high or rising national income levels.
Research also shows that women and girls tend to be more inactive than men and boys. 4

These trends are occurring at a time when we need physical activity more than ever to mitigate the
rise of chronic disease and the impacts of population aging. The Lancet has described the rise of
physical inactivity as “pandemic, with far-reaching health, economic, environmental, and social
consequences.” 5 Obesity, which is linked with physical inactivity, has nearly tripled worldwide since
1975; 39% of adults are now overweight. 6 Physical inactivity and obesity are key lifestyle risk factors
that directly contribute to the rise of chronic or noncommunicable diseases (including heart disease,
stroke, cancer, diabetes, and chronic lung disease), which are collectively responsible for 71% of deaths
worldwide every year. 7 Physical inactivity is the fourth leading cause of death in the world, responsible
for more than 5 million preventable deaths annually. 8 The global economic burden of physical inactivity
was estimated at INT$67.5 billion in 2013 ($53.8 billion in direct health care costs and $13.7 billion in
productivity losses). 9

This white paper examines the economy of physical activity in Asia (including its three main segments:
sports and active recreation, fitness, and mindful movement); the rates of participation in recreational

1   S.W. Ng and B.M. Popkin. 2012. Time use and physical activity: a shift away from movement across the globe. Obesity
    Reviews, 13(8), 659–680. https://doi.org/10.1111/j.1467-789X.2011.00982.x.
2   R. Guthold et al. 2018. Worldwide trends in insufficient physical activity from 2001 to 2016: a pooled analysis of 358
    population-based surveys with 1.9 million participants. The Lancet Global Health, 6(10), e1077-1086.
    https://doi.org/10.1016/S2214-109X(18)30357-7.
3   P.C. Hallal et al. 2012. Global physical activity levels: surveillance progress, pitfalls, and prospects. The Lancet, 380(9838),
    247–257. https://doi.org/10.1016/S0140-6736(12)60646-1.
4   R. Guthold et al (2018); P.C. Hallal et al (2012); and World Health Organization (WHO). 2014. Global Status Report on
    Noncommunicable Diseases. https://www.who.int/nmh/publications/ncd-status-report-2014/en/.
5   H.W. Kohl et al. 2012. The pandemic of physical inactivity: global action for public health. The Lancet, 380(9838), 294–
    305. https://doi.org/10.1016/S0140-6736(12)60898-8.
6   WHO. 2018. Obesity and Overweight Fact Sheet. http://www.who.int/mediacentre/factsheets/fs311/en/.
7   WHO. 2018. Fact Sheet: Noncommunicable diseases. http://www.who.int/en/news-room/fact-
    sheets/detail/noncommunicable-diseases.
8   H.W. Kohl et al (2012).
9   INT=International Dollars, which means that the values in each country are converted to dollars at a purchasing power
    parity rate that accounts for differentials in the prices of goods and services across countries
    (https://datahelpdesk.worldbank.org/knowledgebase/articles/114944-what-is-an-international-dollar). D. Ding et al.
    2016. The economic burden of physical inactivity: a global analysis of major non-communicable diseases. The Lancet,
    388(10051), 1311-1324. https://doi.org/10.1016/S0140-6736(16)30383-X.

                                         The Physical Activity Economy in Asia: ADB White Paper – December 2019 | 1
physical activities across Asian countries; and industry size and trends, using recent data on the global
physical activity sector developed by the authors for the Global Wellness Institute (GWI). It also
examines the main barriers to physical activity participation, and it highlights options that can
encourage and support all populations to be more physically active, including the elderly, youth, and
marginalized groups.
What is physical activity?
The World Health Organization (WHO) defines physical activity as “any bodily movement produced by
skeletal muscles that requires energy expenditure – including activities undertaken while working,
playing, carrying out household chores, travelling, and engaging in recreational pursuit.” According to
the WHO, in order to maintain good health, children and adolescents need 60 minutes of moderate-
to vigorous-intensity physical activity daily, and adults need 150 minutes of moderate-intensity
physical activity, or 75 minutes of vigorous-intensity physical activity, on a weekly basis. 10 The benefits
of physical activity are varied, widely proven, and well-known, including preventing chronic disease,
reducing stress, managing weight, strengthening functional mobility, improving sleep, alleviating
depression, and improving cognitive function. To receive these benefits, our engagement in physical
activity needs to be regular, consistent, and sustained—not intermittent, only during holidays, or only
when we want to lose weight or can find the time.
Physical activities can be broadly divided into natural movement and recreational physical activity.
• Natural movement encompasses the physical activities that are essential to our daily lives,
including transportation (e.g., walking and cycling as transportation); occupational (e.g., work
that requires manual labor); or domestic movement (e.g., household chores and gardening).
These kinds of activities have been the core of physical activity for humankind for millennia.
Unfortunately, as discussed below, natural movement is now on the decline around the world,
progressively discouraged by our modern lifestyles and built environments.
• We also engage in optional and intentional movement as part of our hobbies and leisure time.
Recreational physical activity can include going to the gym, playing sports, taking a walk or
cycling for fun, dancing, and children playing on a playground. As natural movement declines,
recreational physical activity is becoming essential for a growing number of people in order to
stay healthy.
10 World Health Organization (WHO). 2018. Physical Activity: Key Facts. WHO Fact Sheet. https://www.who.int/news-
room/fact-sheets/detail/physical-activity.
The Physical Activity Economy in Asia: ADB White Paper – December 2019 | 2The current state of physical inactivity in Asia
The most recent country-level data on physical activity (compiled by The Lancet) show that about
27.5% of the world’s adult population has insufficient levels of physical activity (i.e., not meeting the
WHO standards described above). 11 As shown in Table 1, physical inactivity varies widely across Asia.
• In general, inactivity is higher than the global average in high-income Asian countries and
South Asia, but lower than the global average in East Asia, Southeast Asia and Oceania. The
disparities in inactivity rates between men and women are generally less stark in East Asia and
Southeast Asia than in other regions across Asia.
• Countries with the largest inactive populations include the Philippines, Malaysia, Singapore,
Japan, the Republic of Korea (ROK), India, and Pakistan, as well as a number of Pacific nations
(American Samoa, Marshall Islands, Nauru, Palau, Kiribati, and Micronesia).
• Countries with the lowest levels of inactivity in Asia include Cambodia, Myanmar, Nepal, the
People’s Republic of China (PRC), and many Pacific nations (Niue, Vanuatu, Tokelau, Samoa,
and Papua New Guinea).
• Countries with the least amount of disparity in inactivity rates between men and women
include the PRC, Indonesia, Niue, Cambodia, Vanuatu, Nepal, Japan, and Singapore.
Conversely, in many countries across the region, women are far more inactive than men,
including Palau, Bangladesh, Tuvalu, India, the Philippines, Pakistan, the Cook Islands, Tonga,
Sri Lanka, and Timor-Leste.
Table 1: Prevalence of Insufficient Physical Activity in Asia and the Pacific, 2016
Overall % of Population
With Insufficient Physical % of Men % of Women
Activity
High-Income Asia and the Pacific 35.7 33.0 38.3
Japan 35.5 33.8 37.0
Singapore 36.5 34.3 38.6
Republic of Korea 35.4 29.5 41.0
East and Southeast Asia 17.3 17.6 16.9
Brunei Darussalam 27.3 21.2 33.9
Cambodia 10.5 9.8 11.1
People’s Republic of China 14.1 16.0 12.2
Indonesia 22.6 23.5 21.7
Lao People’s Democratic Republic 16.3 11.7 20.6
Malaysia 38.8 34.6 42.8
Maldives 30.3 25.8 34.8
Myanmar 10.7 8.1 13.1
Philippines 39.7 30.1 49.1
Sri Lanka 28.9 20.2 36.7
Thailand 24.6 21.8 27.2
Timor-Leste 17.8 10.3 25.5
11 R. Guthold et al (2018).
The Physical Activity Economy in Asia: ADB White Paper – December 2019 | 3Overall % of Population
With Insufficient Physical % of Men % of Women
Activity
Viet Nam 25.4 19.9 30.6
South Asia 33.0 23.5 43.0
Bangladesh 27.8 16.1 39.5
Bhutan 23.0 17.7 29.5
India 34.0 24.7 43.9
Nepal 13.4 12.0 14.6
Pakistan 33.7 24.4 43.3
Oceania 16.3 12.3 20.3
American Samoa 53.4 49.3 57.5
Cook Islands 18.5 9.8 27.2
Fiji 17.4 10.8 24.1
French Polynesia 17.9 13.5 22.5
Kiribati 40.4 34.5 45.8
Marshall Islands 43.5 37.0 50.0
Micronesia 36.6 32.9 40.5
Nauru 42.1 34.9 49.4
Niue 6.9 7.8 6.0
Palau 40.9 28.3 53.5
Papua New Guinea 14.8 11.4 18.2
Samoa 12.6 8.2 17.2
Solomon Islands 18.2 13.3 23.2
Tokelau 11.1 4.5 17.7
Tonga 17.4 8.5 25.9
Tuvalu 27.3 17.5 37.2
Vanuatu 8.0 7.20 8.8
Source: R. Guthold et al. 2018. Worldwide trends in insufficient physical activity from 2001 to 2016: a pooled analysis of
358 population-based surveys with 1.9 million participants – Supplementary Appendix. The Lancet Global Health, 6(10).
https://doi.org/10.1016/S2214-109X(18)30357-7. This study pooled data from 358 population-based surveys across 168
countries, including 1.9 million participants.
Why is physical inactivity rising?
There is no question that our modern lifestyles and livelihoods require much less physical exertion
than those of previous generations of farmers, fisherman, herders, tradesmen, and industrial workers.
In all aspects, daily lives have become more sedentary. Across Asia, urbanization, technological
developments, and growing service economies have drawn more people into sedentary jobs. For the
growing middle class and for people who live in middle-income and high-income countries, household
chores such as cooking and cleaning have been greatly eased by modern appliances and industrialized
food production. Meanwhile, the digital revolution has enabled us to shop, socialize, and consume
news and entertainment without leaving our homes or even our sofas.
The trend is equally alarming for the youth. Studies have found a long-term decline in cardiovascular
fitness levels among children and adolescents, especially in upper-income and middle-income
The Physical Activity Economy in Asia: ADB White Paper – December 2019 | 4countries. 12 In many countries, fewer children are walking or biking to school. 13 Across cities and
suburbs, the spontaneous and unsupervised outdoor play of past generations has been replaced with
scheduled playdates, structured lessons, and sports leagues—activities to which children are often
transported by vehicles. Similar to adults, teens now have less motivation to be active when they are
glued to their mobile devices for social media, gaming, and entertainment.
As essential physical tasks steadily disappear in our daily lives, they have not been replaced by other
types of built-in movement. Our modern built environment—both urban and suburban—is often
described as obesogenic, with many factors interacting and conspiring against a physically active
lifestyle.
• The design of modern neighborhoods and buildings often prioritizes the speed and
convenience of vehicular traffic, with the unintended result of making walking or cycling an
unpleasant, inconvenient, or even dangerous way to travel.
• Density, overcrowding, and sprawling are becoming the way of life for people who live in the
largest and rapidly growing metropolises. Lack of sidewalks or crosswalks, wide lanes, heavy
traffic, and auto-centric planning have made walking or biking less viable as a transportation
option across many cities.
• Many people do not have adequate access to parks, green space, or sports and recreational
facilities near their homes. Some people live in areas where crime and safety concerns
discourage them from being outdoors. Some stay indoors because of poor air quality and
pollution.
• Similarly, most modern buildings have been designed for efficiency and comfort, rather than
to encourage movement; for example, placing elevators prominently in lobbies, while hiding
narrow and dark stairways.
All those missed opportunities to move in our daily lives, such as short distances not walked and flights
of stairs eschewed, have now become the “steps” that we need to make up each day to meet our daily
requirements for physical activity. Not surprisingly, in just a generation or two, physical activity has
become less natural and more structured and intentional. To stay active, many people now have to
schedule time to exercise. Increasingly, people also have to spend money for the opportunity to
exercise. This is giving rise to the physical activity economy.
12 G.R. Tomkinson, J.J. Lang, and M.S. Tremblay. 2019. Temporal trends in the cardiorespiratory fitness of children and
adolescents representing 19 high-income and upper middle-income countries between 1981 and 2014. British Journal of
Sports Medicine, 53(8), 478–486. https://doi.org/10.1136/bjsports-2017-097982; G.R. Tomkinson et al. 2012. Temporal
changes in long-distance running performance of Asian children between 1964 and 2009. Sports Medicine, 42(4), 267–
279. https://doi.org/10.2165/11599160-000000000-00000; and D.J. Macfarlane and G.R. Tomkinson. 2007. Evolution and
variability in fitness test performance of Asian children and adolescents. Medicine & Sport Science, 50, 143–167.
https://doi.org/10.1159/000101358.
13 R. Uddin et al. 2019. Active commuting to and from school among 106,605 adolescents in 27 Asia-Pacific countries.
Journal of Transport & Health, 15. https://doi.org/10.1016/j.jth.2019.100637; and W. Lu et al. 2014. Perceived barriers to
children's active commuting to school: a systematic review of empirical, methodological and theoretical evidence.
International Journal of Behavioral Nutrition & Physical Activity, 11(140). https://doi.org/10.1186/s12966-014-0140-x.
The Physical Activity Economy in Asia: ADB White Paper – December 2019 | 5II. The Physical Activity Economy in Asia
What is the physical activity economy?
Physical activity generates significant economic activities, both around the world and in Asia. As
leisure-time fitness, exercise, and active recreation become more popular, these pursuits represent an
important private household spending line item. Government spending also plays a substantial role in
supporting physical activity.
Figure 1: Private and Public Expenditures on Physical Activity
• Private expenditures are primarily on intentional recreational physical activities, which
individuals and families increasingly choose to do during their leisure time. These expenditures
include the fees to join a gym or Young Men’s Christian Association (YMCA), attend a fitness
class or yoga class, join a recreational sports team or club, swim laps at a pool, and run a
marathon. Individuals also spend money on clothing, shoes, equipment, sporting goods, and
technology devices/services that support their participation in recreational physical activities
(and which might also support walking/biking as transit, or natural movement physical
activity).
• Public expenditures support both natural movement and recreational physical activities,
primarily in the form of infrastructure investments and youth/education spending, and often
at the municipal/city level of government. In most countries, governments support
recreational physical activities and sports in a variety of ways, including building and
maintaining public sports fields, swimming pools, tennis courts, and running paths and trails,
The Physical Activity Economy in Asia: ADB White Paper – December 2019 | 6as well as providing funding for youth and community sports leagues and training programs. A
smaller number of governments build and/or subsidize community fitness centers and gyms.
Governments fund physical education classes in schools, which provide children with early
exposure to a variety of sports and physical activities and help instill lifelong healthy habits.
Public expenditures are also critical for facilitating natural movement physical activity,
especially via urban planning and public transit investments that create the infrastructure for
people to walk and ride bicycles as part of their commute or daily activities.
In 2019, the authors estimated the size of the global physical activity market, focusing on the private
spending on recreational physical activity.14 In our study, we defined the global physical activity market
as consumer spending associated with intentional physical activities performed during leisure and
recreation. The core of the market is the services that allow consumers to participate in three
categories of recreational physical activities: fitness, sports and active recreation, and mindful
movement. The market also includes three supporting sectors that enable and facilitate consumer
participation in these activities: technology, equipment and supplies, and apparel and footwear. The
Appendix includes the definitions of each of these subsectors.
While public expenditures are an important component of the physical activity economy (as elaborated
above), they are not estimated as part of the data presented in this white paper. There is not sufficient
data to make a credible estimate of government expenditures in this sector because this spending
occurs at multiple levels of government (local, regional, and national) and across multiple agencies and
budgetary items (such as transportation and infrastructure, parks and recreation, and sports). The
focus of the authors’ data-gathering is on private spending, which is the best gauge for the rising
consumer interest in intentional recreational physical activities and related services. Public spending,
public initiatives, and public policies that support physical activities are addressed qualitatively in
section III.
14 Global Wellness Institute. 2019. Move to be Well: The Global Economy of Physical Activity.
https://globalwellnessinstitute.org/industry-research/global-economy-physical-activity/.
The Physical Activity Economy in Asia: ADB White Paper – December 2019 | 7Box: Different Ways of Measuring Physical Activity
The physical activity participation and market size data developed by the authors and presented in
this section are not the same as the “physical inactivity” statistics presented in section I.
Section I presents global and country-level physical inactivity statistics compiled by The Lancet.
These figures measure physical activity/inactivity, defined as the share of the population that is/is
not meeting the World Health Organization (WHO) recommendations to maintain good health (e.g.,
adults need 150 minutes of moderate-intensity physical activity, or 75 minutes of vigorous-intensity
physical activity, on a weekly basis). In this definition, WHO guidelines may be met by any type of
physical activity, whether from recreational activities or natural movement (occupational,
transport, or domestic). The Lancet dataset draws upon studies and surveys developed by
researchers and public health experts across countries, such as the WHO STEPwise approach to
surveillance (STEPS).a
Section II presents the data developed by the authors that measure the share of the population
participating in recreational physical activities. Here, participation is defined as doing any kind of
recreational physical activity at least once a month or with some regularity. These data do not
measure the intensity of recreational physical activities or whether they are sufficient to meet WHO
physical activity guidelines. In fact, the minimum threshold used to define “participation” in the
authors’ dataset (at least once a month) is certainly not sufficient to meet WHO guidelines or stay
healthy. In addition, the focus is solely on participation in recreational physical activities and not on
other types of physical activity via natural movement (occupational, transport, and domestic).
With this dataset, the authors aim to capture the share of each country’s population that is part of
the discretionary consumer marketplace for various types of recreational physical activities. Based
on participation rates, the authors then estimate the direct, out-of-pocket expenditures made by
consumers each year in order to participate in various types of recreational physical activities. In
some instances, fees for participation may be subsidized (e.g., in fitness facilities run by
governments), and in these instances the authors still count consumer participation in the activity
although out-of-pocket expenditures would be reduced or possibly zero. Likewise, for some
activities there is no service provider or participation fee (e.g., running in the park or playing a
pickup basketball game with friends), and in these instances the authors count consumer
participation in the activity although the expenditures are zero.
a WHO. No date. STEPwise approach to Surveillance (STEPS). http://www.who.int/ncds/surveillance/steps/en/; and L.
Riley et al. 2016. The World Health Organization STEPwise Approach to Noncommunicable Disease Risk-Factor
Surveillance: Methods, Challenges, and Opportunities. American Journal of Public Health, 106(1), 74–78.
https://doi.org/10.2105/AJPH.2015.302962.
Source: The Authors.
The Physical Activity Economy in Asia: ADB White Paper – December 2019 | 8Asia’s physical activity economy in 2018
Asia has one of the largest and most diverse physical activity markets in the
world, valued at $240.4 billion in 2018.
Valued at $240.4 billion in 2018, the physical activity market in Asia and the Pacific is large, diverse,
and dynamic. It accounts for 29% of the total global economy for physical activity ($828.2 billion). Asia
and the Pacific is the second largest regional market in the world for physical activity, after North
America. Within the Asian physical activity market, $116.6 billion (48%) represents direct consumer
expenditures on participating in a variety of recreational physical activities; primarily, sports and active
recreation, as well as fitness and mindful movement. The remaining 52%, or $125.5 billion, represents
expenditures on a variety of enabling and supporting sectors; primarily, clothing and footwear, along
with fitness equipment, sporting goods, and related supplies, and fitness- and exercise-related
technologies.
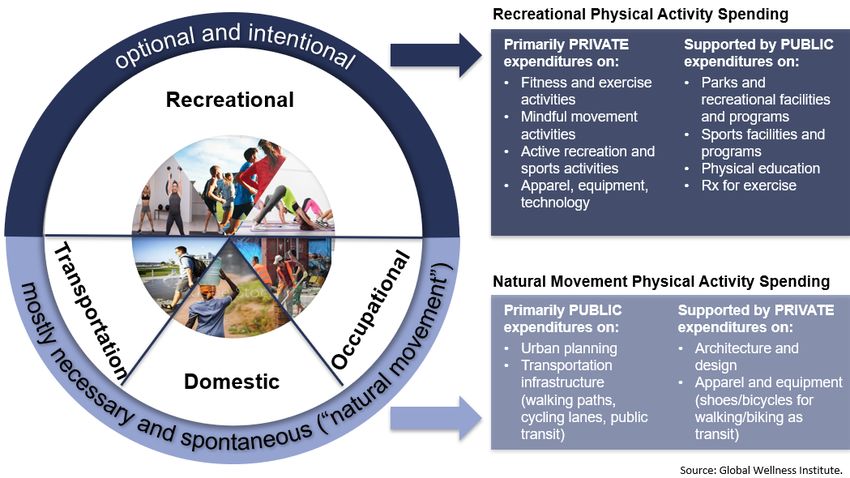
Figure 2: Physical Activity Economy by Region, 2018
Physical activity spending averages about $176 per participant per year in Asia and the Pacific, divided
into $85 spent on participating in recreational physical activities and $92 spent on associated apparel,
footwear, equipment, sporting goods, and technology devices and services. Per participant
expenditures in Asia are quite a bit lower than the global average ($176 in Asia versus $306 globally).
In Asia’s most developed countries, and in its largest metropolitan areas, middle-class and upper-class
consumers have access to a well-developed industry of fitness and sporting facilities (e.g., gyms and
The Physical Activity Economy in Asia: ADB White Paper – December 2019 | 9health clubs, yoga studios, sporting clubs, swimming pools, and dance studios). In these places,
participant spending levels are higher, not only because average incomes are higher, but also because
there is a wider variety of fitness and recreational physical activities that people can pay for. However,
for the majority of people living in Asia, the market and infrastructure for fitness and sports are simply
not well-developed. In these places, people who engage in recreational physical activities do so with
little to no spending; for example, playing soccer in a local league or with friends, going for a run
outside, or doing tai chi in a park. For this reason, average spending per participant can vary widely
across Asia, such as $622 in the ROK, $495 in Japan, and $460 in Singapore, compared with $66 in India,
$55 in the Philippines, and $29 in Indonesia and Viet Nam.
Table 2: Physical Activity Economy in Asia and the Pacific, 2018
Market Sizea Average Spending
Participation Rate / (US$ billions)
a per Participant
Recreational Physical Activities 33.2% $116.6 $85
Sports and active recreation 30.4% $83.0 $66
Fitness 1.1% $22.7 $494
Mindful movement 4.5% $10.9 $58
Enabling Sectors $125.5 $92
Apparel and footwear $87.5 $8
Equipment and supplies $27.6 $20
Technology $10.8 $64
Total Physical Activity Economy
$240.4 $176
in Asia and the Pacific
a Market size measures consumer expenditures on classes, memberships, entry fees, trainers, and related services and
methods of participation. Participation rate measures the share of the total population who participate in one or more
of the three physical activity categories on a regular basis (at least monthly).
Note: Numbers may not sum precisely because of overlap between segments and rounding.
Source: Global Wellness Institute.
Not surprisingly, the region is led by the PRC and Japan, which also rank second and third globally (after
the United States) for the overall size of their physical activity markets. The top three markets in Asia
(the PRC, Japan, and the ROK) account for nearly three-quarters of all physical activity spending in the
region. It is interesting that, among many (but not all) of Asia’s largest markets, spending on enabling
sectors is larger than spending on recreational physical activity participation, especially in India,
Thailand, Pakistan, Bangladesh, Sri Lanka, Myanmar, and Cambodia. However, in some markets, the
opposite is the case (e.g., the ROK, Australia, New Zealand, and Singapore). These differentials are
largely driven by how much people spend on apparel and shoes across these countries.
The Physical Activity Economy in Asia: ADB White Paper – December 2019 | 10Table 3: Top Twenty Physical Activity Markets in Asia and the Pacific by Market
Size, 2018
Recreational Physical
Activities Enabling Total Physical Rank
Market Sectors Activity Market in
Participation
Sizea (US$ billion) (US$ billion) 2018
Rate a
(US$ billion)
People’s Republic of China 48.6% $53.56 $56.89 $109.35 1
Japan 69.6% $20.79 $23.16 $43.89 2
Republic of Korea 73.7% $14.25 $9.32 $23.46 3
Australia 84.1% $11.45 $5.37 $16.73 4
India 15.0% $3.51 $10.02 $13.39 5
Taipei,China 84.0% $3.69 $4.08 $7.73 6
Hong Kong, China 58.2% $1.40 $2.72 $4.11 7
New Zealand 83.8% $1.72 $1.32 $3.03 8
Thailand 27.8% $0.74 $2.16 $2.89 9
Indonesia 34.2% $1.30 $1.34 $2.61 10
Malaysia 41.1% $0.75 $1.29 $2.04 11
Pakistan 13.2% $0.28 $1.68 $1.95 12
Philippines 32.7% $0.68 $1.23 $1.90 13
Bangladesh 25.2% $0.22 $1.58 $1.79 14
Singapore 64.9% $1.08 $0.67 $1.73 15
Viet Nam 35.7% $0.47 $0.54 $1.00 16
Sri Lanka 19.2% $0.16 $0.44 $0.60 17
Macau, China 51.1% $0.16 $0.32 $0.47 18
Myanmar 21.3% $0.07 $0.40 $0.47 19
Cambodia 21.4% $0.06 $0.15 $0.21 20
a Participation rate measures the share of the total population who participate in one or more of the three physical
activity categories on a regular basis (at least monthly). Market size measures consumer expenditures on classes,
memberships, entry fees, trainers, and related services and methods of participation.
Note: Numbers may not sum precisely because of overlap between segments and rounding.
Source: Global Wellness Institute estimates, based on data from Euromonitor International, Statista, and many other
sources.
Buoyed by economic growth, the rising purchasing power of the middle class, and a growing interest
in healthy and active lifestyles, Asia’s physical activity economy is growing fast and is increasingly
competitive. The authors project that Asia will be the fastest-growing region for physical activity
spending in the next 5 years—posting an average annual growth rate of 9.2% (compared with 6.6%
growth projected globally)—and will overtake North America as the largest region by expenditures in
2023. Over 40% of the global increase in the physical activity market will be in the Asia and the Pacific
region; the PRC and India together are projected to account for nearly one-third of the market growth.
Consumers in Asia’s higher-income countries and major metropolises keenly follow the latest fitness
and recreational trends and offerings, while the region’s vibrant private sector innovates, imports,
improvises, and adapts to meet rising demand. Across the region, rising concern about obesity and
The Physical Activity Economy in Asia: ADB White Paper – December 2019 | 11chronic disease and the awareness of their link to inactivity will continue to push governments,
nonprofits, medical systems, employers, and consumers to pay more attention to physical activity.
Higher spending on physical activity does not necessarily correspond to a
higher level of participation, which is currently at 33% across Asia.
The percentage of the population participating in recreational physical activities in Asia is estimated at
33.2%, which is just below the global average of 35.5%. A high level of spending on recreational physical
activities does not always equate to a higher level of participation in these activities (and vice versa).
For example, as a region, the Asia and Pacific region has a lower participation rate than Latin America
and the Caribbean, although its per participant spending is quite a bit higher. Similarly, the Asia and
Pacific region’s participation rate is just slightly higher than that of Sub-Saharan Africa, even though its
per participant spending is more than seven times higher.
Figure 3: Recreational Physical Activity Participation Rates
and Average Spending Per Participant, by Region, 2018
Across Asia, recreational physical activity participation varies widely, from a high of 84% in Australia
and Taipei,China to a low of 13%–15% in India and Pakistan. Importantly, many people in Asia conduct
their leisure time physical activity in public places with little or no spending. In the lower-income
countries, people participate in sports and other recreational activities in a variety of public and free
venues (e.g., in public parks and plazas; in free sporting facilities, such as neighborhood basketball
courts or ball fields, in vacant lots, in the streets; and at home). Their out-of-pocket spending is lower
The Physical Activity Economy in Asia: ADB White Paper – December 2019 | 12(or zero) because private fitness and recreation businesses, facilities, and infrastructure are less
developed. For example, no-cost individual and group exercises in public outdoor gyms, plaza dancing,
and tai chi in parks are very popular in the PRC, especially among seniors. “Plaza dancing” (guangchang
wu) has become a major exercise phenomenon, practiced by an estimated 100 million Chinese women
(and some men) – who are mostly middle-aged and seniors – in public squares, parks, parking lots, and
other public venues.
Even in higher-income markets, many people pay nothing to participate in sports and other
recreational physical activities. For example, national survey data show that 67% of adult participants
in Japan, 15 25% in the ROK, 16 and 41% in Australia 17 spend no money on participating in these activities,
and yet participation rates across all three nations are quite high. In addition to their well-developed
private sector fitness markets, the governments in all three of these countries have invested in
widespread publicly subsidized fitness and sports facilities and infrastructure, which allow their
populations to participate with very low out-of-pocket expenditures.
Table 4: Recreational Physical Activity Participation Rates in Asia and the Pacific,
2018
Participation Participation
Rank Rank
Ratea Ratea
Australia 84.1% 1 Viet Nam 35.7% 14
Taipei,China 84.0% 2 Indonesia 34.2% 15
New Zealand 83.8% 3 Philippines 32.7% 16
Mongolia 75.0% 4 Thailand 27.8% 17
Republic of Korea 73.7% 5 Timor-Leste 26.3% 18
Japan 69.6% 6 Bangladesh 25.2% 19
Singapore 64.9% 7 Cambodia 21.4% 20
Hong Kong, China 58.2% 8 Myanmar 21.3% 21
Macau 51.1% 9 Nepal 20.0% 22
People’s Republic of China 48.6% 10 Sri Lanka 19.2% 23
Papua New Guinea 46.4% 11 India 15.0% 24
Malaysia 41.1% 12 Pakistan 13.2% 25
Lao People’s Democratic
39.8% 13
Republic
a Participation rate measures the share of the total population who participate in one or more of the three physical
activity categories on a regular basis (at least monthly).
Source: Global Wellness Institute.
15 Japan Sports Agency. 2017. スポーツの実施状況等に関する世論調査 (Public Opinion Survey on the Implementation
Status of Sport).
http://www.mext.go.jp/prev_sports/comp/b_menu/other/__icsFiles/afieldfile/2018/03/30/142346_77_1.pdf.
16 Ministry of Culture, Sports, and Tourism, Republic of Korea. 2017. 국민생활체육참여실태조사(National Sports
Participation Survey 2017).
https://www.sports.re.kr/front/board/boardFileUseDown.do?board_seq=74&con_seq=2848&file_seq=1606.
17 Australian Sports Commission Clearinghouse for Sport and Physical Activity. AusPlay National Data Tables – July 2018 to
June 2019 data. https://www.clearinghouseforsport.gov.au/research/smi/ausplay/results/national.
The Physical Activity Economy in Asia: ADB White Paper – December 2019 | 13Recognizing the growing public health crisis associated with inadequate levels of physical activity, a
number of governments across Asia have committed to increasing participation rates through greater
public investment in exercise and sports facilities and infrastructure.
• Japan’s high participation rates are supported by government investment in affordable public
facilities. Public and community facilities account for half of the nation’s gyms. There are at
least 5,000 public gyms across the country, and these are supplemented with facilities in
schools and universities that are accessible to the public, which mean that nearly every city in
Japan has access to public/community fitness clubs that offer basic and affordable workout
equipment and services (typically costing less than US$4 per visit). Most small parks and
gardens have some outdoor fitness apparatus, and sports and recreational facilities are ample
in larger parks (e.g., tennis and basketball courts, and playgrounds).
• Singapore’s high participation rate is also buoyed by extensive government investment in
exercise, sports, and recreational facilities and infrastructure that are affordable and
accessible for the entire population. Sport Singapore’s ActiveSG initiative manages over 180
community gyms and recreational centers with classes and programs for all ages, 27 swimming
complexes, and dozens of sporting fields, and there are also over 1,200 free outdoor gyms
throughout the city. ActiveSG and the Singapore Health Promotion Board (HPB) run a number
of national challenges and events to encourage residents to walk and get more exercise, and
some of these offer cash incentives and prizes (as well as free fitness trackers).18 In 2019, the
HPB announced a new “comprehensive digital health platform” based on the use of wearables
(in partnership with FitBit), as part of its national “Live Healthy SG” initiative to encourage
physical activity, healthy eating, and better sleep. (More details are in section III.) 19
• In the ROK; Hong Kong, China; and Taipei,China, outdoor recreational activities such as
running, walking, and hiking, and exercising in parks and squares are popular, and these
activities rely on ongoing investments in public infrastructure. Facing similar demographic
trends of rapidly aging populations, governments are putting increased attention on engaging
and serving an aging population, partly to mitigate concern over rising health care costs. For
example, in Taipei,China, the government has built a large-scale sports and recreational center
in each of Taipei City’s 12 districts since 2003. Exercise for Health was launched in the city of
New Taipei in 2016; the project dispatches instructors to community centers in each of the
city’s 29 districts, targeting seniors and residents with reduced mobility who may not be able
to access the existing civic sports complexes. As part of the program, the city government
signed a 2-year cooperation agreement with Exercise is Medicine (EIM), an initiative launched
by the American Medical Association and the American College of Sports Medicine in 2007 to
integrate physical activity into medical treatment plans. 20
18 GetActive! Singapore. 2019. https://events.myactivesg.com/getactive2019; National University of Singapore Bicentennial
Challenge. https://www.myactivesg.com/whats-on/event/2019/9/nus-sg-bicentennial-challenge; and National Steps
Challenge. https://www.healthhub.sg/programmes/37/NSC.
19 J. Somauroo. 2019. Fitbit Partners With Singapore Government To Offer Trackers To 5.6 Million People. Forbes.
https://www.forbes.com/sites/jamessomauroo/2019/08/22/fitbit-partners-with-singapore-government-to-offer-
trackers-to-56m-people/#176c8d7a2031; and K. Kwang. 2019. HPB partners Fitbit to encourage Singaporeans to adopt
healthier habits. Channel News Asia. https://www.channelnewsasia.com/news/singapore/hpb-fitbit-encourage-
singaporeans-adopt-healthier-habits-11828980.
20 Fitness groups engineer exercise attitude adjustment in Taiwan. Taiwan News. 29 March 2019.
https://www.taiwannews.com.tw/en/news/3668878. (ADB officially recognizes this member as “Taipei,China”).
The Physical Activity Economy in Asia: ADB White Paper – December 2019 | 14• In the PRC, the government has made significant efforts to raise awareness about the
importance of physical activity, and to reduce the disparity of access across regions. In 2016,
the PRC announced a National Fitness Plan, which lays out ambitious goals of having 700
million engage in exercise at least once a week, and 435 million exercising regularly. In support
of this aim, the government has made substantial investments in public sports and recreational
facilities, outdoor gyms, and running paths, as well as in sports programs and promotional
campaigns. 21 These efforts have greatly increased the awareness and interest of the Chinese
public in physical activity, and they have contributed to rising participation in running, walking,
hiking, community sports, and fitness training in the past few years.
• In Southeast Asia, countries such as Indonesia, Malaysia, the Philippines, and Thailand,
typically have lower levels of recreational physical activity participation than in East Asia. The
urban infrastructure in these countries for an active lifestyle (e.g., public parks, jogging trails,
bike paths, and public recreational facilities) is not well-developed. Outside major cities, the
infrastructure for recreational physical activity, both public and private facilities, is even more
limited. Overall, the vast majority of the population lack access to sports and recreational
facilities and has limited knowledge about the importance of exercise. To the extent that
physical activity is supported in schools, the emphasis is often on preparing the best athletes
for competition rather than encouraging physical activity for all. Several country governments
have launched events and media campaigns (e.g., Fit Malaysia) 22 to encourage physical
activity, while also making investments to improve public infrastructure and facilities. The
Government of the Philippines was especially motivated to improve public awareness of sports
and fitness before it hosted the 2019 Southeast Asian Games.
• Across Asia, recreational physical activity participation rates are typically lowest in South Asia.
In India, the country lacks physical activity infrastructure, especially outdoor active recreation
venues in cities. But this is changing. Since 2016, members of Parliament have used local
development funds to install 1,700 open-air gyms in parks throughout New Delhi (at about
$10,000 each), and hundreds more are being planned. 23 In Pakistan, there are also very low
levels of participation, limited public awareness about the health benefits of exercise, and an
undeveloped infrastructure throughout the country. In both markets, female participation in
physical activity, especially in sports and active recreation, has been hampered by cultural and
religious beliefs; however, attitudes are changing, especially among the urban and educated
elites, and participation of women and girls in recreational physical activity is growing.
21 S. Wu, Y. Luo, and M. Bao. 2017. Building a healthy China by enhancing physical activity: Priorities, challenges, and
strategies. Journal of Sport and Health Science, 6(1): 125–126. https://doi.org/10.1016/j.jshs.2016.10.003; and
International Health, Racquet & Sportsclub Association (IHRSA). 2018. Asia-Pacific Health Club Report, second edition.
https://www.ihrsa.org/publications/ihrsa-asia-pacific-health-club-report-second-edition/.
22 https://www.thestar.com.my/news/community/2014/09/05/nationwide-campaign-to-get-fit-movement-aims-to-
highlight-benefits-of-active-lifestyle/ and https://www.thestar.com.my/metro/metro-news/2019/03/27/healthy-
turnout-for-fitness-campaign; and https://expert.taylors.edu.my/file/rems/publication/100975_4483_3.pdf.
23 M. Manohar and P. Singh. 2018. New Delhi: Open gyms make fitness a mass exercise. Times of India.
https://timesofindia.indiatimes.com/city/delhi/open-gyms-make-fitness-a-mass-exercise/articleshow/65507526.cms;
and A. Mishra and R. Chitlangia. 2019. Why open-air gyms topped Delhi MPs’ list of development projects. Hindustan
Times. https://www.hindustantimes.com/delhi-news/why-open-air-gyms-topped-delhi-mps-list-of-development-
projects/story-uVwa3VLjcn8de5flfcROxJ.html.
The Physical Activity Economy in Asia: ADB White Paper – December 2019 | 15There are three subsegments of recreational physical activities: sports and
active recreation, fitness, and mindful movement.
Recreational physical activities are the core of the global physical activity market. The authors estimate
that Asian consumers spent $117 billion out-of-pocket on doing these activities in 2018. By far, sports
and active recreation is the largest category of expenditures ($83 billion) and participation (30%) across
Asia, followed by fitness ($22.7 billion) and mindful movement ($10.9 billion).
Table 5: Recreational Physical Activities in Asia and the Pacific, 2018
Market Sizea Average Spending
Participation Ratea / (US$ billion) per Participant
Recreational Physical Activities 33.2% $116.6 $85
Sports and active recreation 30.4% $83.0 $66
Fitness 1.1% $22.7 $494
Mindful movement 4.5% $10.9 $58
a Market size measures consumer expenditures on classes, memberships, entry fees, trainers, and related services and
methods of participation. Participation rate measures the share of the total population who participate in one or more
of the three physical activity categories on a regular basis (at least monthly).
Note: Numbers may not sum precisely because of overlap between segments and rounding.
Source: Global Wellness Institute.
1. Sports and Active Recreation
By far, sports and active recreation is the most popular way for people to engage in recreational
physical activities (both across Asia and globally). An estimated 30% of Asia’s population participates
on a regular basis (and 33% of the population globally). Asian consumers spent about $66 per
participant annually on doing sports and active recreation, or $83.0 billion in 2018 (accounting for 71%
of all recreational physical activity spending in the region).
The top markets for sports and active recreation spending are primarily wealthier areas that have high
participation rates, combined with higher average spending levels for participants (e.g., Japan; the
ROK; Australia; and Taipei,China). Some of the top markets (notably, the PRC, India, and Indonesia)
have lower participation rates and lower spending levels, but are still among largest markets because
of the sheer size of their populations. Taipei,China ranks highest in the world for its sports and active
participation rate (80.7%), and New Zealand, Australia, Mongolia, the ROK, Japan, and Singapore also
rank in the global top 20 for participation rates (all between 60% and 79%).
The Physical Activity Economy in Asia: ADB White Paper – December 2019 | 16Table 6: Top Twenty Sports and Active Recreation Markets in Asia and the Pacific by
Market Size, 2018
Sports and Active Recreation
Market Sizea Average Spending
Participation Ratea
(US$ million) per Participant
People’s Republic of China 43.5% $42,281.6 $69
Japan 66.5% $13,301.8 $157
Republic of Korea 70.6% $10,940.5 $303
Australia 77.4% $6,709.1 $350
Taipei,China 80.7% $2,792.8 $146
India 12.9% $1,773.8 $10
New Zealand 79.1% $1,134.0 $302
Hong Kong, China 54.0% $787.3 $196
Indonesia 33.7% $685.6 $8
Singapore 60.2% $607.2 $174
Malaysia 40.3% $396.1 $31
Philippines 32.2% $363.5 $11
Thailand 27.1% $332.1 $18
Viet Nam 35.1% $240.6 $7
Pakistan 13.0% $147.9 $6
Bangladesh 24.9% $113.0 $3
Sri Lanka 18.8% $94.5 $24
Macau, China 47.2% $87.3 $292
Myanmar 21.0% $35.7 $3
Cambodia 21.0% $28.1 $8
a Participation rate measures the share of the total population who participate in this physical activity category on a
regular basis (at least monthly). Market size measures consumer expenditures on classes, memberships, entry fees,
trainers, and related services and methods of participation.
Source: Global Wellness Institute.
Sports and active recreation comprises the largest category of recreational physical activity because it
is the most diverse, accessible, affordable, and prevalent way to be physically active, across every
region and population group, rich or poor, young or old, urban or rural, developed or underdeveloped.
By types of activities. In Asia and in nearly every country around the world, walking for
exercise/recreation by far is the most popular activity. Participation in walking appears to range from
20% to 60% in Asian countries, while an estimated 7%–25% participate in running/jogging. 24 It is
challenging to analyze the popularity of playing various team sports because the types of sports played
(and included in survey questions) vary so widely from country to country; soccer is the most
“universal” sport and appears in nearly every country’s sports participation survey. Other popular
24 Across much of Asia, survey data that assess the popularity of various types of activities are spotty. The participation
estimates, as shown here, are very rough estimates made by the authors, and are based on a scan of participation
surveys from 10–12 Asian markets.
The Physical Activity Economy in Asia: ADB White Paper – December 2019 | 17activities in Asia include cycling (5%–25%), swimming (8%–12%), dancing (1%–7%), and martial arts
(1%–8%).
By population segments. Almost across the board, participation rates in sports and active recreational
activities are lower for women than for men (the exceptions are for a few activities such as dancing).
Sports and active recreation is also the predominant way in which children and youth participate in
physical activities. These kinds of activities are critical for introducing children to a lifelong habit of
staying active. In fact, out of the 1.3 billion people in Asia who participate in sports and active
recreation, an estimated 0.5 billion are children (under age 18). The share of children who participate
in sports and active recreation (45%) is higher than the participation rate for adults (24%), because
participation tends to taper off as people enter adulthood and face the responsibilities and time
constraints of jobs, families, and housework. These participation rates measure people doing at least
one activity on a regular basis, but many participants in sports and active recreation often do more
than one type of activity. An adult participant may swim laps and play on a volleyball team, while a
child may play soccer and take karate or dance lessons.
2. Fitness
Just over 1% of the population in Asia are members of gyms, health clubs, and fitness studios and/or
participate in structured or independent fitness activities or classes on a regular basis. Participants in
Asia spent $22.7 billion, or an average of $494 per participant, on doing fitness activities in 2018. These
figures are much broader than just the number of paying members at commercial gyms and health
clubs, who only represent a portion of the market. We include membership and participation in a
variety of other types of gyms and fitness classes in public, nonprofit, university, hotel, outdoor, home,
and other settings, both free and paid (see more details below).
Per participant average spending of $494 in Asia is quite high relative to other regions around the world
(e.g., $383 in North America and $400 in Europe). This is likely because the fitness market is generally
less advanced across most of Asia, and the existing facilities tend to be concentrated in wealthier cities
and serve the higher end of the market. Budget/low-frills gym concepts are generally newer and less
prevalent outside of major metropolises, and public gyms and subsidized/free fitness classes and
programs are also less common in Asia (except in a few key countries, such as Australia, Japan, New
Zealand, and Singapore).
Asia’s largest fitness markets (Japan; Australia; the ROK, Taipei,China; New Zealand; Hong Kong, China;
and Singapore) have highly developed and intensely competitive fitness and gym sectors that cater to
their wealthy and sophisticated consumer base. Fitness participation rates across all these markets
exceed the global average of 3.7%. All of these markets have experienced steady growth—from
internationally branded luxury gyms to small independent studios—spurred by strong purchasing
power, population aging, and rising interest in healthier and more active lifestyles. In the major cities
across these regions, consumers on the high end are often early adopters of the latest North American
and European fitness modules, classes, equipment, and technologies.
Over the past decade, the fitness sector in the PRC has grown rapidly, with the proliferation of gyms,
health clubs, and boutique studios in tier 1 cities (and these are now spreading rapidly across tier 2
The Physical Activity Economy in Asia: ADB White Paper – December 2019 | 18and tier 3 cities). The PRC is also a leading market for fitness technologies, and its fitness wearables
market is now the largest in the world ($4.6 billion according to the authors’ estimates). 25 Fitness apps
are wildly popular in the PRC, where an estimated 68.5 million people actively use apps and online
platforms to support their fitness and healthy lifestyles (from walking, running, and fitness to
guangchang wu, cycling, and yoga). 26 The PRC’s growing number of middle-income and upper-income
consumers have become more health conscious and more interested in exercise, and the fitness sector
is expanding rapidly to meet those needs.
Table 7: Top Twenty Fitness Markets in Asia and the Pacific by Market Size, 2018
Fitness
Market Sizea Average Spending
Participation Ratea
(US$ million) per Participant
Japan 7.8% $5,554.6 $561
People’s Republic of China 0.8% $5,525.4 $477
Australia 24.3% $3,871.7 $642
Republic of Korea 9.2% $2,593.8 $552
India 0.3% $1,020.4 $263
Indonesia 0.7% $547.3 $303
Taipei,China 5.5% $522.6 $398
New Zealand 20.0% $491.7 $517
Hong Kong, China 9.3% $461.7 $667
Singapore 19.5% $429.3 $381
Thailand 0.9% $366.4 $575
Malaysia 2.2% $331.6 $469
Philippines 0.7% $290.8 $403
Viet Nam 0.6% $205.4 $357
Pakistan 0.2% $99.3 $271
Bangladesh 0.2% $94.5 $315
Macau, China 9.9% $58.4 $933
Sri Lanka 0.5% $51.1 $497
Myanmar 0.2% $26.0 $248
Cambodia 0.7% $23.9 $197
a Participation rate measures the share of the total population who are paying members of various types of gym/health
club/fitness facilities and/or who access or utilize their services/classes/facilities on a regular basis (at least monthly).
Market size measures consumer expenditures on classes, memberships, entry fees, trainers, and related services and
methods of participation.
Source: Global Wellness Institute.
25 Global Wellness Institute (2019).
26 Y. Zheng. 2018. Online fitness platforms grow in popularity among the young. The Telegraph.
https://www.telegraph.co.uk/china-watch/sport/online-fitness-platforms-in-china/; and X. Liu. 2018. Fitness industry
works up a sweat in internet age. China Daily.
http://www.chinadaily.com.cn/a/201812/14/WS5c12edf0a310eff303290eea_1.html.
The Physical Activity Economy in Asia: ADB White Paper – December 2019 | 19You can also read