The Quiet Chromosphere - Sami K. Solanki Max Planck Institute for Solar System Research
←
→
Page content transcription
If your browser does not render page correctly, please read the page content below
The Quiet Chromosphere

       Sami K. Solanki

    Max Planck Institute for
    Solar System Research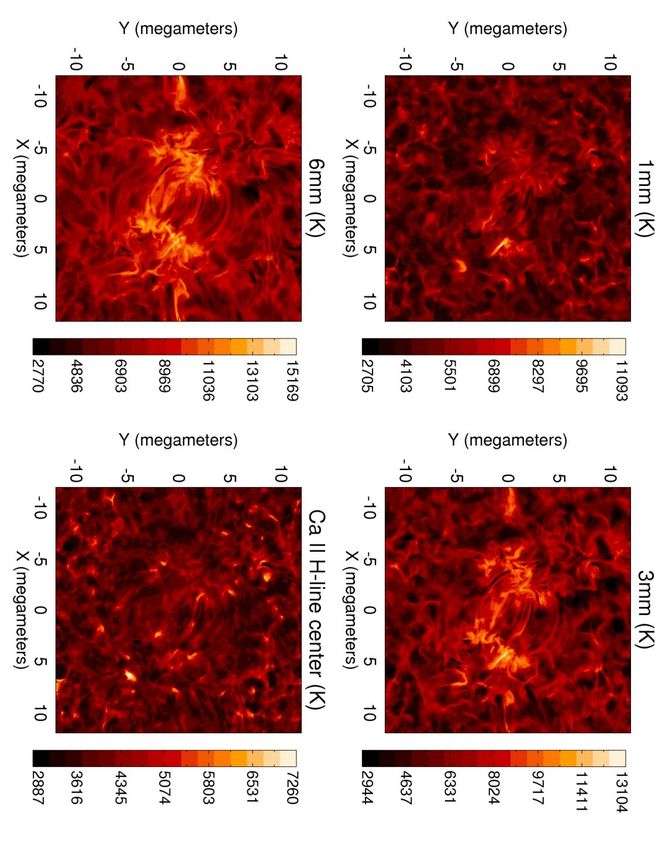
The active
   chromosphere
Coronal mass ejection

                        Flares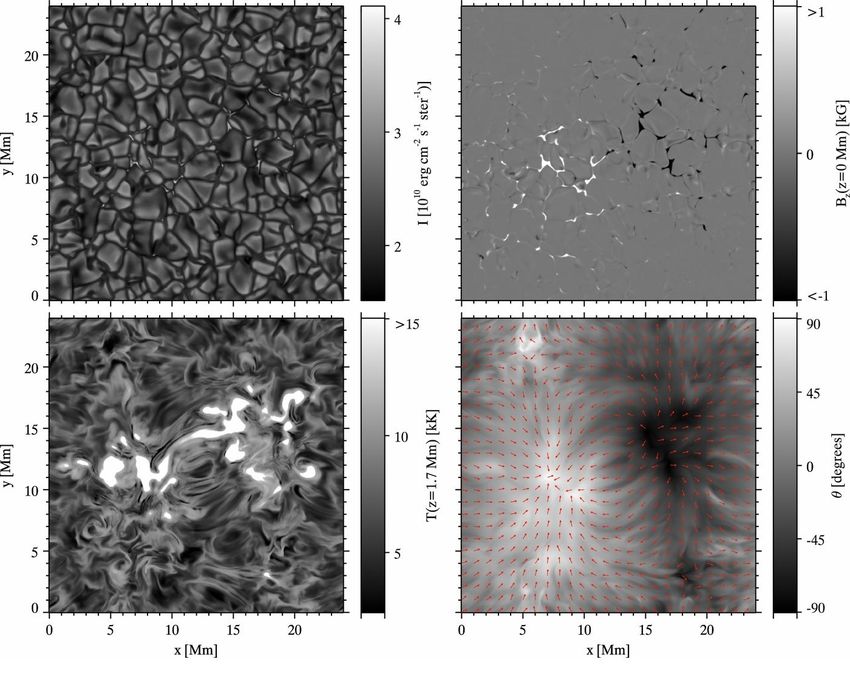
The quiet chromosphere

Chromosphere
Simplified sketch of the QUIET photosphere
             and chromosphere

  Wedemeyer-Böhm et al. 2008; similar to an earlier sketch by Rob Rutten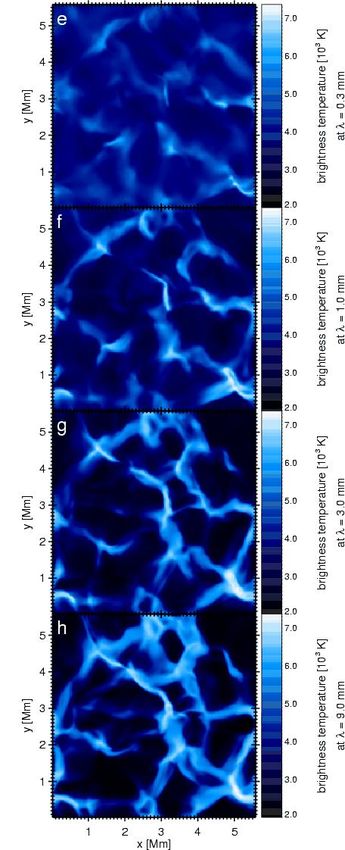
What is special about the chromosphere?
Possibly Sun’s most complex layer: waves, gas (thermal
energy), flows, magnetic field all have similar energy
densities. Radiation needs non-LTE RT treatment, non-
equilibrium ionization, ambipolar diffusion, etc.
Extremely dynamic and
strongly structured
Magnetic field and waves
structure & dynamics
Energy transfer layer: from
photosphere to corona
Spicules at limb
(in Ca II H at SST)
What is special about the
chromosphere?
Chromosphere far less understood than
photosphere. Neglected for many years
This is changing:
TIP II, IBIS, CRISP, etc. increasingly used
to probe the chromosphere
IRIS (launch in April) will mainly study upper
chromosphere (Mg II lines) & TR
Solar C (launch ~2020), will concentrate on
the chromosphere and its interaction with
photosphere and corona
ALMA has chance of studying the solar
chromosphere along with IRIS, NST,
Gregor; well before Solar C & ATST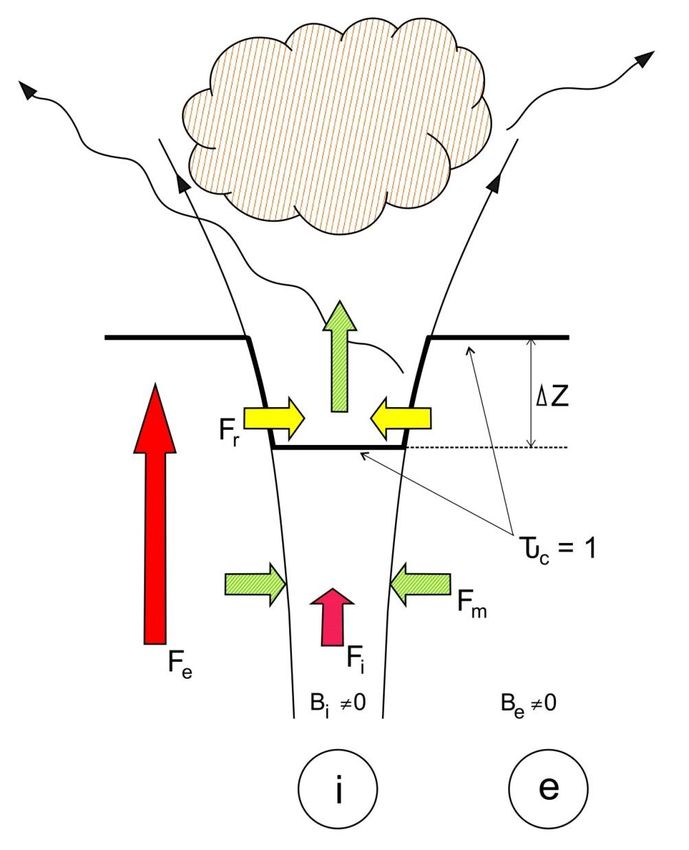
Blue continuum
Observed with SST
by Hirzberger and Zakharov

                      Ca II K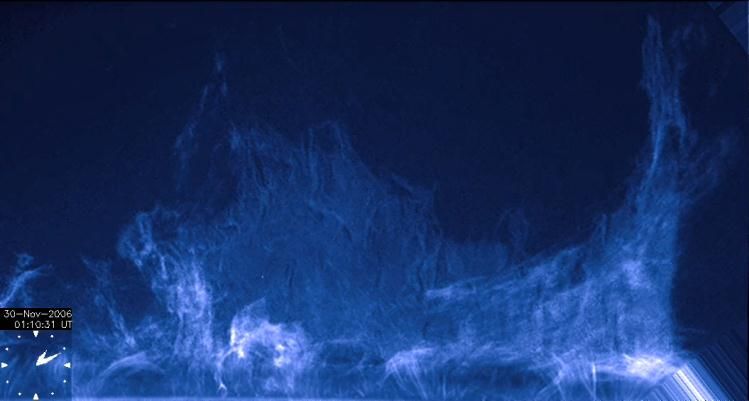
Flux Tubes, Canopies, Loops and
            Funnels

     Hot and bright

                    Expanding
                  field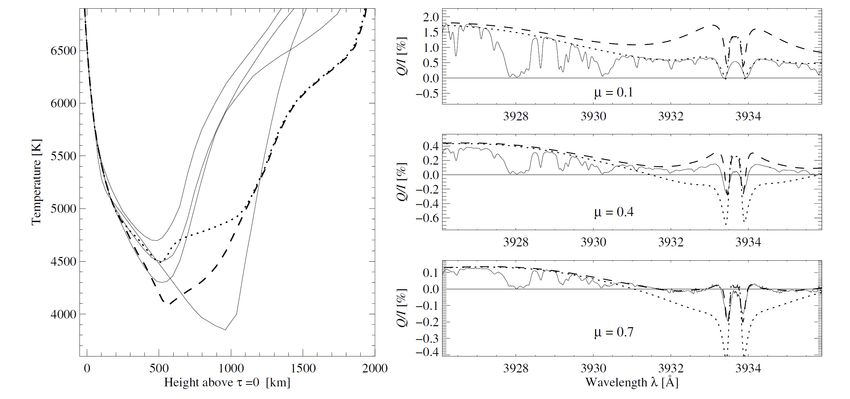
Flux Tubes, Canopies, Loops and
            Funnels

     Hot and bright

                    Expanding
                  field
Evolving structures with height
The convection
dominated image of
the photosphere
(seen in g-band) is
replaced by the
magnetic field and
wave dominated
chromosphere when
observing in strong
spectral lines
(Ca II K and Hα)
DOT data (Rutten and Sütterlin)Chromospheric dynamics (DOT)
Chromospheric dynamics: waves
At low to medium resolution:
Power at 3 min in internetwork
Power at longer periods in
Network
At high spatial resolution:
identification of many wave-
modes and details about their
excitation and propagation
Acoustic waves (everywhere)
Slow and fast mode waves (MHD)
Kink waves (MHD)
MHD waves excited by granular Transverse waves seen in
buffetting of magnetic features Sunrise data sampling
Evidence of wave conversion different heights
Energy transported by MHD waves is sufficient to heat coronaChromospheric dynamics: How
important are shock waves?
As acoustic waves propagate
upwards, they steepen and
shock
Early 1-D models: Do take into
account non-local
Centeno etradiation,
al. 2009
non-locally controlled atomic
levels (time dep. excitations)
Start with piston in CZ,
consistent with obs. of
photospheric oscillations
He 10830
Carlsson & Stein 1993, 1995,
1997, 2001Effect of Ly continuum
shock
waves
on EUV
radiation
Dashed:
temperature at
τ ν =1
Solid: intensity
& radiation
temperature at
τ ν =1
Carlsson & Stein
1995Chromospheric MHD simulation
Various MHD codes
allow chromospheric
structure and dynamics
to be computed. The
most realistic such
code is currently the
Bifrost code of the Oslo
group.
Upper panels:
intensity & BZ in
photosphere
Lower panels:
Temperature at 1.7 Mm
& B-field direction J. Leenaarts et al. 2012Do atomic spectral lines sample cool
regions of the chromosphere?
de la Cruz et al. (2012): Take a
NLTE-RT 3D MHD simulatiion of
the solar photosphere and
chromosphere, compute in 3D a
popular chromospheric line (Ca
II 8542 Å), invert these synthetic
profiles to get the 3D structure of
the chromosphere and then
compare with the original
Results:
The inversion works reasonably
well in warmer part of
chromosphere
For cooler gas the inversion can
get things wrongDo atomic spectral lines sample cool
regions of the chromosphere?
de la Cruz et al. (2012): Reason
for fitting computed line profile
with too high temperature is that
the forward calculation was done
in 3D, but the inversion in 1D
In reality the effect will be much
stronger:
Their work assumes perfect
spatial resolution, i.e. no PSF,
no scattered light
Both the inner part of the PSF
and the presence of scattered
light hide small cool pockets
(Ayres effect)Evidence for cool gas: CO lines at 5 μm
From
atomic lines
From CO
lines
Ayres 1981, 2002 ApJ, Ayres et al. 1986, 1998 ApJ, Solanki et al. 1994 Science
Uitenbroek et al. 1994 ApJ, Uitenbroek 2000a, b 2000More evidence for inhomogeneous
chromosphere with cool component
Holzreuter et al. (2006); Holzreuter & Stenflo (2007): in order
to reproduce scattering polarization of Ca II K line, two
components with rather different temperatures are neededSub-mm and mm data as a diagnostic
Sub-mm and mm radiation in quiet chromosphere:
H--free-free, with source function in LTE: Planck law
Rayleigh-Jeans: intensity depends linearly on
temperature Radiation sees both hot & cool gas
Combines advantages of CO (sees cool gas) &
atomic lines (sees hot gas). Additional weighting
according to the electron density (not in equilibrium)
Main disadvantage: poor spatial resolution of
instruments available so far (BIMA, CARMA, VLA)
There is a strong need for a higher resolution
telescope such as ALMASub-mm and mm “observations” of
Carlsson-Stein model
Loukitcheva et al. 2004aBrightness
temperature
for different
wavelengths
9mm 3mm 1mm 0.1mm
Wedemeyer-Boehm et al. 2007
Brightness
temperature
for different
spatial
resolutions
0.9” 0.6” 0.3” 0.06”Radiation at mm wavelengths from 3-D
MHD simulations of rising bipole
1mm radiation 3mm radiation
Movies by M. Loukitcheva, from Bifrost computations, provided by M. CarlssonCa II H vs. mm wavelengths
mm wavelength radiation allows probing the
chromosphere at different heights reaching
considerably higher than even the strongest lines in
the visible
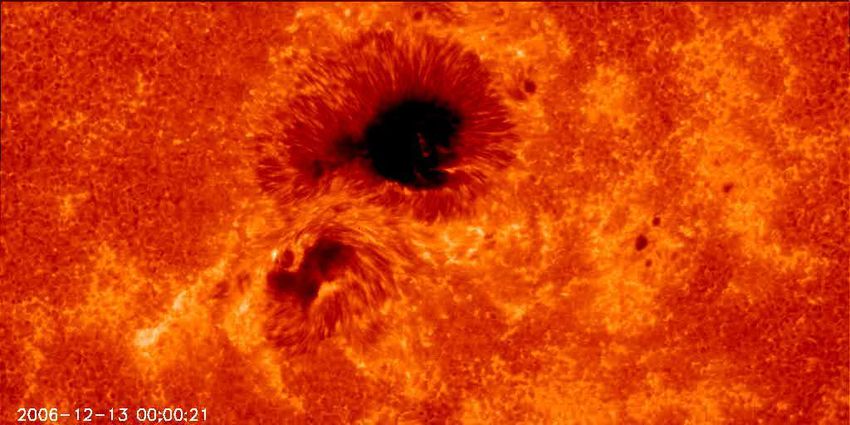
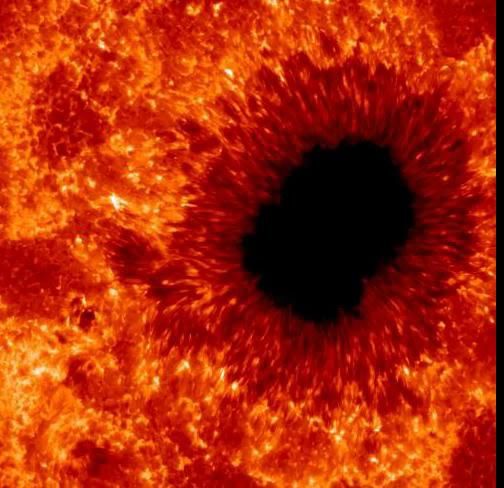
Images by M. Loukitcheva, from Bifrost computations, provided by M. CarlssonSunspots
Chromospheric layers of sunspots are rather poorly known.
Various umbral models exist (based
on atomic spectral lines); they differ
rather strongly
At sub-mm and mm wavelengths they
give vastly different signatures
About penumbrae, even less is known. Only 3 models, with
even larger differences
Loukitcheva et al., in preparationConclusions
The chromosphere is an exciting and relatively poorly
studied part of the solar atmosphere
Sub-mm and mm-wavelength data have the potential to
provide information beyond that given by atomic lines
ALMA will have the necessary spatial resolution to fulfil this
potential
See also talks by
M. Loukitcheva and S. Wedemeyer-Böhm for more on modelling
S. White for more on observationsThank you for your attention
You can also read