The Relation Between Capillary Transit Times and Hemoglobin Saturation Heterogeneity
←
→
Page content transcription
If your browser does not render page correctly, please read the page content below

ETH Library

The Relation Between Capillary
Transit Times and Hemoglobin
Saturation Heterogeneity
Part 1: Theoretical Models

  Journal Article

  Author(s):
  Lücker, Adrien; Secomb, Timothy W.; Weber, Bruno; Jenny, Patrick

  Publication date:
  2018-04-26

  Permanent link:
  https://doi.org/10.3929/ethz-b-000263459

  Rights / license:
  Creative Commons Attribution 4.0 International

  Originally published in:
  Frontiers in Physiology 9, https://doi.org/10.3389/fphys.2018.00420

  Funding acknowledgement:
  140660 - Oxygen Transport in the Cerebral Microcirculation (SNF)

  This page was generated automatically upon download from the ETH Zurich Research Collection.
  For more information, please consult the Terms of use.
ORIGINAL RESEARCH
                                                                                                                                                    published: 26 April 2018
                                                                                                                                            doi: 10.3389/fphys.2018.00420

                                                The Relation Between Capillary
                                                Transit Times and Hemoglobin
                                                Saturation Heterogeneity. Part 1:
                                                Theoretical Models
                                                Adrien Lücker 1*, Timothy W. Secomb 2 , Bruno Weber 3 and Patrick Jenny 1
                                                1
                                                 Department of Mechanical and Process Engineering, Institute of Fluid Dynamics, ETH Zurich, Zurich, Switzerland,
                                                2
                                                 Department of Physiology, University of Arizona, Tucson, AZ, United States, 3 Institute of Pharmacology and Toxicology,
                                                University of Zurich, Zurich, Switzerland

                                                Capillary dysfunction impairs oxygen supply to parenchymal cells and often occurs in
                          Edited by:
                                                Alzheimer’s disease, diabetes and aging. Disturbed capillary flow patterns have been
                Joseph L. Greenstein,           shown to limit the efficacy of oxygen extraction and can be quantified using capillary
             Johns Hopkins University,          transit time heterogeneity (CTH). However, the transit time of red blood cells (RBCs)
                       United States
                                                through the microvasculature is not a direct measure of their capacity for oxygen delivery.
                       Reviewed by:
                      Ranjan K. Dash,           Here we examine the relation between CTH and capillary outflow saturation heterogeneity
        Medical College of Wisconsin,           (COSH), which is the heterogeneity of blood oxygen content at the venous end of
                        United States
                      Daniel Goldman,
                                                capillaries. Models for the evolution of hemoglobin saturation heterogeneity (HSH) in
University of Western Ontario, Canada           capillary networks were developed and validated using a computational model with
                      Leif Østergaard,          moving RBCs. Two representative situations were selected: a Krogh cylinder geometry
     Center of Functionally Integrative
          Neuroscience and MINDLab,             with heterogeneous hemoglobin saturation (HS) at the inflow, and a parallel array of four
                              Denmark           capillaries. The heterogeneity of HS after converging capillary bifurcations was found
                 David Robert Grimes,
            Queen’s University Belfast,
                                                to exponentially decrease with a time scale of 0.15–0.21 s due to diffusive interaction
                      United Kingdom            between RBCs. Similarly, the HS difference between parallel capillaries also drops
                   *Correspondence:             exponentially with a time scale of 0.12–0.19 s. These decay times are substantially smaller
                         Adrien Lücker          than measured RBC transit times and only weakly depend on the distance between
              luecker@ifd.mavt.ethz.ch
                                                microvessels. This work shows that diffusive interaction strongly reduces COSH on a
                   Specialty section:           small spatial scale. Therefore, we conclude that CTH influences COSH yet does not
         This article was submitted to          determine it. The second part of this study will focus on simulations in microvascular
        Computational Physiology and
                             Medicine,          networks from the rodent cerebral cortex. Actual estimates of COSH and CTH will then
               a section of the journal         be given.
               Frontiers in Physiology
                                                Keywords: blood flow, capillary transit time heterogeneity, computational modeling, hematocrit, hemoglobin
       Received: 28 November 2017
                                                saturation, microcirculation, oxygen transport, red blood cells
           Accepted: 04 April 2018
           Published: 26 April 2018
                              Citation:         INTRODUCTION
 Lücker A, Secomb TW, Weber B and
Jenny P (2018) The Relation Between
                                                Microvessels are the primary site of gas exchange in the vertebrate microvascular system due to
           Capillary Transit Times and
Hemoglobin Saturation Heterogeneity.
                                                their large surface area. Energy metabolism is largely dependent on a continuous oxygen supply
           Part 1: Theoretical Models.          from the microcirculation which is actively regulated by the microvasculature. For instance, in
                 Front. Physiol. 9:420.         the cerebral cortex, dilations of pial arteries (Chen et al., 2011) and penetrating arterioles (Tian
     doi: 10.3389/fphys.2018.00420              et al., 2010) are essential components of neurovascular coupling. The smallest blood vessels are

Frontiers in Physiology | www.frontiersin.org                                          1                                                  April 2018 | Volume 9 | Article 420
Lücker et al.                                                                                            Hemoglobin Saturation Heterogeneity—Theoretical Models

also involved in these processes. Capillary hyperemia was shown                       in terms of the heterogeneity of hemoglobin saturation (HS),
to occur prior to dilation of pial arteries (Hillman, 2014) and                       which is functionally dependent on PO2 according to the oxy-
pericyte-mediated capillary dilations were observed to actively                       hemoglobin saturation curve. This study therefore focuses on
regulate cerebral blood flow (Hall et al., 2014). Therefore,                          capillary outflow saturation heterogeneity (COSH), a measure
an efficient and robust regulation of oxygen supply is highly                         of the variability of blood oxygen content at the distal end
dependent on the healthy function of microvessels.                                    of capillaries where blood flows into venules. Elevated COSH
    Malfunctions in the microvasculature occur in many diseases                       may imply that a fraction of microvessels cannot supply oxygen
and conditions. Cerebral small vessel disease plays a crucial role                    to their surrounding tissue even if the average saturation is
in stroke, dementia and aging (Pantoni, 2010). Cerebral pericytes,                    sufficiently high.
which were reported to regulate capillary diameter during                                In previous modeling works (Jespersen and Østergaard, 2012;
functional activation (Hall et al., 2014), are susceptible to damage                  Angleys et al., 2015), the effects of CTH on brain oxygenation
in ischemia (Yemisci et al., 2009) and to loss or degeneration in                     were quantified using blood oxygen levels. Both tissue PO2 and
conditions such as aging, hypertension and diabetes (Østergaard                       capillary HS were shown to depend on transit times through the
et al., 2015). Exposure to β-amyloid is toxic to pericytes and                        erythrocyte velocity. Like other microvascular beds, the brain
amyloid accumulation often occurs in relation to Alzheimer’s                          microvasculature has a heterogeneous geometric structure and
disease (Hamilton et al., 2010). These deposits characterize                          hemodynamics, with substantial variability in path lengths, vessel
cerebral amyloid angiopathy which is associated with cerebral                         diameters, flow rates, hematocrit, and tissue volumes supplied by
blood flow disturbance (Thal et al., 2009). Therefore, the study                      individual capillaries. In parallel capillary arrays, the interaction
of these conditions requires a proper understanding of the                            among vessels reduces the heterogeneity of PO2 when RBC
consequences of capillary dysfunction on oxygen transport.                            velocity and inlet oxygen concentration take different values in
    Capillary dysfunction can be quantified by capillary transit                      each capillary (Popel et al., 1986; Salathe, 2003). Besides, in the
time heterogeneity (CTH) which is the standard deviation of                           absence of CTH, irregular capillary spacings lead to a more
the transit time distribution. In their seminal study, Jespersen                      heterogeneous oxygenation compared to regularly spaced arrays
and Østergaard (2012) showed using a theoretical model that the                       (Hoofd and Turek, 1996), which also affects the distribution
efficacy of oxygen extraction decreases with CTH. In particular,                      of HS. Therefore, multiple factors beside CTH contribute to
disturbed capillary flow patterns can decrease oxygen extraction                      COSH, and CTH by itself does not provide a sufficient basis for
even in the absence of changes in mean flow. CTH was linked to                        understanding and predicting tissue oxygenation. The present
a number of diseases and conditions such as Alzheimer’s disease                       study addresses the factors determining COSH and its relation
(Østergaard et al., 2013a), stroke-like symptoms (Østergaard                          to CTH, using theoretical models.
et al., 2013b), traumatic brain injury (Østergaard et al., 2014a)                        To compute COSH, models that describe the evolution
and ischemic heart disease (Ostergaard et al., 2014b).                                of HSH in single and multiple capillaries are developed.
    In the study by Jespersen and Østergaard (2012), CTH was                          Diffusive oxygen transfer among RBCs is shown to be the main
related to the oxygen extraction fraction by extending the Bohr-                      physical mechanism for the reduction of HSH. The diffusive
Kety-Crone-Renkin model which assumes homogeneous oxygen                              interaction between RBCs in single capillaries and between
partial pressure (PO2 ) in the extravascular compartment. This                        parallel capillaries is modeled based on ordinary differential
flow diffusion equation relates the decrease in blood oxygen                          equations. These interaction models are validated for a large
concentration to the capillary transit time and the oxygen partial                    range of physiological parameters using a computational model
pressure drop across the capillary wall by means of a single                          with individual moving RBCs (Lücker et al., 2014). Explicit
rate constant. This constant was fitted to yield a resting oxygen                     formulas for the associated length and time scales are given
extraction fraction value of 0.3 and the tissue PO2 was required                      and the resulting values are compared to RBC transit times
as a model input. Angleys et al. (2015) refined this model                            and path lengths in capillaries. The modeling of COSH is an
to determine tissue PO2 values that match metabolic oxygen                            essential step toward an actual understanding of CTH and its
consumption and the oxygen extraction fraction values predicted                       relation to oxygen transport in MVNs. The resulting insights
by the Bohr-Kety-Crone-Renkin model.                                                  have potentially broad implications in the study of capillary
    The distribution of PO2 levels at the distal ends of capillaries                  dysfunction and related conditions.
is a key determinant of tissue oxygenation. Even if blood flow to
a given region is adequate to meet the oxygen needs of the tissue,
a maldistribution of flow can lead to wide variations of end-                         MATERIALS AND METHODS
capillary PO2 . If the PO2 distribution is highly heterogeneous,
low values in some capillaries can cause tissue hypoxia,                              Models for the diffusive interaction between RBCs in single
whereas a uniform distribution of end-capillary PO2 tends to                          capillaries and between multiple capillaries were developed based
minimize tissue hypoxia, for a given overall oxygen supply. The                       on ordinary differential equations that extend those used in
heterogeneity of end-capillary PO2 can equivalently be expressed                      Lücker et al. (2017). The interaction models were compared
                                                                                      to our previously developed oxygen transport model with
Abbreviations: COSH, capillary outflow saturation heterogeneity; CTH, capillary
                                                                                      individual moving RBCs (Lücker et al., 2014).
transit time heterogeneity; HS, hemoglobin saturation; HSH, hemoglobin                   Based on the observation that the RBC transit time is only one
saturation heterogeneity; RBC, red blood cell.                                        of multiple parameters that determine HS (Lücker et al., 2017),

Frontiers in Physiology | www.frontiersin.org                                     2                                            April 2018 | Volume 9 | Article 420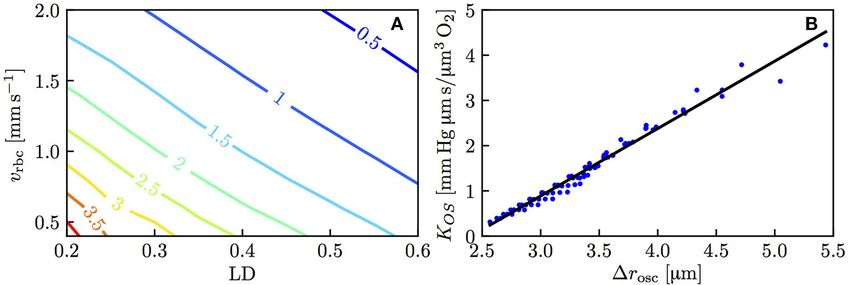
Lücker et al.                                                                                    Hemoglobin Saturation Heterogeneity—Theoretical Models

we asked the question: “Which phenomena cause a difference                  metabolic oxygen consumption integrated over the tissue slice
between CTH and COSH?” Two representative situations that                   normal to the capillary at x, which is denoted by jt (x). The mass
contribute to a reduction of HSH were identified. The first one             balance between the capillary and the tissue is given by
pertains to branchings where two capillaries with different HS
levels are converging. This heterogeneity, which may result from                                        df (S)
                                                                                                               = −jt (x),                                (4)
different transit times, causes the rates of oxygen unloading from                                       dx
individual RBCs to differ. The second situation concerns parallel
                                                                            where f (S) is the convective oxygen flux through the capillary.
capillaries with different HS. In this case, the tissue volume
                                                                            Oxygen consumption is assumed to occur at a rate per
supplied by each capillary can differ.
                                                                            unit volume M0 which is independent from tissue PO2 . This
   Diffusive interaction models are derived for these two
                                                                            simplification allows the existence of an analytical expression
representative situations. These simplified models directly
                                                                            for PO2 in the tissue. Based on this assumption, the oxygen
highlight the variables that influence most the reduction of HSH.
                                                                            consumption in the tissue slice normal to x becomes
Then, the employed computational model (Lücker et al., 2014) is
briefly outlined.
                                                                                                  jt (x) = M0 π(rt2 (x) − rw2 ),                         (5)
Models for Hemoglobin Saturation Based
                                                                            as illustrated in Figure 1A.
on Ordinary Differential Equations                                              Oxygen in the blood is present bound to hemoglobin in RBCs
The interaction models developed in this study are all formulated           and dissolved in both plasma and RBCs. The total convective flux
in an axisymmetric geometry with four distinct regions: RBCs,               is given by
plasma, capillary endothelium and tissue, denoted by the indices
c, p, w, and t, respectively. Cylindrical RBCs with radius rc and                          f (S) = vrbc (πrp2 HD C0 S + πrp2 αeff PIV ),                 (6)
volume Vrbc are employed. The domain geometry is described by
its length L, the plasma radius rp , the outer capillary wall radius        where C0 = NHb Vmol,O2 is the product of the heme
rw and the tissue radius rt (x) which may be a function of the              concentration and the molar volume of oxygen, and PIV is the
axial position x (Figure 1A). The arterial and venous capillary             intravascular PO2 which needs to be modeled. Here, the Fåhraeus
ends (also referred to proximal and distal ends) are denoted by             effect is neglected, hence the discharge hematocrit HD is set to
the indices a and v.                                                        HT . The effective oxygen solubility is defined by αeff = HT αc +
    In capillaries, RBCs flow in a single file with velocity vrbc and       (1 − HT )αp . The first term in the right-hand side of Equation (6)
the RBC linear density is defined to be the ratio of the length             thus accounts for oxygen bound to hemoglobin and the second
occupied by the RBCs to the total vessel length. It is related to           one represents dissolved oxygen in the capillary. The average
the tube hematocrit HT by                                                   RBC oxygen partial pressure Pc is assumed to be in equilibrium
                                                    2                     with HS, that is, Pc = Peq (S); in the plasma, the oxygen partial
                                                rp                          pressure is set to be constant and equal to Pw , the oxygen partial
                             µLD = HT                     .      (1)
                                                rc                          pressure at the capillary outer wall. As in Lücker et al. (2017), we
                                                                            use the intravascular resistance coefficient KIV defined by
The equilibrium curve for hemoglobin and oxygen is modeled
using the Hill equation                                                                                KIV jt = Pc − Pw .                                (7)

                                                Pn                          Values of KIV can be fitted from numerical simulations or
                             Seq (P) =             n ,           (2)
                                          Pn    + P50                       obtained using an analytical formula (Lücker et al., 2017). This
                                                                            yields
where n is the Hill exponent and P50 the oxygen partial pressure
at half-saturation. The inverse form of this equation                        PIV = HT Peq (S) + (1 − HT )Pw = Peq (S) − (1 − HT )KIV jt . (8)
                                                     1/n                  We can now summarize the above equations to obtain the
                                                 S
                         Peq (S) = P50                           (3)        evolution equation for HS. For brevity, we define total oxygen
                                                1−S
                                                                            convective capacity as
will often be required. Since the Hill equation is known to be
                                                                                                                                      dPeq
inaccurate at low PO2 values, the more complex Adair equation                         QO2 (S) = vrbc        µLD πrc2 C0   + πrp2 αeff            .       (9)
(Popel, 1989) will also be used to estimate diffusive interaction                                                                      dS
between parallel capillaries.
                                                                            Equations (4), (6) and (8) result in
    The models developed here are based on the neglect of axial
diffusion and the use of steady-state equations. These common                            dS                                         djt (x)
assumptions (Hellums, 1977; Roy and Secomb, 2014; Lücker                       QO2 (S)      = −jt (x) + vrbc πrp2 αeff (1 − HT )KIV         .          (10)
                                                                                         dx                                          dx
et al., 2017) reduce the evolution of HS to an ordinary differential
equation. Based on the absence of axial diffusion, the oxygen               When the tissue domain is a straight cylinder, the last term
outflux from the capillary at the axial position x is balanced by the       vanishes. If the tissue radius is not constant, this term is nonzero

Frontiers in Physiology | www.frontiersin.org                           3                                                 April 2018 | Volume 9 | Article 420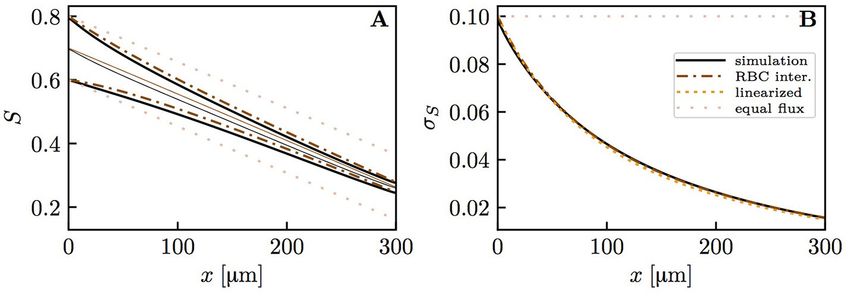
Lücker et al.                                                                                                    Hemoglobin Saturation Heterogeneity—Theoretical Models

 FIGURE 1 | Schematics for RBC diffusive interaction. (A) Cylindrical domain used for the study of RBC diffusive interaction. In the modeled scenario, RBCs are
 flowing from a converging bifurcation into the domain with different HS values. The shaded tissue slice has area π(rt2 − rw
                                                                                                                           2 ), where r is the tissue cylinder radius and r
                                                                                                                                       t                                   w
 is the capillary endothelium radius. The term jt defined in Equation (5) corresponds to the metabolic oxygen consumption in the tissue slice at a given axial position x.
 The plasma radius is denoted by rp and the domain axial length by L. (B) Sketch for the definition of the integral spreading distance of PO2 oscillations (Equation 21).
 The top and bottom radial profiles indicate the maximal and minimal values of PO2 as RBCs are passing. The integral in cylindrical coordinates of the blue rectangle
 with width 1rosc is equal to that of the black hatched area.

but was found to be negligible. Therefore, it will be omitted                                for the oxygen partial pressure at a distance r from the capillary
in further derivations. However, this term was included in all                               centerline reads
numerical computations for completeness. Equation (10) can be
recast in terms of the capillary transit time τ and integrated as                                                M0               r
                                                                                             P(x, r) = Pw (x) −         2rt2 ln       − r2 + rw2 ,     r ≥ rw .
                             Z                                                                                  4Dt αt           rw
                                     τ            jt (vrbc t)                                                                                             (13)
            S(τ ) = Sa −                                             dPeq
                                                                            dt.   (11)
                                 0       µLD πrc2 C0   + πrp2 αeff    dS                     Diffusive Interaction Between RBCs in a Single
                                                                                             Capillary
Thus, HS on the distal side is influenced by the RBC transit time,                           Capillary networks in the cerebral microvasculature form a
the oxygen consumption per unit length, hematocrit and vessel                                mesh-like structure (Lorthois and Cassot, 2010; Blinder et al.,
diameter. This description of distal blood oxygen concentration                              2013) with both diverging and converging bifurcations. At
is more complete than the previously used Bohr-Kety-Crone-                                   converging bifurcations, RBCs from either inflow branch may
Renkin equation (Jespersen and Østergaard, 2012; Angleys et al.,                             have different HS, for instance due to different transit times or
2015). The BKCR model uses the normalized coordinatee    x = x/L                             hematocrit values. Here, we derive an interaction model for the
and reads                                                                                    evolution of HS saturation in a single capillary.
                                         1/n     !                                             To describe this fluctuation, the HS is treated as a random
           dC                         C                                                      variable S. The RBC interaction model is based on Fick’s law as
               = −kτ αrbc P50                  − Ct ,         (12)
           de
            x                       B−C                                                      follows: the oxygen flux out of the capillary is assumed to be
                                                                                             proportional to the oxygen partial pressure difference between
where C is the bound oxygen concentration in RBCs, B is                                      the RBC and the tissue. In other words, we assume that
the maximal amount of oxygen bound to hemoglobin and Ct
the oxygen concentration in the tissue. The model constant k                                                           dS
                                                                                                             QO2 (S)      = −C(Peq (S) − P(rs )),                       (14)
was adjusted to obtain an oxygen extraction fraction of 0.3 in                                                         dx
Jespersen and Østergaard (2012) and Angleys et al. (2015). In
Equation (10), the counterpart of k is the inverse of QO2 (S)                                where rs is a radial position which is independent from the
(Equation 9) which is an explicit function of hematocrit and the                             fluctuations of S and where the PO2 fluctuations in the tissue are
vessel geometry.                                                                             small (Figure 1B), and C is a proportionality factor that will be
   Given the sink term jt (x), Equation (10) can be integrated                               derived. From now on, averaged quantities will be denoted by
numerically using a standard differential equation solver. The                               an overline. In the next steps, the nonlinearity in S of the total
implementation in SciPy (Jones et al., 2001) of an explicit Runge-                           convective oxygen capacity QO2 (S) (Equation 9) will be ignored,
Kutta method of order 4(5) was used (Hairer et al., 1993).                                   which allows the simplification QO2 (S) = QO2 (S). Based on this,
   In the modeling of diffusive integration between parallel                                 the averaged mass balance is given by
capillaries, knowledge of the PO2 in the tissue will be required.
This is achieved using the intravascular resistance coefficient                                                                 dS
and the Krogh model. From the HS S at an axial position x,                                                            QO2 (S)      = −jt (x).                           (15)
                                                                                                                                dx
the average RBC oxygen partial pressure Pc is obtained using
Equation (3). The oxygen partial pressure Pw at the capillary                                The averaging of Equation (14) combined with Equation (15)
outer wall is then given by Equation (7). Finally, the Krogh model                           yields an expression for C which can be inserted into

Frontiers in Physiology | www.frontiersin.org                                            4                                                April 2018 | Volume 9 | Article 420
Lücker et al.                                                                                                  Hemoglobin Saturation Heterogeneity—Theoretical Models

Equation (14). The terms can be rearranged as                                              Diffusive Interaction Between Parallel Capillaries
                                                           !                               Having examined the diffusive interaction between
                        dS               Peq (S) − Peq (S)                                 heterogeneously saturated RBCs in the same capillary, we
                QO2 (S)    = −jt (x) 1 +                     .                  (16)       now consider the diffusive interaction between capillaries
                        dx               Peq (S) − P(rs )
                                                                                           with different saturation levels. For our analysis, four parallel
The oxygen partial pressure P(rs ) still needs to be modeled. This                         capillaries with concurrent blood flow are considered where both
is achieved by introducing the resistance coefficient for RBC                              pairs of diagonally opposed capillaries will be denoted by the
diffusive interaction KRI = (Peq (S) − P(rs ))/jt (x), which is the                        indices φ and ψ, respectively (Figure 2).
only parameter of this model. Thus, the model equation for                                     Given different HS values Sφ,a , Sψ,a at the proximal inlets, we
randomly distributed HS in a single capillary is given by                                  aim to derive the evolution of S in both capillaries. To do this,
                                                                                           the tissue region supplied by each capillary is approximated by a
                          dS              1                                                cylinder with varying radius which will be determined using the
                QO2 (S)      = −jt (x) −     (Peq (S) − Peq (S)).               (17)       continuity of tissue PO2 . As above, the neglect of axial diffusion
                          dx             KRI
                                                                                           allows tissue slices that are orthogonal to the capillary to be
   By a suitable linearization, the nonlinear Equation (17) can                            decoupled. Let A be the area of the normal domain slice supplied
be further simplified to an evolution equation for the standard                            by the two model capillaries φ and ψ. Mass conservation implies
deviation of S. Here, we again assume that the function Peq                                that the oxygen flux at x out of both model capillaries balances
                                                                           d dPeq          the metabolic oxygen consumption in the tissue slice normal
(Equation 3) is linear around S and that the derivative                    dx dS (S)       to x:
can be neglected. It follows that

                           d               1 dPeq                                                          jt,φ (x) + jt,ψ (x) = M0 (A − 2πrw2 ).                 (22)
                 QO2 (S)      (S − S) = −                       (S − S).        (18)
                           dx             KRI dS            S
                                                                                           Using the intravascular resistance coefficient and the Krogh
Using the above assumptions, the standard deviation of HS σS
                                                                                           model (Equation 13), the continuity of tissue PO2 at the interface
satisfies the differential equation
                                                                                           between the Krogh cylinders is given by
                                    dσS    σS dPeq
                          QO2 (S)       =−                      .               (19)
                                    dx     KRI dS           S                              Pc,φ (x) − KIV,φ jt,φ (x) − 1PEV (jt,φ (x)) = Pc,ψ (x) − KIV,ψ jt,ψ (x)
                                                                                                                                          −1PEV (jt,ψ (x)), (23)
This equation can be solved numerically given the average HS S
which is itself obtained by integrating Equation (10).
    The resistance coefficient KRI describes the resistance to the                         where 1PEV (jt ) is the extravascular PO2 drop associated to
PO2 drop between the RBC and a location in the tissue where PO2                            the local oxygen outflux jt . Based on the right-hand side of
oscillations are small. Since oscillations resulting from fluctuating                      Equation (13), it is given by
capillary PO2 decay exponentially with distance into the tissue,
there is no precise definition of this location and no exact                                                   (        h                      i
formula for KRI can be derived. However, this coefficient can                                                       M0
                                                                                                                   4Dt αt2rt2 ln rrwt − rt2 + rw2 , jt ≥ 0,
                                                                                                1PEV (jt ) =
be fitted based on numerical simulations and compared to a                                                         0,                               jt < 0.
measure for the spreading distance of PO2 oscillations into the                                                         s
tissue. First, KRI is decomposed as KRI = KIV + KOS , where                                                                  jt
                                                                                                                   rt =          + rw2                      (24)
KIV is the intravascular resistance coefficient (Lücker et al.,                                                           M0 π
2017) and KOS represents the extravascular contribution to KRI .
Second, we define a characteristic penetration radius rosc for PO2
oscillations by                                                                            Given Pc,φ and Pc,ψ , the nonlinear equation system formed by
                                                                                           Equation (22) and (23) can be solved numerically for jt,φ and
                                                Z
                       2
                                                    rt                                     jt,ψ . Then, Equation (10) is solved in both model capillaries one
                    π(rosc − rw2 )1Pmax =                r1P(r)dr,              (20)       step forward using an explicit differential equation integrator.
                                                rw
                                                                                           This model will be referred to as nonlinear Krogh-based model
where 1P is the radially varying fluctuation in tissue PO2                                 and can be applied to capillaries with different flows and
(Figure 1B). Finally, the integral oscillation spreading distance                          radii. Cases where one capillary is supplied with oxygen by
1rosc is defined as                                                                        the other (for instance, jt,ψ      < 0) are captured by this
                                                                                           formulation.
                                1rosc = rosc − rw .                             (21)           A slight simplification in Equation (23) provides an explicit
                                                                                           expression for the oxygen flux out of both model capillaries.
This quantity can be obtained from the results of the                                      Under the assumption that both capillaries have the same
computational model. We will show that 1rosc is an accurate                                geometry and linear density, the intravascular resistance
predictor for the model coefficient KOS .                                                  coefficient KIV takes the same value in both capillaries, so

Frontiers in Physiology | www.frontiersin.org                                          5                                             April 2018 | Volume 9 | Article 420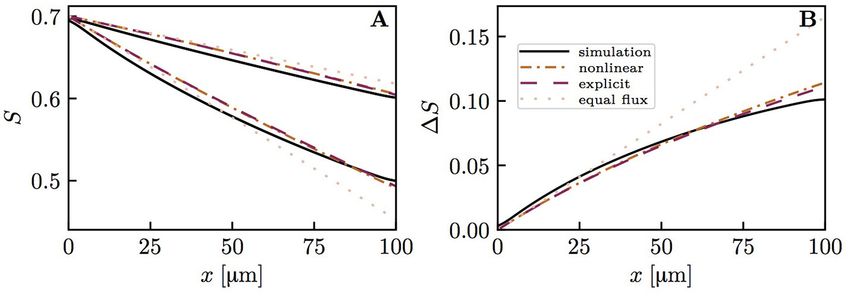
Lücker et al. Hemoglobin Saturation Heterogeneity—Theoretical Models
FIGURE 2 | Schematics for capillary diffusive interaction. (A) Sketch of the geometry with four parallel capillaries. (B) Transverse view of the computational domain
with four parallel capillaries. The shaded areas represent the tissue regions supplied by each capillary. Solid lines: boundary of the representative domain with periodic
boundary condition; dash-dotted lines: actual computational domain with symmetry boundary condition; dotted lines: boundary of the tissue region supplied by each
capillary. (C) Sketch of the tissue PO2 between two capillaries with different RBC PO2 values Pc,φ (red dot) and Pc,ψ (blue dot). The colored circles indicate the
locations of the capillaries φ and ψ. Solid line: continuous PO2 profile with adapted tissue radii rt,φ and rt,ψ ; dashed line: discontinuous PO2 profile under the
assumption of equal oxygen fluxes out of the capillaries.
Equation (23) can be rearranged as RBC velocities were still allowed to be different. Under the
assumption that vrbc is equal in both capillaries, the linearization
Pc,φ (x) − Pc,ψ (x) 1 2 2 of Peq around the average HS S = 21 (Sφ + Sψ ) yields the following
= KIV π − (rt,φ − rt,ψ ) (25)
M0 4Dt αt evolution equation for the saturation difference 1S = Sφ − Sψ
between both model capillaries:
1 2 rt,φ 2 rt,ψ
+ rt,φ ln − rt,ψ ln .
2Dt αt rw rw
d1S 1S dPeq
(26) QO2 (S) =− . (32)
dx KCI dS S
The assumption that
This third model will be referred to as linearized capillary
interaction model. This equation leads to the definition of the
rt,φ rt,ψ rt,mean
ln ≃ ln ≃ ln , (27) characteristic length scale LCI for diffusive interaction between
rw rw rw
parallel capillaries
q
where rt,mean = 12 (rt,φ
2 + r 2 ), yields an explicit expression for
t,ψ
dPeq
−1
the oxygen outflux LCI = KCI QO2 (S) . (33)
dS S
2 Pc,φ (x) − Pc,ψ (x)
jt,φ (x) = M0 π(rt,mean − rw2 ) + Similarly, the characteristic time scale τCI is defined as
r
2KIV + π D1t αt ln t,mean
rw − 21 !
−1
(28) LCI dPeq
τCI = = KCI µLD πrc2 C0 + πrp2 αeff . (34)
and a similar expression for jt,ψ (x). We now define the resistance vrbc dS S
coefficient KCI for diffusive interaction between capillaries as
Thus it is independent from the RBC velocity and depends
1 rt,mean 1 on linear density, the average HS S and the geometry. These
KCI = KIV + ln − . (29)
2πDt αt rw 2 characteristic quantities will be compared to fits obtained using
the computational model presented below.
2
By using the average oxygen outflux jt = M0 π(rt,mean − rw2 ), the
evolution equations for HS in both model capillaries become Computational Model
The results of the models for RBC and capillary diffusive
dSφ 1 interactions were compared with numerical solutions to
QO2 ,φ (Sφ ) = −jt − (Pc,φ (x) − Pc,ψ (x)) (30)
dx 2KCI the advection-diffusion-reaction equations for oxygen and
dSψ 1 hemoglobin. The reaction rates between both quantities are
QO2 ,ψ (Sψ ) = −jt − (Pc,ψ (x) − Pc,φ (x)). (31) coupled based on Clark et al. (1985) with
dx 2KCI
This model will be referred to as explicit Krogh-based model. P n
k− S − (1 − S) inside RBCs,
To derive this equation, the respective linear densities in both f (P, S) = P50 (35)
capillaries were assumed to be equal. However, the respective 0 outside RBCs,
Frontiers in Physiology | www.frontiersin.org 6 April 2018 | Volume 9 | Article 420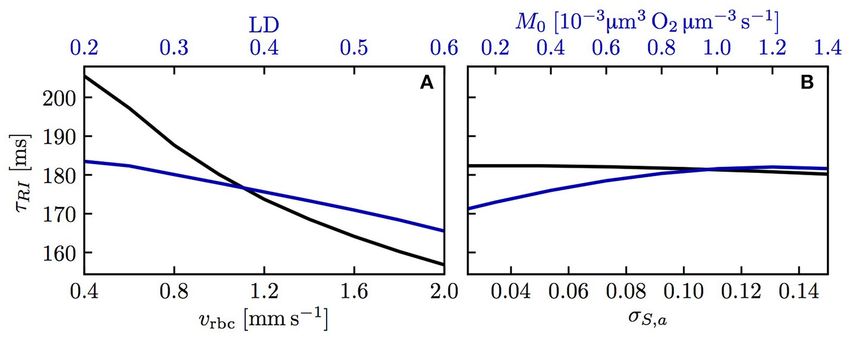
Lücker et al.                                                                                Hemoglobin Saturation Heterogeneity—Theoretical Models

where k− is the reaction rate. Metabolic oxygen consumption was           to rw = 2.5 µm. For this three-dimensional domain, a coarser
modeled using zero-th order kinetics as                                   grid spacing than in the two-dimensional cylinder was chosen.
                                                                         The grid cell size in the tissue away from the capillaries was set
                                      M0 inside tissue,                   to 1 µm. At ≤ 8 µm from the capillaries, the grid was refined by
                      M(P) =                                  (36)
                                      0 outside tissue.                   a factor two to better resolve the high oxygen gradients in and
                                                                          close to the capillaries. The grid cell size in the RBCs was set
This was chosen instead of the commonly used Michaelis-                   to 1xrbc = 0.25 µm and the time step to 1t = 1x/vrbc . Since
Menten kinetics to facilitate the comparison between the                  the HS difference 1Sv between the venous ends of the capillaries
interaction models and the computational model. The oxygen                is our main quantity of interest here, the grid spacing needs to
transport equation is given by                                            be sufficiently high to accurately resolve this quantity. A grid
                                                                          convergence study showed that doubling the spatial resolution
    ∂αP
        + v · ∇(αP) = ∇ · (Dα∇P) + C0 f (P, S) − M(P),        (37)        in each dimension and reducing the time step correspondingly
     ∂t                                                                   increases 1Sv by < 2.2%. Therefore, all simulations were run
where v is the plasma velocity. In RBCs, the evolution of HS              with the grid resolution described above, since it provides a
follows                                                                   good compromise between accuracy and run time (∼20 h per
                                                                          simulation on a single core). The coarser grid resolution in the
                 ∂S                                                       tissue was found not to affect the values of 1S.
                    + v · ∇S = ∇ · (DHb ∇S) − f (P, S),       (38)
                 ∂t                                                           The metabolic rate of oxygen consumption was set to
where DHb is the diffusion coefficient of hemoglobin in RBCs.             10−3 µm3 O2 µm−3 s−1 , which is within the range of values
   For simulations in a single capillary or parallel capillaries,         measured in the anesthetized rodent cerebral cortex (Zhu
these equations were solved using the finite-volume method with           et al., 2013), using a brain density of 1.05 g cm−3 and the
moving RBCs (Lücker et al., 2014).                                        ideal gas law at body temperature for the molar volume
                                                                          of oxygen (2.544 × 10⁴ ml O2 /(mol O2 )). The intravascular
Model Parameters                                                          resistance coefficient, which is used for the model coefficients KRI
The heterogeneity of HS was investigated in different                     and KCI (Equation 29), was determined using the formula KIV =
computational domains. The physiological parameters were                  0.5KIV,0.5 /µLD (Lücker et al., 2017), with the difference that
chosen to match the mouse cerebral cortex. The diffusive                  convective transport of dissolved oxygen content was included
interaction between RBCs was studied in a two-dimensional                 in Equation (10). For rc = 1.5 µm, the value of KIV,0.5
cylindrical domain with radius rt = 23 µm, which corresponds              was 5.15 mmHg µm s/(µm3 O2 ). In parameter studies, the RBC
to the distances between nuclei of neurons and capillaries                velocity will be varied between 0.4 and 2.0 mm/s and the linear
(Tsai et al., 2009). Unless stated otherwise, a domain length             density between 0.2 and 0.6. When these parameters are fixed,
L = 100 µm was chosen. This length is smaller than the average            vrbc will be set to 1.0 mm/s and µLD to 0.3. For rc = 1.5 µm, this
capillary path length of 343 µm measured by Sakadžić et al.              yields a RBC flow equal to vrbc µLD /Lrbc = 40.7 cells/s. These
(2014). The domain length influence will be addressed below.              values are typical for the rodent brain (Parpaleix et al., 2013;
Cylindrical RBCs with volume Vrbc = 59 µm3 and radius                     Lyons et al., 2016). The other physiological parameters are given
rc = 1.5 µm were employed. The capillary lumen diameter                   in Table 1.
was set to rp = 2.0 µm, which is typical in the rodent cerebral               Equations (37) and (38) were solved using a custom written
cortex (Tsai et al., 2009), and the endothelium thickness to              extension of the open-source computational fluid dynamics
0.6 µm (Bertossi et al., 1997), so that the endothelium radius was        library OpenFOAM 2.3.0 (Weller et al., 1998). The equations
rw = 2.6 µm. At the tissue boundary, the gradient of the PO2              were discretized as explained in Lücker et al. (2014).
field was set to zero. In this domain, the grid cell size was set
to 1x = 1y = 0.3 µm in the capillary. The radial grid spacing             RESULTS
in the tissue was smoothly increased to save computational
effort, so that 1y was four times higher at the tissue boundary           The evolution of HSH was simulated in the geometries shown
than in the capillary. The grid spacing in the RBC meshes was             in Figure 1A, 2A, and compared to the RBC and capillary
set to 1xrbc = 1yrbc = 0.1 µm. The time step size was set to              interaction models.
1t = 1x/vrbc . All simulations were ran until a statistical steady
state was reached.                                                        Diffusive Interaction Between RBCs
    The diffusive interaction between capillaries was investigated        The diffusive interaction between RBCs with different HS was
in an array with four parallel capillaries with radius rp = 2.0 µm.       investigated in a cylindrical tissue domain (Figure 1A). This
The symmetry of the domain allowed that only one quarter                  single-capillary setup with differently saturated RBCs aims to
of each capillary had to be simulated (Figure 2B). The normal             represent a capillary after a converging bifurcation where RBCs
PO2 gradient was set to zero at each boundary plane. A spacing            with different transit times are flowing in. The simplest model
of 40 µm between the capillaries was chosen, which yields an              for the inlet HS of RBCs is when erythrocytes alternatingly
averaged supplied tissue volume per capillary very close to that          take two fixed saturation values (one value per upstream
of a cylinder with radius rt = 23 µm. In these simulations, the           branch). Figure 3 shows the evolution of HS in a capillary
RBC radius was set to rc = 1.6 µm and the endothelium radius              with length L = 300 µm with inlet values S = 0.8 and

Frontiers in Physiology | www.frontiersin.org                         7                                            April 2018 | Volume 9 | Article 420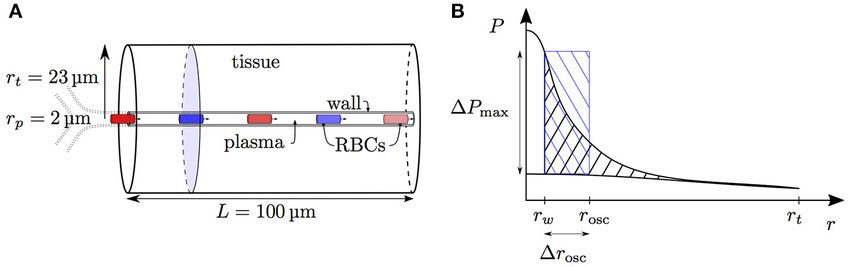
Lücker et al.                                                                                                   Hemoglobin Saturation Heterogeneity—Theoretical Models

TABLE 1 | Parameter values.

Parameter                 Description                                    Value                    Units                              References

αrbc                      O2 solubility in RBCs                          3.38 × 10⁻⁵              ml O2 mmHg−1 cm−3                  Altman and Dittmer, 1971
αp                        O2 solubility in the plasma                    2.82 × 10⁻⁵              ml O2 mmHg−1 cm−3                  Christoforides et al., 1969
αw                        O2 solubility in the capillary wall            3.89 × 10⁻⁵              ml O2 mmHg−1 cm−3                  αt
αt                        O2 solubility in the tissue                    3.89 × 10⁻⁵              ml O2 mmHg−1 cm−3                  Mahler et al., 1985
Drbc                      O2 diffusivity in RBCs                         9.5 × 10⁻⁶               cm2 s−1                            Clark et al., 1985
Dp                        O2 diffusivity in the plasma                   2.18 × 10⁻⁵              cm2 s−1                            Goldstick et al., 1976
Dw                        O2 diffusivity in the capillary wall           8.73 × 10⁻⁶              cm2 s−1                            Liu et al., 1994
Dt                        O2 diffusivity in the tissue                   2.41 × 10⁻⁵              cm2 s−1                            Bentley et al., 1993
DHb                       Hemoglobin diffusivity in RBCs                 1.44 × 10⁻⁷              cm2 s−1                            Clark et al., 1985
k−                        Dissociation rate constant                     44                       s−1                                Clark et al., 1985
n                         Hill exponent                                  2.64                     –                                  Fitted from Watanabe et al. (2008)
NHb                       Total heme density                             2.03 × 10⁻⁵              mol cm−3                           Clark et al., 1985
P50                       Po2 at hemoglobin half-saturation              47.9                     mmHg                               Fitted from Watanabe et al. (2008)
rp                        Radius of capillary lumen                      2.0                      µm                                 Tsai et al., 2009
Vmol,O2                   O2 molar volume at 36.9◦ C                     2.54 × 10⁴               ml O2 mol−1                        Ideal gas law
Vrbc                      RBC volume                                     59.0                     µm3                                Shirasawa, 2003

    FIGURE 3 | Hemoglobin saturation profiles with alternating inlet values in the cylindrical geometry. µLD = 0.3; vrbc = 1.0 mm/s. Solid lines: numerical simulation;
    dash-dotted lines: RBC interaction model; dotted line: linearized RBC interaction model; pale dotted lines: assumption of equal oxygen flux out of the RBCs. (A) HS
    profile of heterogeneously saturated RBCs (thin line: average). (B) Standard deviation profile of S.

0.6. The standard deviation σS,v of the HS from the numerical                              of 100 µm (Sa = 0.6 and 0.4) and 300 µm (Sa = 0.8 and 0.6,
model at the venous end is approximately seven times lower                                 respectively). The fitted value of KRI in the short domain was
than at the inlet. The values of σS from the RBC interaction                               only 4.6% lower than in the long domain. Therefore, the domain
model is almost indistinguishable from the numerical results                               length does not have a major influence on the results and from
(Figure 3B) when the model coefficient KRI is fitted to match                              now on we will use L = 100 µm. In the mouse cerebral cortex,
the standard deviation from the computational model (here,                                 an average capillary path length of 343 µm was measured by
KRI = 11.1 mmHg µm s/(µm3 O2 )). The coefficient was fitted to                             Sakadžić et al. (2014). The similar values of KRI with L = 100 µm
                             RL
minimize the model error 0 kσS,model (x) − σS,simul (x)k22 dx. The                         and 300 µm show that it is not necessary to simulate whole
linearized RBC diffusive interaction model with the same value of                          capillary paths to estimate the model coefficient KRI , which in
KRI also agrees very well with the numerical results, although it                          turn determines LRI and τRI . Additionally, a uniform random
very slightly underestimates σS . The simulated values of σS were                          distribution of HS at the inflow of a 2 × 2 parallel capillary
also fitted with a single exponential function of the form f (x) =                         array yields very similar results (Figure S1). To investigate the
a exp(x/LRI ). Since this fit is also very good, our results can be                        dependence on the considered organ, a simulation was run
expressed in terms of the characteristic decay length LRI and the                          with parameters for the working hamster retractor muscle as
related decay time τRI = LRI /vrbc . These first results suggest                           in Eggleton et al. (2000). The resulting evolution of HSH is
that HSH can be considerably reduced by diffusive interaction                              qualitatively the same as with physiological parameters for the
between RBCs within a single capillary.                                                    mouse cerebral cortex (Figure S2). This shows model robustness
   To reduce the computational effort in further parameter                                 with respect to the inflow value of S, the boundary condition for
studies, we compared the results obtained with domain lengths                              tissue PO2 and the considered organ.

Frontiers in Physiology | www.frontiersin.org                                          8                                                  April 2018 | Volume 9 | Article 420
Lücker et al. Hemoglobin Saturation Heterogeneity—Theoretical Models
We now examine the influence of model parameters such as between both capillary pairs drops by ∼ 50% over 100 µm.
linear density, RBC velocity, oxygen consumption rate and HS This decrease is captured well by each interaction model, albeit
difference at the inlet on the results. Figure S3 shows that the slightly underestimated by the explicit Krogh-based model and
RBC interaction models with fitted KRI perform very well across the linearized model. Figure 6 also illustrates that the assumption
a wide range of parameters. The relative model error in σS,v of equal oxygen outfluxes cannot be used in the present context.
normalized by the standard deviation drop from the numerical As above, the underestimation of S by the interaction models
model σS,a − σS,v is ≤ 2% for the initial model and ≤ 4% for the away from the domain ends is caused by the absence of axial
linearized model across the whole parameter range. Additionally, diffusion (Lücker et al., 2017). These first results suggest a strong
the exponential fit to the numerical results also matches very reduction of HSH between parallel capillaries.
well the numerical results (< 2% error), which confirms that the To show model robustness, several input parameters were
decay length LRI and decay time τRI introduced above can used to varied and the predicted drop in HS difference 1Sa − 1Sv was
compare results. The decay time τRI decreases from 206 to 157 ms compared to numerical simulation results. The spacing between
when vrbc increases from 0.4 to 2.0 mm/s, but is rather insensitive capillaries, the oxygen consumption rate, the RBC velocity and
to the linear density (10.2% decrease when µLD increases from linear density were investigated (Figure S4). In almost all cases,
0.2 to 0.6, Figure 4). The oxygen consumption rate has an even the nonlinear Krogh-based model shows the best agreement
smaller influence on τRI (6.3% variation), while the inlet standard with numerical results (relative error ≤ 4% except at very low
deviation of HS almost does not affect it (1.2% variation). oxygen consumption rates). The explicit Krogh-based model and
The above results show that the RBC interaction models agree the linearized model perform almost equally well, with relative
closely with numerical simulations when using fitted values of errors ≤ 8%. Similarly, simulations with physiological parameters
KRI . To show the models’ predictive power, it is necessary to for the working hamster retractor muscle yield results that are
characterize this model coefficient which was decomposed as very similar to those with parameters for the mouse cerebral
KIV +KOS , where KOS was related to the spreading distance of PO2 cortex (Figure S5). These parameter studies show that capillary
oscillations in the tissue due to individual passing erythrocytes. diffusive interaction models perform well over a large range of
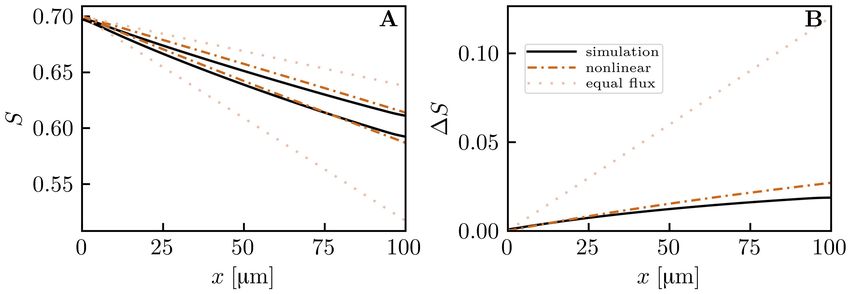
Figure 5A shows the dependence of KOS on linear density and physiological parameters.
RBC velocity. The plot of 1rosc against KOS for all the simulated The capillary interaction models rely on a single model
values of linear density and RBC velocity (Figure 5B) shows parameter KCI defined in Equation (29). Unlike the coefficient
a strong correlation between these two quantities (Pearson’s KRI for RBC diffusive interaction, the expression for KCI only
correlation coefficient r = 0.989). Therefore, consistently with depends on the intravascular resistance coefficient KIV which can
our initial assumption (Equation 14), the model coefficient for be determined based on numerical simulations (Lücker et al.,
RBC diffusive interaction is closely related to the PO2 oscillations 2017). Therefore, given a suitable value of KIV and mean HS S,
in the tissue. the decay length and time scales LCI and τCI (Equations (33)
and (34), respectively) can be computed analytically. Figure 7A
shows values of τCI for a range of linear densities and mean
Diffusive Interaction Between Parallel HS values. The decay time scale increases with linear density
Capillaries and attains its highest values at S ≃ 0.3, where dPeq /dS
The capillary diffusive interaction models are now compared attains its minimum with the employed parameters for the Hill
to our computational model for oxygen transport. Numerical equation (Equation 2). Similarly to RBC diffusive interaction,
simulations were run in an array of four straight, parallel the simulated values of 1S are very well fitted by exponential
capillaries (Figure 2A). In the two pairs of diagonally opposed decays. Figure 7B,C show a comparison of the analytical and the
capillaries, two different inlet values of HS Sa,φ , Sa,ψ were chosen. fitted decay time scale τCI for different values of capillary spacing,
The evolution of Sφ , Sψ and the HS difference 1S = |Sφ − oxygen consumption rate, RBC velocity and linear density. For
Sψ | were computed with the numerical model and compared the analytical time scale, the simulated value of S at x = L/2
to predictions from the three interaction models for the oxygen was employed. Over the investigated range of parameters, the
flux out of the capillaries (nonlinear Krogh-based model, explicit analytical estimates of τCI overestimate the fitted values by at
model and linearized model for 1S). Additionally, theoretical most 12 ms (relative error of ≤ 7.2%). This shows that the
results based on the assumption of equal oxygen outflux will be variations in τCI that occur in the investigated parameter range
shown to highlight the effects of capillary diffusive interaction. can be entirely explained by the dependency of the analytical τCI
Unless otherwise stated, the average value of Sa over all capillaries on µLD and S. The decay length scale LCI is equally well predicted
was 0.7 and the capillaries were 40 µm apart. The linear density by the analytical formulation. Besides, the interaction models
and the erythrocyte velocity were set to 0.3 and 1.0 mm/s, have so far employed the Hill equation (Equation 2) to model the
respectively. equilibrium curve between oxygen and hemoglobin. To examine
Figure 6 shows HS profiles along both capillary pairs from model robustness, we computed the decay time scale τCI using
the numerical model and the interaction models. The mean the Adair equation (Popel, 1989) which is more accurate for
HS from the models matches very well the simulated results, S ≤ 0.3. The resulting values of τCI are at most 10% smaller
which shows that mass conservation is fulfilled (the nonlinear at low HS, so the inaccuracy introduced by the Hill equation
and explicit Krogh-based models yield the same mean S, hence stays moderate (Figure S6). The structure of the microcirculation
only the former is shown). In this setup, the HS difference in the brain is heterogeneous, and estimates of several relevant
Frontiers in Physiology | www.frontiersin.org 9 April 2018 | Volume 9 | Article 420Lücker et al. Hemoglobin Saturation Heterogeneity—Theoretical Models FIGURE 4 | Decay time scale τRI for RBC diffusive interaction. The time scale τRI was obtained with an exponential fit of the standard deviation of HS from simulations across a range of parameters. (A) Linear density and RBC velocity; (B) oxygen consumption rate and standard deviation of HS at the inlet. FIGURE 5 | Model coefficient KOS for RBC diffusive interaction. (A) KOS in mmHg µm s/(µm3 O2 ) as a function of linear density and RBC velocity. (B) KOS as a function of the integral spreading distance of PO2 oscillations defined in Equation (21); solid line: linear fit with slope 1.49 and intercept −3.58. FIGURE 6 | Hemoglobin saturation profiles in parallel capillaries. µLD = 0.3; vrbc = 1.0 mm/s. Solid lines: numerical simulation; dash-dotted lines: nonlinear Krogh-based model; dashed lines: explicit Krogh-based model; dotted line: linearized model for 1S; pale dotted lines: equal outflux assumption. (A) HS profile in both model capillaries. (B) HS difference between both capillaries. parameters such as blood flow rate, capillary spacing and oxygen The previous results all assumed the same RBC velocity, flow consumption rate are subject to uncertainties of considerably direction and hematocrit in each capillary. These assumptions more than 10%. Therefore, the quantitative errors introduced by are now dropped to further examine model robustness. First, the use of the Hill equation are not significant with regard to the simulations with countercurrent flow instead of concurrent flow analysis of oxygen transport in vivo. The main conclusion of this were run. Namely, the flows in both pairs of diagonally opposite study, namely that diffusive interaction between capillaries can capillary were set to opposite directions with the same RBC significantly reduce COSH, is not affected by the assumption of velocity. The HS difference between the venous capillary ends the Hill equation. turned out to be practically the same as with concurrent flow Frontiers in Physiology | www.frontiersin.org 10 April 2018 | Volume 9 | Article 420
Lücker et al.                                                                                                    Hemoglobin Saturation Heterogeneity—Theoretical Models

 FIGURE 7 | Decay time scale τCI for capillary diffusive interaction. (A) Theoretical decay time scale for capillary diffusive interaction. The contour values were obtained
 with Equation (34) for a capillary spacing of 40 µm (rt,mean = 22.6 µm, rc = 1.6 µm, rp = 2.0 µm, rw = 2.5 µm). (B,C) Decay time scale τCI of the HS difference between
 parallel capillaries across a range of parameters: linear density, RBC velocity (B), capillary spacing and metabolic consumption rate of oxygen (C). Solid lines:
 exponential fit to the simulated 1S; dashed lines: theoretical value obtained with Equation (34) and the same parameters as in (A).

(Figure S7). Then, actual CTH was introduced by setting different                         each RBC will on average travel through several converging
RBC velocities in the pairs of diagonally opposite capillaries                            bifurcations. According to the interaction models developed
(Figure 8). Similarly, different values of linear density were set                        here and the numerical simulations, the standard deviation
in these capillary pairs (Figure 9). The RBC flow was also varied                         of HS decays exponentially (Equation 19) with a time scale
by modifying both RBC velocity and linear density (Figure S8).                            between 0.15 and 0.21 s (Figure 4). This is slightly below the
In all cases, the simulated distal HS difference was considerably                         diffusion time scale given by rt2 /Dt = 0.22 s. The time
lower than under the assumption of equal fluxes. When linear                              scale τRI was also shown not to depend on the length of the
density is heterogeneous, diffusive interaction leads to a stronger                       computational domain. Therefore, the RBC interaction time
reduction of HSH (84.4% in Figure 9) than in the presence of                              scale is not directly affected by the RBC transit time through
heterogeneous RBC velocities (41.8% in Figure 8). When the                                the computational domain (although it depends on the RBC
RBC flow is varied by modifying both of these parameters, the                             velocity). However, τRI can be compared to experimentally
resulting reduction of HSH (64.5% in Figure S8) falls between                             measured transit times to examine whether RBC diffusive
the values obtained above. However, the differential equation                             interaction has enough time to occur while RBCs flow through
models were more inaccurate in these cases and significantly                              capillaries. The obtained values of τRI are considerably lower
overestimated the distal HS difference. Although the interaction                          than mean capillary transit times measured using bolus tracking
models are not as accurate as before with heterogeneous                                   (Gutiérrez-Jiménez et al., 2016) (0.81 ± 0.27 s at baseline, 0.69 ±
RBC velocities and linear densities, our conclusions about the                            0.18 s during activation). These obtained time scales are also
reduction of HSH still hold in the presence of CTH or hematocrit                          smaller than the transit times computed by Schmid et al.
heterogeneity.                                                                            (2017) in five analysis layers at different depths in the mouse
                                                                                          parietal cortex (0.19 to 0.79 s). Therefore, in the presence of
DISCUSSION                                                                                converging bifurcations, this analysis indicates that RBCs spend
                                                                                          sufficient time in capillary branches for the HSH to significantly
We identified two diffusive interaction mechanisms that cause                             drop.
a large reduction of HSH in capillary networks, developed                                     While the standard deviation of HS in a single capillary
associated interaction models and validated them using a                                  generally decreases, our results show that the average value of
computational model with individual moving RBCs. The                                      S in a single capillary is not affected by fluctuations of S. Since
interaction models provide explicit formulas for the reduction                            the PO2 oscillations caused by the individual erythrocytes do not
of HSH and the associated decay exponents, which gives more                               spread far into the tissue (see values of 1rosc in Figure 5B), tissue
insight than a purely computational approach. This work shows                             oxygenation is likely not adversely affected by the fluctuations
that CTH only partially reflects the actual heterogeneity of blood                        in HS observed here. This provides a justification for the
oxygen content and that estimating HSH solely based on CTH                                oxygen transport models based on a continuum approach for
may lead to considerable overestimation.                                                  S (Goldman and Popel, 1999; Secomb et al., 2000), if the HS
   Diffusive interaction between RBCs in a single capillary                               downstream of a converging bifurcation is set to the RBC-flow-
occurs when two branches with different HS levels converge.                               weighted average of S in the upstream branches. Nevertheless, we
This phenomenon is therefore more prevalent in the presence                               postulate that the homogenization of S in individual vessels is
of multiple converging bifurcations along RBC paths. In the                               beneficial for oxygen transport, since it reduces the probability
mouse cerebral cortex, Sakadžić et al. (2014) estimated the                              of RBCs with very low saturation. Indeed, hypoxia as well
number of capillary branches between arterioles and venules                               as large tissue PO2 fluctuations are most likely to occur near
to be 5.9 ± 2.1, with mean segment lengths between 65.6                                   vessels with low RBC flow. The homogenization of HS makes
and 81.4 µm. Since cortical capillary beds have a mesh-like                               it less probable that RBCs with low oxygen content enter such
structure (Lorthois and Cassot, 2010; Blinder et al., 2013),                              vessels.

Frontiers in Physiology | www.frontiersin.org                                        11                                                   April 2018 | Volume 9 | Article 420
Lücker et al. Hemoglobin Saturation Heterogeneity—Theoretical Models FIGURE 8 | Capillary diffusive interaction with different RBC velocities (vrbc = 1.5 and 0.5 mm/s). Solid lines: numerical model; dash-dotted lines: nonlinear Krogh-based model; dashed lines: explicit Krogh-based model; dotted lines: equal oxygen flux assumption. (A) HS profiles; (B) HS difference between both capillary pairs. The simulated final HS difference 1Sv with vrbc = 1.5 mm/s and 0.5 mm/s, respectively, is 41.8% lower than if the oxygen fluxes out of the capillaries are assumed to be equal. The overestimation of 1Sv by the nonlinear and explicit Krogh-based models is 18.8 and 15.8%, respectively. For smaller differences in vrbc , the model errors are in the same range. FIGURE 9 | Capillary diffusive interaction with different linear densities (µLD = 0.6 and 0.2). Solid lines: numerical model; dash-dotted lines: nonlinear Krogh-based model; dotted lines: equal oxygen flux assumption. (A) HS profiles; (B) HS difference between both capillary pairs. The simulated distal HS difference is 84.4% lower than under the assumption of equal oxygen fluxes. The nonlinear Krogh-based model overestimates 1Sv by 44.4%. Diffusive interaction between capillaries is the second tissue volume closest to each capillary segment by a cylinder. reduction mechanism of HSH that was investigated here. In our simulations, although the intercapillary distance was While RBC diffusive interaction primarily occurs downstream tripled, the decay time of the HS difference between parallel of converging bifurcations, capillary diffusive interaction is capillaries only increased from 0.115 to 0.188 s. This weak a more general phenomenon since it does not require the dependence on capillary spacing is explained by the formulas for presence of branchings. Our results qualitatively agree with the the decay time scale τCI (Equation 34) and the model coefficient computations by Popel et al. (1986) in parallel capillary arrays KCI (Equation 29) which only depend on the logarithm of with heterogeneous inlet PO2 and erythrocyte velocities. Salathe the ratio between the mean Krogh radius and the capillary (2003) performed similar computations in a 5 × 5 capillary endothelium radius. These time scale values are lower than array and reported that modeling interaction between functional the decay time scale τRI for RBC diffusive interaction and also units smooths out the oxygen concentration differences between significantly smaller than the capillary transit times reported capillaries and delays the onset of anoxia. Our results confirm above. Additionally, our theoretical analysis showed that the the trends observed in these studies and shed further light HS difference between parallel capillaries decays exponentially on the physiological parameters involved in capillary diffusive (Equation 32). This provides compelling evidence that diffusive interaction. interaction between capillaries is a strong mechanism for the The range of distances between capillaries (20 to 60 µm) reduction of HSH at the scale of neighboring capillaries. Its that was examined in our simulations in parallel capillary occurrence regardless of the presence of converging bifurcations arrays corresponds to Krogh cylinder radii between 11.3 and suggests that this is a more general phenomenon than RBC 33.8 µm. This includes the mean Krogh radii of the reconstructed diffusive interaction. Finally, unlike the latter mechanism, MVNs in Fraser et al. (2013) (21.3 ± 2.1 µm to 25.6 ± capillary diffusive interaction strongly influences the mean HS 3.9 µm) and in Sakadžić et al. (2014) (22.3 ± 1.2 µm to drop along microvessels and thus affects more significantly tissue 24.2 ± 2.2 µm) which were obtained by approximating the oxygenation. Frontiers in Physiology | www.frontiersin.org 12 April 2018 | Volume 9 | Article 420
You can also read