The risk of indoor sports and culture events for the transmission of COVID-19 - Nature
←
→
Page content transcription
If your browser does not render page correctly, please read the page content below
ARTICLE
                  https://doi.org/10.1038/s41467-021-25317-9                 OPEN

                  The risk of indoor sports and culture events
                  for the transmission of COVID-19
                  Stefan Moritz 1,5 ✉, Cornelia Gottschick 2,5, Johannes Horn2, Mario Popp1, Susan Langer2, Bianca Klee2,
                  Oliver Purschke2, Michael Gekle3, Angelika Ihling1, Frank D. L. Zimmermann 4 & Rafael Mikolajczyk2 ✉
1234567890():,;

                  Nearly all mass gathering events worldwide were banned at the beginning of the COVID-19
                  pandemic, as they were suspected of presenting a considerable risk for the transmission of
                  SARS-CoV-2. We investigated the risk of transmitting SARS-CoV-2 by droplets and aerosols
                  during an experimental indoor mass gathering event under three different hygiene practices,
                  and used the data in a simulation study to estimate the resulting burden of disease under
                  conditions of controlled epidemics. Our results show that the mean number of measured
                  direct contacts per visitor was nine persons and this can be reduced substantially by
                  appropriate hygiene practices. A comparison of two versions of ventilation with different air
                  exchange rates and different airflows found that the system which performed worst allowed a
                  ten-fold increase in the number of individuals exposed to infectious aerosols. The overall
                  burden of infections resulting from indoor mass gatherings depends largely on the quality of
                  the ventilation system and the hygiene practices. Presuming an effective ventilation system,
                  indoor mass gathering events with suitable hygiene practices have a very small, if any, effect
                  on epidemic spread.

                  1 Section of Clinical Infectious Diseases, University Hospital Halle (Saale), Halle, Germany. 2 Institute for Medical Epidemiology, Biometry and Informatics,

                  PZG, Martin-Luther-University Halle-Wittenberg, Halle (Saale), Germany. 3 Julius Bernstein-Institute of Physiology, Faculty of Medicine, Martin Luther-
                  University Halle-Wittenberg, Halle (Saale), Germany. 4 Zimmermann and Becker GmbH, Consulting Engineers, Dieselstr. 11, Flein, Germany. 5These authors
                  contributed equally: Stefan Moritz, Cornelia Gottschick ✉email: Stefan.moritz@uk-halle.de; Rafael.mikolajczyk@uk-halle.de

                  NATURE COMMUNICATIONS | (2021)12:5096 | https://doi.org/10.1038/s41467-021-25317-9 | www.nature.com/naturecommunications                                   1
ARTICLE NATURE COMMUNICATIONS | https://doi.org/10.1038/s41467-021-25317-9
I
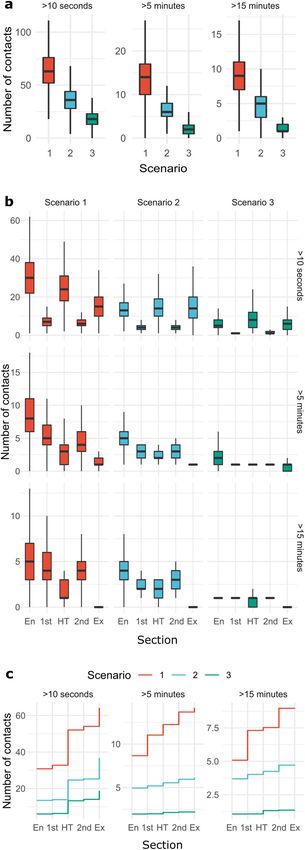
n the course of the COVID-19 pandemic, banning mass The hygiene practices in Scenarios 2 and 3 resulted in a strong
gathering events (MGE) was one of the first countermeasures reduction in contacts of any duration. In Scenario 1, new contacts
undertaken by the governments of most countries1. In Ger- lasting longer than 5 min were created throughout the event,
many, early in March 2020, the government issued a general ban while in Scenarios 2 and 3 most contacts occurred during the
of MGE with more than 1000 people2. With a turnover of 129 entry phase, without further major increase (Fig. 1c). Overall, no
billion Euro in 2019, the event sector is the sixth largest economic effect of gender or age was observed regarding the number of
sector in Germany, and up to 1.5 million people depend on this contacts during the event (Supplementary Fig. 1).
industry3. Insolvencies in this field will not only have an eco-
nomic impact, but may also result in the loss of creative skills,
Simulation of aerosol exposure. In addition to the number of
training infrastructure and a lack of upcoming young artists and
contacts measured by CTD, the aerosol distribution in the
athletes. The impact of this loss is not restricted to individuals,
respiratory air of all 4000 virtual participants was simulated using
but affects an important dimension of society as a whole.
a computational fluid dynamics (CFD) model, considering two
Severe acute respiratory syndrome coronavirus 2 (SARS-CoV-
different ventilation versions (VV). Ventilation Version 1 (VV1)
2), causing COVID-19, can be transmitted via droplets, aerosols
represented the current ventilation system in the arena. Here, the
or through contaminated surfaces4–8. While the debate on rele-
inlet air is blown in laterally on the east- and west side by jet
vance of various transmission routes for the spread of COVID-19
nozzles (Supplementary Movie 1). Air supply was also issued
is still ongoing9–11, it is clear that physical proximity and hygiene
under the seats of the grandstands through swirl diffusers, and
determine transmission. Reported or measured personal contacts
below the mobile grandstands through ventilation grilles. The
can be used to assess droplet based transmission. There are sev-
exhaust air was discharged in the corners of the arena by exhaust
eral additional factors of importance for studying aerosols. The
towers. Air exchange per hour (ACH) was 1.46 h−1, with a make-
type of activity and the resulting ex- and inhalation of emitters
up air of 50 m3 h−1-person. The make-up air is defined as the
and recipients, as well as the airflow in the area around the
amount of air provided to a person in a room in one hour. To
recipients, must be taken into account12–14.
avoid large eddies (Supplementary Fig. 2a), which generate the
To investigate the transmission risk of SARS-CoV-2 through
intensified spread of aerosols at face level, jet nozzles and exhaust
droplets and aerosols during experimental indoor MGE, we
towers were turned off in Ventilation Version 2 (VV2) and the
conducted an experimental pop concert with three different
exhaust towers were replaced by exhaust pipes located under the
hygiene practices, and measured the contacts of each spectator
roof, resulting in an ACH of 0.85 h−1. This solution was chosen
during the event using contact tracing devices (CTDs). We
because its implementation would be cost-efficient, and in the
developed a computer model of the arena indoor space and
hope that a displacement flow in the direction of the roof would
simulated infectious aerosol distribution and the resulting expo-
be created by buoyancy induced flow. Unfortunately, the buoy-
sure of healthy subjects. Finally, we combined information on
ancy induced flow was too weak due to the low occupancy and
contacts during the event and exposure to aerosols with an
interfering air supply nearby the grandstands. Stationary eddies
individual based model to estimate the excess burden of epidemic
also emerged above the grandstands (Supplementary Fig. 2b). In
caused by indoor MGE. We incorporated various parameters,
the VV1 ventilation strategy, 24 infectious persons placed in the
including the effects of different hygiene practices, wearing
arena resulted in 85 individuals exposed to infectious aerosols,
masks, event sizes, ventilation systems, and different baseline
and the number for ventilation strategy VV2 was substantially
incidences in our model. We derived recommendations from this
higher (612 persons, Table 1). The overall mean exposure
data regarding MGE during a pandemic.
increased from 3.54 (VV1) to 25.50 exposed individuals (VV2),
also resulting in a seven-fold increase in total. The mean exposure
in the stalls was 6.75 (VV1) compared to 24.25 (VV2), resulting
Results
in an almost four-fold increase in exposed individuals. In the
Contact measurements at the experimental mass gathering
mobile grandstands, the mean exposure increased from 10.25
event. We conducted an experimental pop concert on August
(VV1) to 59.75 (VV2), resulting in a six-fold increase. In the solid
22nd 2020, with a total of 1212 individuals in the Leipzig Arena
grandstands, the mean exposure changed from 4.25 (VV1) to 69.0
(Supplementary Table 1). All participants and involved staff
(VV2). Here, the increase was highest (16-fold), compared to the
demonstrated a negative test result for SARS-CoV-2, performed
other areas (Table 1, Supplementary Fig. 3). Supplementary Fig. 4
48 h before the event. All people involved wore N95 masks during
shows the aerosol concentration displayed as isosurfaces around
the event. Three different scenarios were investigated: 1) No
the infectious individuals. The isosurfaces show the same trans-
restrictions (the pre-pandemic setting), 2) moderate restrictions
mission mechanism for both VV1 and VV2, irrespective of the
(checkerboard pattern seating, twice as many entrances as in 1),
position: direct aerosol flow from the mouth of the transmitting
3) strong restrictions (pairwise seating with 1.5 m interspace to
individual to the mouth of the recipient. Differences in the
the next pair, four times as many entrances as in 1). Each scenario
number of infected individuals between the two ventilation var-
had the same schedule: first half, half time including simulated
iants can be explained by the lower air exchange per hour (ACH)
catering, second half, and exit. Contacts within a radius of 1.5 m
of 0.85 h−1, as well as less air movement (and therefore slower
were measured with a CTD.
mixing of the air) in VV2.
There was a high overall number of contacts when all contacts
The estimated mean number of exposed people per one
over 10 s were counted. When considering only critical contacts
infectious person was 3.5 (±2.9 standard deviation (SD)) in VV1,
with a duration of more than 15 min (based on the standard
and 25.5 (±27.8 SD) in VV2 for Scenario 1, with a maximum of
definition for contact tracing15) the number of contacts
10 and 108 exposed persons respectively (Supplementary Fig. 5).
decreased below 10 (Fig. 1a, Supplementary Table 2). In each
Hygiene practices reduced the mean number of exposed visitors
scenario a high number of contacts was observed during entry,
in both VV1 and VV2, to 1.9 (±1.5 SD) and 11.8 (±13.5 SD) for
half time and exit. Few of these contacts lasted more than 15 min
Scenario 2 and to 0.7 (±1.0 SD) and 5.3 (±6.4 SD) for Scenario 3.
during entry and half time (Fig. 1b). No contacts over 15 min
were recorded in any of the scenarios in the exit phase. Few
contacts were observed during the two halves, but nearly all Effect of mass gathering events on SARS-CoV-2 positive cases
lasted longer than 15 min. in the population. In order to assess transmissions in indoor
2 NATURE COMMUNICATIONS | (2021)12:5096 | https://doi.org/10.1038/s41467-021-25317-9 | www.nature.com/naturecommunicationsNATURE COMMUNICATIONS | https://doi.org/10.1038/s41467-021-25317-9 ARTICLE
Fig. 1 Number of contacts in Scenario 1 (red), 2 (blue), and 3 (green). a
Number of contacts by duration (>10 s, >5 min, >15 min) over all settings, b
for the different sections: Entry (En), 1st half (1st), half time (HT), 2nd half
(2nd), exit (Ex) and c cumulatively throughout the different settings. The
center line represents the median, the box limits the upper and lower
quartiles and whiskers extend from the hinge to the smallest/largest value
no further than 1.5 * IQR from the hinge. nScenario 1 = 1192 participants,
nScenario 2 = 1158 participants, nScenario 3 = 1054 participants. See
Supplementary Table 3 for components of the hygiene practices in the
three different scenarios.
consequence incidence is independent of the local transmission
dynamics represented by the reproduction number. In line with
findings from serological studies, we assumed seroprevalence to
be still negligible, making most people susceptible to
infection16–20.
For certain predefined incidences (based on diagnosed cases),
we simulated the number of infectious persons attending the
MGE. Per definition, these persons were not diagnosed yet, and
displayed no symptoms at the time of the MGE—otherwise they
would not attend the event. Similarly, quarantined persons are
excluded, and (asymptomatic) cases identified by contact tracing
could not attend the event. Conversely, undetected asymptomatic,
pre-symptomatic and some fraction of mildly symptomatic
persons could attend the event. Some of these persons would
remain undiagnosed and contribute to the dark figure of cases.
The testing strategy and control measures resulted in a controlled
epidemic, in which about 50% of the infected were detected
during the course of infection. The number of infectious MGE
participants was obtained from the agent-based model accounting
for these aspects.
Depending on the incidence (i.e. 10, 50, or 100 positive tested
cases per 100,000 population per week), on average 7.8, 37.8, or
75 infectious persons might attend any event, assuming the total
number of persons taking part in MGE is 200,000 per month
(corresponding to the number of participants in MGE in Leipzig
in pre-pandemic times, Supplementary Fig. 6). We assumed a
transmission probability of about 7% per contact of 15+ min
duration based on German POLYMOD data21, and a reproduc-
tion number of around 1 without any contact restrictions. The
resulting additional average numbers of persons who would
become infected and would be detected (excess cases) ranges from
5.1 under the strictest hygiene practice and best ventilation
(Scenario 3, VV1) to 22.0 with no hygiene practice and non-
optimal ventilation (Scenario 1, VV2) in the low incidence
scenario (10 per 100,000 per week) and with spectators wearing
masks (Table 2). An increased incidence of 100/100,000/week
results in 11.7 and 196.8 persons likely to acquire an infection
during an MGE for the same conditions. Not wearing masks
further increases these numbers (Supplementary Data 1). One
hospitalization and possible death due to MGE could occur at an
incidence of 50/100,000/week, assuming bad ventilation (Supple-
mentary Data 1). At an incidence of 100/100,000/week,
hospitalized cases and deaths could occur in both VVs. The
number of cases are respectively lower for MGE with an overall
size of 100,000 participants per month, and higher for MGE
without mask wearing (Supplementary Data 1). For MGE with
MGEs, we developed a dedicated individual-based model. We 200,000 participants, there is a 23.6%, 10.8%, and 4.5% increase of
investigated the effects of MGE in epidemics controlled through positive cases attributed to MGE for Scenarios 1, 2, and 3 without
the overall reduction of contacts within society and contact tra- the use of masks in VV2, which decreases to 4.8%, 2.8%, and 1.2%
cing of SARS-CoV-2 positive individuals, mimicking a situation with masks and better ventilation (VV1) in the high incidence
in Germany during summer 2020 with a reproduction number setting (100 per 100,000 per week, Table 3). These numbers can
~1. We allowed the introduction of new cases (i.e. by persons again be reduced, assuming smaller event sizes (Supplementary
visiting from regions with a higher incidence), and in Data 2). This highlights the importance of adequate ventilation
NATURE COMMUNICATIONS | (2021)12:5096 | https://doi.org/10.1038/s41467-021-25317-9 | www.nature.com/naturecommunications 3ARTICLE NATURE COMMUNICATIONS | https://doi.org/10.1038/s41467-021-25317-9
Table 1 Differences in overall and mean exposure to infectious aerosols in ventilation version 1 (VV1) and ventilation version 2
(VV2) for Sscenario 1.
Infectious VV1 VV2
Exposed Mean [Exposed] Exposed Mean [Exposed]
Stalls
P1 2 8 6.75 24 24.25
P2 2 13 33
P7 2 2 13
P8 2 4 27
Mobile Grandstands
WM2 3 15 10.25 89 59.75
WM5 3 9 40
OM2 3 8 50
OM5 3 9 60
Solid Grandstands
WF2 1 5 4.25 55 69.00
WF5 1 9 45
OF2 1 2 68
OF5 1 1 108
Sum 24 85 612
Mean Exposed Total 3.54 25.50
P1, P2, P7, P8—Locations of infectious individuals in the stalls; WM2, WM5, OM2, OM5—Location of infectious individuals in the mobile grandstands; WF2, WF5, OF2, OF5—Location of infectious
individuals in the solid grandstands. Infectious: number of infectious individuals, exposed: number of exposed individuals. WF: upper west grandstand; WM: lower west grandstand; OF: upper east
grandstand; OM: lower east grandstand; P: floor. See Supplementary Fig. 8 for a map of the arena.
Table 2 Simulated mean excess numbers caused by mass gathering events (MGE).
IN S PC AC LC SC H Q
Ventilation Version 1
10 1 11.5 [-110.4; 129.2] 1.9 [-20.0; 26.0] 7.8 [-82.0; 94.2] 1.7 [-19.0; 21.0] 0.3 [-6.0; 6.0] 19.5 [-222.2; 279.2]
2 8.5 [-100.4; 120.2] 1.3 [-20.0; 24.0] 6.0 [-78.2; 91.2] 1.2 [-18.0; 21.0] 0.2 [-6.0; 6.0] 14.4 [-214.4; 258.2]
3 5.1 [-107.2; 115.0] 1.1 [-20.2; 26.0] 3.4 [-81.2; 86.2] 0.6 [-19.0; 21.0] 0.0 [-6.0; 6.0] 8.7 [-233.0; 252.4]
50 1 33.8 [-203.2; 277.2] 6.9 [-43.2; 56.2] 20.8 [-151.6; 197.0] 6.1 [-33.0; 47.0] 1.0 [-12.2; 14.0] 50.4 [-440.2; 600.0]
2 21.8 [-221.2; 272.4] 4.7 [-44.0; 57.0] 13.6 [-163.0; 189.0] 3.6 [-38.2; 47.0] 0.8 [-12.0; 14.0] 33.8 [-456.0; 543.8]
3 1.9 [-251.4; 253.4] 1.0 [-48.2; 50.0] 0.3 [-185.2; 181.6] 0.6 [-47.2; 43.0] -0.1 [-13.0; 13.0] 2.1 [-531.2; 533.4]
100 1 71.4 [-258.6; 422.0] 11.3 [-57.0; 81.2] 46.9 [-194.4; 306.0] 13.1 [-45.2; 71.0] 2.5 [-16.0; 20.0] 124.3 [-632.6; 837.2]
2 37.3 [-301.6; 409.0] 5.9 [-60.2; 70.2] 24.2 [-230.4; 287.4] 7.2 [-53.0; 65.2] 1.2 [-17.0; 20.0] 50.6 [-718.0; 777.4]
3 11.7 [-330.2; 353.6] 1.3 [-68.0; 72.4] 8.9 [-247.0; 256.6] 1.5 [-57.2; 55.2] 0.4 [-17.0; 18.0] 28.5 [-730.0; 773.0]
Ventilation Version 2
10 1 22.0 [-94.4; 147.2] 3.8 [-21.0; 27.0] 14.0 [-73.2; 105.0] 4.2 [-16.0; 25.0] 0.8 [-5.0; 7.0] 36.9 [-220.2; 300.4]
2 9.1 [-106.2; 126.6] 1.4 [-22.0; 24.0] 5.7 [-78.2; 90.2] 1.9 [-18.0; 21.2] 0.4 [-5.0; 7.0] 12.7 [-227.8; 260.4]
3 4.4 [-104.2; 114.2] 0.7 [-22.2; 22.2] 2.8 [-77.2; 85.0] 0.8 [-18.0; 19.0] 0.2 [-5.0; 6.0] 7.8 [-238.0; 245.2]
50 1 99.4 [-152.6; 348.8] 16.8 [-35.2; 71.0] 63.7 [-112.2; 243.0] 18.8 [-24.0; 66.0] 3.5 [-10.0; 17.0] 160.4 [-352.6; 694.4]
2 47.6 [-189.0; 295.0] 7.8 [-43.0; 58.2] 30.9 [-140.2; 211.2] 8.8 [-32.2; 53.0] 1.7 [-11.0; 14.0] 82.2 [-416.0; 605.2]
3 10.3 [-223.4; 248.4] 2.0 [-43.0; 52.0] 6.1 [-160.0; 185.2] 2.3 [-37.4; 42.0] 0.7 [-12.0; 13.0] 22.0 [-513.0; 523.2]
100 1 196.8 [-170.6; 558.8] 34.1 [-37.2; 108.2] 124.0 [-146.2; 392.2] 38.6 [-22.0; 102.0] 7.6 [-11.0; 27.0] 329.5 [-423.2; 1084.0]
2 96.9 [-233.2; 425.4] 16.4 [-51.2; 83.0] 62.2 [-181.2; 299.0] 18.3 [-38.2; 76.2] 3.3 [-14.2; 22.0] 170.7 [-500.2; 865.8]
3 30.5 [-294.4; 343.2] 5.1 [-59.0; 73.0] 19.0 [-224.0; 251.6] 6.4 [-49.2; 62.0] 1.2 [-16.0; 19.0] 58.8 [-658.6; 752.8]
Mean excess numbers of overall positive cases (PC), asymptomatic cases (AC), light symptomatic cases (LC), severe symptomatic cases (SC), hospitalized cases (H), and quarantined individuals (Q)
for each ventilation version (VV) by background incidence (IN) per 100,000 per week and scenario (S), with MGE attended by 200,000 individuals per 30 days. Mask wearing is assumed. Empirical
95% confidence intervals calculated from all runs are shown in brackets.
for the reduction of transmission risk and demonstrates that respondents (89%) felt the wearing of a N95-mask was unpro-
mask wearing and event size adjustments are possible measures blematic, or a little restrictive, but that they could get used to it
for risk reduction. quickly (Supplementary Fig. 7). If it were necessary to wear
normal mouth-nose protection or a N95 mask for a concert, 90%
and 78% of the participants, respectively, would do so.
Acceptance of hygiene practices. Acceptance and compliance are
key factors in achieving the full potential of hygiene practices
regarding contact and transmission reduction. A total of Discussion
960 study participants completed a questionnaire provided three Even without precautions, not every attendant has contact with
weeks after the experiment (79%). Of those, 88% could imagine all others during an MGE. In scenarios with physical distancing,
attending an event or concert under the conditions of Scenario 2, the resulting contact numbers are low and the effective risk
and 82% under the conditions of Scenario 3. The majority of depends primarily on the adequacy of the ventilation. Under
4 NATURE COMMUNICATIONS | (2021)12:5096 | https://doi.org/10.1038/s41467-021-25317-9 | www.nature.com/naturecommunicationsNATURE COMMUNICATIONS | https://doi.org/10.1038/s41467-021-25317-9 ARTICLE
Table 3 Increase in SARS-CoV-2 positive cases in in their seats, and exposure time can accumulate. Wearing masks
percentage that acquired the infection during the mass should therefore be mandatory, especially while sitting, to max-
imize its protective effect. The entry, half time and exit phases are
gathering events (MGE).
important with respect to contacts, but particularly for uncritical
short time contacts.
IN S Increase of SARS- Hygiene practices must thus address organizational aspects to
CoV-2 positive
ensure low contact times in all periods. Testing before an event is
cases [%]
likely to give additional security, but it is very time and resource
No masks Masks consuming. In addition, testing thousands of people within a few
Ventilation 10 1 13.3 [-43.7; 112.8] 13.3 hours would be a huge organizational challenge. Our results apply
Version 1 [-45.4; 115.3] to MGE with seating orders and a high compliance with the
2 11.3 [-46.8; 120.8] 11.6 implemented hygiene practice. Hygiene stewards rarely had to
[-45.3; 109.2]
intervene in our experiment. This might be a consequence of the
3 7.7 [-45.9; 97.5] 9.2 [-46.9; 96.8]
50 1 9.2 [-19.7; 39.9] 5.0 [-20.5; 35.8]
highly disciplined participants in our study, but also indicates that
2 5.1 [-21.0; 35.6] 3.7 [-23.2; 38.0] knowledge about being tested negatively did not lead to the
3 2.6 [-22.9; 31.9] 1.4 [-26.7; 34.4] breach of specific distancing rules in the various phases of the
100 1 9.1 [-11.1; 30.6] 4.8 [-14.2; 27.4] experiment. Enforcing a hygiene practice in routine practice is
2 4.8 [-14.4; 28.6] 2.8 [-16.7; 26.7] crucial for risk reduction, however, and can be supported by
3 2.3 [-17.3; 25.0] 1.2 [-17.6; 22.5] hygiene stewards.
Ventilation 10 1 29.2 [-40.3; 136.8] 18.7 Large scale events (e.g. soccer games) and standing concerts
Version 2 [-43.5; 114.2] (e.g. rock concerts) might be different to the MGE we simulated
2 15.6 [-44.2; 113.0] 11.0 [-47.2; 97.6] with respect to the number of contacts and the probability of
3 11.2 [-47.0; 104.9] 8.3 [-47.3; 93.9] transmission23. Primarily, larger crowds cause people to stand
50 1 24.6 [-8.1; 64.7] 12.6 [-15.4; 45.0] closer together during entry due to space restrictions, causing
2 11.7 [-16.1; 45.5] 6.5 [-20.5; 39.7]
additional contacts on the way to the event. Secondly, especially
3 5.3 [-21.8; 36.5] 2.2 [-23.0; 33.1]
100 1 23.6 [-0.2; 49.9] 12.2 [-10.1; 36.3]
in unseated concerts, visitors are in a close proximity to each
2 10.8 [-9.7; 35.2] 6.2 [-12.3; 27.8] other, and do not stay in fixed positions, so the number of con-
3 4.5 [-14.5; 25.5] 2.3 [-16.2; 24.2] tacts can increase over time.
There are several limitations to our study. First, we did not
At an incidence of 10 per 100,000 people, random effects have a strong impact on the number reach our intended goal of 4000 participants. Although we
of additional cases due to MGE, such that the variation supersedes the impact of masks. The
mean across all 1000 runs is therefore affected by stochastic fluctuation. implemented space restrictions, the density of contacts may still
Numbers of positive cases are shown for MGE with 200,000 participants per month, and by have been reduced. Second, we made simplifications regarding
scenario 1-3 compared to no MGE, including mask wearing vs. no masks, ventilation version 1
and 2, and different incidences per 100,000 per week (IN). The increase in positive cases was aerosol exposure, as crucial aspects such as the minimal infectious
calculated by dividing the number of cases with MGE minus the number of cases without MGE dose or the viral load of aerosols remain unknown. The ASHRAE
divided by the number of cases without MGE, thus negative numbers indicate that a simulation
run without MGE had higher numbers compared to the parallel run with MGE. Empirical 95% Standard 62.1-2013 recommends a minimum ventilation rate of
confidence intervals calculated from all runs are shown in brackets. 3.8 l s−1 per person in the spectator area. Due to an air supply of
198 000 m³ h−1 the Leipzig arena supplies 6.7 l s−1 per person
hygiene protocols and with good ventilation, even a substantial (max. 8200 seating persons) or 4.5 l s−1 (max. 12,300 standing
number of indoor MGE would thus have minimal effects on the persons), and exceeds the ASHRAE recommendation by
overall number of infections in the population. However, poor approximately 1.75 times or 1.2 times, respectively. Since venti-
ventilation systems can lead to a considerably higher rate of lation is crucial for the risk associated with MGE, it is important
aerosol exposure, and can thereby result in a high number of that further studies focus on this aspect. Third, we did not analyse
infections. MGE only contribute to a small proportion of all other opportunities for contacts which could be linked to the
individual contacts within a population. MGE. For example, additional contacts could take place during
In our simulations the difference with and without events was transit, or if participants of the MGE go to bars or similar venues
close to zero on average, but in some cases, the numbers of new after the concert. We assumed that all the other settings would
infections could be substantial. In an unfavorable case, this may have their own hygiene practices, for example, not allowing
result in the impression that many infections were caused by overcrowding. In a practical sense, this can be difficult for large
events. Apart from these single unfortunate MGE, events without events, but with additional efforts the excess risk can be mini-
any precautions can make a substantial contribution to the epi- mized. While we used a detailed model to simulate SARS-CoV-2
demic spread. Under precautionary measures, MGE will con- transmission in society, additional structures in the population can
tribute only a small fraction of new cases to the overall epidemic, affect the results. For example, if the same group participated in all
even at R values above 1. Some contacts might also not be truly events and transmitted the infections acquired in one event to
additional contacts from MGE, as people attending the event may another, it would result in a higher impact of MGE. Fourth, lack of
have been previous contacts, meaning the overall effect of MGE adherence to hygiene practices is a potential danger, but reinfor-
on transmission is further diminished. cing the hygiene practice should be a requirement for MGE.
While poor ventilation can substantially increase the number Lastly, our model assumes no limit for contact tracing capacities.
of transmissions, we expect that using masks, and particularly If health authorities were overloaded and contact tracing com-
N95 masks, would reduce the risk. Masks were not used in the promised, the effect of MGE would be higher than assumed in our
super-spreading events described in the literature22. The effects of model. During the early pandemic in Germany, an incidence of 50
masks on the reduction of transmission are generally per 100,000 per week was considered the threshold below which
accepted23,24. We compared MGE with and without mask contact tracing capacities were sufficient. Contact tracing capa-
wearing, and, since the effects are proportional within an MGE, cities were later expanded, but still it is possible that the capacities
the effect of wearing masks by any percentage of the participants would be insufficient for higher incidences.
can be directly estimated. Nevertheless, aerosols are of special In conclusion, we found that the participants of a seated
concern in indoor settings, during the periods when visitors stay concert in a well-ventilated arena have a high number of short
NATURE COMMUNICATIONS | (2021)12:5096 | https://doi.org/10.1038/s41467-021-25317-9 | www.nature.com/naturecommunications 5ARTICLE NATURE COMMUNICATIONS | https://doi.org/10.1038/s41467-021-25317-9
contacts and a low number of long lasting contacts. A moderately entrances/exits) and were not allowed to change quadrants. A seating arrangement
restrictive hygiene practice (i.e. Scenario 2) provided a substantial was implemented, where every second seat was occupied and the rows were shifted
(checkerboard pattern). Scenario 3 reflected a stronger contact reduction, with
reduction in infection risk. Wearing masks during the concert pairwise seating of participants and the implementation of a minimum distance of
was highly accepted by most participants and can provide further 1.5 m between the occupied pairs of seats. The number of entrances/exits was also
risk reduction. When hygiene practices are applied and the increased to eight. The different scenarios are summarized in Supplementary
conditions of good ventilation are met, MGE appear to contribute Table 3.
little to the epidemic spread of COVID-19. A lack of hygiene
practices and/or inadequate ventilation can substantially increase
the number of subjects at risk. The setting. The Quarterback Immobilien Arena is an event location in the city of
Leipzig and is one of the 10 most frequented live entertainment venues in Germany
(https://www.stadionwelt.de/plus/arena-ranking-besucher). The type and layout of
Methods the arena (multipurpose hall) is common in the industry, and further examples can
General study design. The “Risk Prediction of Indoor Sports and Culture Events be found in Stuttgart (Porsche Arena), Berlin (Max Schmeling Arena) and Nur-
for the Transmission of Covid-19” (RESTART-19) study was initiated in order to emberg (Arena Nuremberg Insurance). The arena has a seating capacity of up to
provide data on contacts and aerosol exposure at indoor mass gathering events 8228 people. Supplementary Fig. 8 shows an overall plan of the location. Visitors
(MGE). The study comprises three parts: usually (i.e. before the pandemic) enter the hall via two main entrances (west and
east side) opening into the foyer at the south end of the arena. From the foyer, they
1. Experiment: In order to determine the number of contacts during a MGE, enter two long tunnels running parallel to the interior on each side of the hall.
we conducted a pop concert under experimental conditions and provided all Visitors reach the event room via corridors branching off the tunnels. The arena
participants with a contact tracing device (CTD). The concert was also has four emergency exits on each long side of the building, which were used in
performed in three scenarios with different hygiene practices. Scenarios 2 and 3 to enter and exit the arena.
2. Aerosol Distribution: To assess the aerosol exposure, the aerosol movement, The total room volume of the arena is 135,000 m3. The ventilation system has a
the indoor aerosol concentrations and the concentrations in the breathing total capacity of 198,000 m3 h−1 and uses 100% fresh air. The outlets under the
air were calculated using computational fluid dynamics (CFD). grandstands have a capacity of 114 000 m3 h−1. On the long side of the grandstand,
3. Epidemiological Simulation: We integrated the results of contact tracing and there are jet nozzles above the heads of the spectators, which blow air downstream
aerosol distribution in an individual-based model, and simulated the effects to the inner space (84.000 m3 h−1).
on the subsequent burden of infections.
The study protocol was submitted to the German clinical trial register (DRKS
00022790). (www.drks.de)
Hygiene practice. The Saxonian Ministry of Social Affairs and Cohesion (Säch-
sisches Staatsministerium für Soziales und Gesellschaftlichen Zusammenhalt) and
Experimental concert simulation and contact measurement. The event took the health authorities of the city of Leipzig approved the hygiene practice.
place on August 22nd, 2020 in an indoor arena (Quarterback Immobilien Arena, SARS-CoV-2 testing: One week before the event, all participants and staff
QIA) in the city of Leipzig (Germany). members received a PCR test set for SARS-CoV-2 including a swab and a tube
Recruitment procedure and participants containing stabilizing solution. The set included detailed instructions on self-
Individuals aged between 18 and 50 years were invited through an extensive sampling and on returning the test set. Participants were requested to take a throat
media campaign to register voluntarily and free of charge via the study webpage swab within the 48 h before the event. The test sets could be returned to five
(www.restart19.de), where comprehensive information about the event, its different locations in Leipzig or Halle (Saale), or sent via mail. All samples were
objectives, and risks was provided. All participants gave their informed consent. analyzed by the Institute of Virology of the University Hospital in Leipzig. Test
Participants did not receive any kind of allowance, but food and drinks were results were imported to the data bank the night before the event and the
provided for free throughout the experiment. A priori exclusion criteria were self- participants received notification via e-mail. Participants with positive or missing
reported obesity (Body-Mass-Index >30), chronic diseases, cardiovascular diseases, test results were informed by phone, and were not allowed to enter the arena. The
cancer, immune suppression, the intake of immunosuppressants, pregnancy, or test was free of charge.
conditions affecting lungs, liver, or kidneys. We planned to include 4000 Exclusion criteria: Onsite exclusion criteria were no valid registration, no ID, a
participants, corresponding to half of the capacity of the arena, and reflecting the positive or missing SARS-CoV-2 test, temperature above 37.5 °C, self-reported
mean event size for sports and culture events in 2019 at this location (4200 symptoms of COVID-19 within the past 48 h, contact with a COVID-19 patient or
participants). a stay in a risk area (according to the Robert Koch Institute of August, 22th 2020)
From July 17th to August 21st, 2020 a total of 2825 participants registered for within the last 14 days.
the study. 601 participants actively withdrew their consent, and 212 participants Personal protective equipment: During study-check-in, each participant
did not confirm their registration. 2023 participants thus received the SARS-CoV-2 received a N95 mask, a hand sanitizer bottle containing 85.5% Ethanol V/V, as well
screening test set (see hygiene practice below), of which 1407 samples were as an ultra-wide band contact tracing device (CTD). The N95 mask had to be worn
returned on time to the laboratory for analysis. Information on test results was from entering to leaving the arena, as well as outside the arena in queues at the
reported back to the participants. Only those with a negative test result were asked entrance and exits.
to participate. One participant tested positive and was therefore excluded. In total, Catering: A catering service was only provided outside the arena, where
1212 persons took part in the experiment. Because fewer individuals participated in participants were allowed to remove their masks if a distance of 1.5 m could be
the event than initially planned, we prepared the arena to create a setting of realistic maintained. The catering was free of charge in order to reduce the waiting time for
density: we closed seating ranks, catering stalls, bathrooms, and entries as required participants and to avoid participants leaving the area. Water bottles were given to
by each hygiene practice. In Scenario 1, 1192 participants, in Scenario 2, 1158 the participants on request inside the arena, where they were allowed to drink while
participants and in Scenario 3, 1054 participants were present. These numbers are maintaining an appropriate distance from other people. Indoor catering service was
smaller than the total number of participants (n = 1212), because not all simulated during the half times of the different scenarios, so that people received
participants were present during all scenarios. vouchers to use outside.
Distance and hygiene stewards: Except for the first scenario, all participants
were asked to keep a distance of 1.5 m. To ensure that all participants followed the
The event. On the study day, all participants arrived between 8:00 and 10:00 a.m. hygiene practice, 40 hygiene stewards were present inside the arena. Participants
for check-in. During check-in, participants were registered, identities confirmed repeatedly not adhering to the hygiene practice advice would have been asked to
and N95 masks, hand sanitizers, and contact tracing devices handed out to each leave the arena (but this was not necessary).
person. Three tickets for three different scenarios were issued per person, con- Briefing of participants and staff: All participants received comprehensive
taining information on timing, entrances, and seating for each scenario. information regarding the hygiene practice upon registration. On the day of the
We simulated three different scenarios in order to analyse the impact of event, the participants received an information sheet with the hygiene rules and
different hygiene measures on the transmission of SARS-CoV-2. Each scenario instructions on proper use of N95 masks and hand sanitizers by the check-in staff.
followed the same schedule: entry (60 min), 1st half (20 min), half time (20 min), Participants also received verbal instructions at the beginning of the event. Staff
2nd half (20 min), exit (15 min). During the halves, the German singer/songwriter received detailed training on hygiene practices.
Tim Bendzko performed a live pop concert. Scenarios differed with respect to Contact tracing: Participants provided full contact details during the
hygiene measures such as number of entrances/exits, distance between seats, and registration process. Participants agreed that their contact tracing devices (CTD)
restricted mixing of participants by dividing the arena into quadrants. Scenario 1 could be used to identify those at risk. In case of a SARS-CoV-2 infection after the
was designed to reflect a pre-pandemic state, where participants entered and exited event, affected participants would have been contacted. We are not aware of any
the arena through two main entrances without any restrictions, and were seated persons who were infected during the event. All personal information was deleted
without free seats in-between. Scenario 2 applied moderate hygiene measures: the six weeks after the event. The resulting data was anonymized.
arena was divided into four quadrants. Participants entered and exited the arena Corona Warn App: Using the Corona-Warn-App of the German federal
through the entrance/exit of the quadrant as indicated on their ticket (four government was recommended, but not required for participation.
6 NATURE COMMUNICATIONS | (2021)12:5096 | https://doi.org/10.1038/s41467-021-25317-9 | www.nature.com/naturecommunicationsNATURE COMMUNICATIONS | https://doi.org/10.1038/s41467-021-25317-9 ARTICLE Measurement of contacts in physical proximity. All participants received a increase during singing, shouting, or cheering. The detailed parameters and personalized contact tracing device (CTD) and were instructed to wear it around equations used for the model are summarized in Supplementary Tables 5 and 6. their neck during the event. ICDWpro quad 164643 (In-Circuit, Dresden, Ger- Each dummy was equipped with a virtual mouth for respiration to quantify the many) tags were used to measure the distance between two close participants and virus exposure of the spectators. Aerosol exposure was measured within the model the contact duration time at this distance. These tags combine Bluetooth low directly at the mouth opening. To evaluate the dynamics and flow of the aerosol energy and ultra-wide band radio technology, reaching an accuracy of ± 20 cm. The distribution within the arena, their aerosol movement was calculated via the par- CTD could either send or receive signals at any given time point so that there was ticle tracking software GENTRA by the drift-flux model in FLAIR, and the results an exchange of signals between the CTDs of all participants. Distances were not were presented through visualization by GENTRA and cumulated numbers. The measured constantly, but at specified intervals (around every three seconds). The quantitative results of the dispersion of the exhaled aerosols of the infectious tags coordinate their broadcast time to minimize interference (only distant tags participants were transferred to spreadsheets according to the seating arrangement broadcast at the same time), and therefore, very short encounters can be missed in the arena. The number of affected persons and their level of exposure were (
ARTICLE                                                                                NATURE COMMUNICATIONS | https://doi.org/10.1038/s41467-021-25317-9

Contact network. Model assumptions regarding daily contacts in the population               Code availability
were taken from the European POLYMOD contact study21. The age-specific contact               The codes for the contact tracer analysis and simulation model have been deposited in
rates were applied to the population of the city of Leipzig (Supplementary Table 8).        the Zenodo database under accession code https://doi.org/10.5281/zenodo.4647830 and
We considered three types of contact settings for the model: household, school/             https://doi.org/10.5281/zenodo.477006442,43.
work, and other (including the contact categories transport, leisure, and other from
the POLYMOD study21 (Supplementary Table 9). We assume that there is exactly
one home place (household) for each person, and that there is exactly one place at          Received: 5 January 2021; Accepted: 3 August 2021;
day-care or school for each person aged 0–19 years. Each school or daycare class
consists of 20 children (reflecting the average class size in Saxony), as well as one
teacher aged 20–64 years old. For each person between 20 and 69 years of age (apart
from teachers), there is one workplace. We included four different workplace sizes
according to the categories reported by the Federal Statistical Office in Germany.
The selection of a person’s working place is random, but depends on age (based on           References
additional analyses of POLYMOD data). We only considered contacts longer than               1.    McCloskey, B. et al. Mass gathering events and reducing further global spread of
15 min for the numbers of contacts for each person, which is in line with the high-               COVID-19: a political and public health dilemma. Lancet 395, 1096–1099 (2020).
risk contact definition from the RKI. As a kind of fourth network, the persons               2.    Tagesschau (2020). Wo Großveranstaltungen ausfallen. Available at: https://
attending an event are drawn randomly every day from the entire population. Only                  www.tagesschau.de/inland/corona-absagen-bundeslaender-101.html
people who tested positive were excluded, as well as persons below 15 years of age.               (Accessed: 15 May 2021).
The numbers of both proximity and aerosol contacts within these events were
                                                                                            3.    Research Institute for Exhibition and Live-Communication (2020). Die
provided by the experimental concert (Supplementary Table 4).
                                                                                                  gesamtwirtschaftliche Bedeutung der Veranstaltungsbranche. Available at:
                                                                                                  http://rifel-institut.de/fileadmin/Rifel_upload/3.0_Forschung/Meta-
Epidemic control measures. Our model is based on the national guidelines for                      Studie_gesamtwirtschaftliche_Bedeutung_der_Veranstaltungsbranche_RI-
Germany regarding the SARS-CoV-2 testing strategy: testing due to symptoms or                     FEL.pdf (Accessed: 15 May 2021).
as someone who has been in contact with a known case. We assume perfect tests               4.    Correia, G., Rodrigues, L., Gameiro da Silva, M. & Gonçalves, T. Airborne
with 100% sensitivity and specificity. There are two ways to detect infected indi-                 route and bad use of ventilation systems as non-negligible factors in SARS-
viduals in the model, either due to symptoms or due to contact tracing. Someone                   CoV-2 transmission. Med. Hypotheses 141, 109781 (2020).
with a severe case of COVID-19 is assumed to be tested, detected, and isolated
                                                                                            5.    Qian, H. et al. Indoor transmission of SARS-CoV-2. Indoor Air 1–7 (2020)
within one day of symptom onset, with an overall probability of 90%. Cases with
                                                                                                  https://doi.org/10.1111/ina.12766.
mild symptoms are assumed to be tested within two days after symptom onset with
                                                                                            6.    Chia, P. Y. et al. Detection of air and surface contamination by SARS-CoV-2
an overall probability for testing of 50%. Asymptomatic individuals, who never
                                                                                                  in hospital rooms of infected patients. Nat. Commun. 11, (2020).
develop symptoms, can only be detected by contact tracing. After a person has
tested positive, the household members of that individual are requested to be tested        7.    Liu, Y. et al. Aerodynamic analysis of SARS-CoV-2 in two Wuhan hospitals.
within one day, and stay in quarantine for 14 days. We did not account for non-                   Nature 582, 557–560 (2020).
compliance during self-quarantine. We assumed a detection rate of 100% for all              8.    Klompas, M., Baker, M. A. & Rhee, C. Airborne Transmission of SARS-CoV-
household members, thus adding new branches for contact tracing. In contrast, the                 2. Jama 324, 441 (2020).
testing rate is assumed to be 80% within the school or work network, with a delay           9.    Morawska, L. & Cao, J. Airborne transmission of SARS-CoV-2: The world
of two days for the test results. In the third contact network “other”, we assumed                should face the reality. Environ. Int. 139, 105730 (2020).
that only 50% of contacts were identified and tested, with a delay of four days.             10.   Richard, M. et al. SARS-CoV-2 is transmitted via contact and via the air
Infected persons are detected through contact tracing, if the individual passed the               between ferrets. Nat. Commun. 11, 1–6 (2020).
latent phase, including pre-symptomatic and completely asymptomatic persons.                11.   Tang, S. et al. Aerosol transmission of SARS-CoV-2? Evidence, prevention and
Contract tracing is triggered by the new detection of any infected person, and is                 control. Environ. Int. 144, 106039 (2020).
independent if the detection itself was due to symptoms or past contact tracing.            12.   Fernstrom, A. & Goldblatt, M. Aerobiology and its role in the transmission of
Recursive contact tracing can therefore result in the detection of whole infection                infectious diseases. J. Pathog. 2013, 1–13 (2013).
chains. Any detected person is isolated for 14 days (including hospital stay if             13.   Buonanno, G., Stabile, L. & Morawska, L. Estimation of airborne viral
necessary). In this model, secondary contacts were not quarantined pre-emptively,                 emission: Quanta emission rate of SARS-CoV-2 for infection risk assessment.
which is in line with the national test strategy of Germany, but could be identified               Environ. Int. 141, 105794 (2020).
once the primary contact became a confirmed case.                                            14.   Gammaitoni, L. & Nucci, M. C. Using a mathematical model to evaluate the
                                                                                                  efficacy of TB control measures. Emerg. Infect. Dis. 3, 335–342 (1997).
Reproduction number. The POLYMOD contact matrix corresponds to the pre-                     15.   Center for Disease Control and Prevention (CDC) (2020). Case Investigation
pandemic state. We calibrated the average per contact transmission probability to                 & Contact Tracing Guidance. Available at: https://www.cdc.gov/coronavirus/
obtain a reproduction number for the epidemic of about 3 (while assuming the                      2019-ncov/php/contact-tracing/contact-tracing-plan/appendix.html#contact
susceptible fraction at 100%—i.e. conditions at the beginning of the epidemic) and                (Accessed: 15 May 2021).
subsequently reduced the contacts in all settings uniformly by 50% and applied the          16.   Harvey, R. A. et al. Association of SARS-CoV-2 seropositive antibody test with
epidemic control measures, finally arriving at an R around 1. As testing is also                   risk of future infection. JAMA Intern. Med. 20850, 1–7 (2021).
included in the model, the model also provides an age-specific proportion of                 17.   Robert-Koch-Institut (RKI) (2021). Serologische Untersuchungen von
detected and undetected cases. With the intended incidence and an age-specific                     Blutspenden auf Antikörper gegen SARS-CoV-2 (SeBluCo-Studie). Available
rate of detected and undetected cases, each run starts with a 14 day burn-in phase                at: https://www.rki.de/DE/Content/InfAZ/N/Neuartiges_Coronavirus/
followed by the 30 day evaluation period. The POLYMOD contact matrix ignores                      Projekte_RKI/SeBluCo_Zwischenbericht.html, (Accessed: 15 May 2021).
the potential transmission of respiratory pathogens due to aerosols, which increases        18.   Fischer, B., Knabbe, C. & Vollmer, T. SARS-CoV-2 IgG seroprevalence in
the probability of acquiring infection in a contact for a given reproduction number.              blood donors located in three different federal states, Germany, March to June
                                                                                                  2020. Eurosurveillance 25, 1–4 (2020).
                                                                                            19.   Bajema, K. L. et al. Estimated SARS-CoV-2 Seroprevalence in the US as of
Demographic background. The study was conducted in Leipzig, which is a large city                 September 2020. JAMA Intern. Med. 30329, 1–11 (2020).
in the Federal State of Saxony in eastern Germany, with about 601,083                       20.   Slot, E. et al. Low SARS-CoV-2 seroprevalence in blood donors in the early
inhabitants40. The detailed demographics for the model are based upon Leipzig40.                  COVID-19 epidemic in the Netherlands. Nat. Commun. 11, 1–7 (2020).
Since the duration of the simulated epidemic was less than a year, we did not               21.   Mossong, J. et al. Social contacts and mixing patterns relevant to the spread of
consider changes in the population due to births, deaths, migration, or aging.                    infectious diseases. PLoS Med. 5, 0381–0391 (2008).
                                                                                            22.   Ahammer, A., Halla, M. & Lackner, M. Mass gatherings contributed to early
Statistical analysis. The mean and the standard deviation around the mean, the                    COVID-19 spread: Evidence from US sports. Covid Econ. 44–62 (2020).
range, and interquartile range (IQR) were calculated for statistical analyses, as well      23.   Chu, D. K. et al. Physical distancing, face masks, and eye protection to prevent
as 95% confidence intervals.                                                                       person-to-person transmission of SARS-CoV-2 and COVID-19: a systematic
                                                                                                  review and meta-analysis. Lancet 395, 1973–1987 (2020).
Reporting summary. Further information on research design is available in the Nature        24.   Howard, J. et al. An evidence review of face masks against COVID-19. Proc.
Research Reporting Summary linked to this article.                                                Natl Acad. Sci. USA 118, 1–12 (2021).
                                                                                            25.   Claydon, H. & Malin, M. Modelling Aerosol Deposition in Buildings (2019).
                                                                                                  Available at: http://www.cham.co.uk/_docs/pdfs/newsletter/
Data availability                                                                                 PHOENICS_News_Autumn_2019.pdf (Accessed: 15 May 2021).
Most of the quantitative results are provided in the supplemental tables. The raw contact   26.   Jiang, Y. et al. Investigating a safe ventilation rate for the prevention of indoor
data generated in this study have been deposited in the Zenodo database under accession           SARS transmission: an attempt based on a simulation approach. Build. Simul.
code https://doi.org/10.5281/zenodo.513766741.                                                    2, 281–289 (2009).

8                      NATURE COMMUNICATIONS | (2021)12:5096 | https://doi.org/10.1038/s41467-021-25317-9 | www.nature.com/naturecommunications
NATURE COMMUNICATIONS | https://doi.org/10.1038/s41467-021-25317-9 ARTICLE
27. González Pedraza, O. J., Pacheco Ibarra, J. J., Rubio-Maya, C., Galván Author contributions
González, S. R. & Rangel Arista, J. A. Numerical study of the drift and S.M.: conceptualization, methodology, formal analysis, investigation, resources, writing—
evaporation of water droplets cooled down by a forced stream of air. Appl. original draft, writing—review and editing, supervision, project administration, funding
Therm. Eng. 142, 292–302 (2018). acquisition. C.G.: conceptualization, methodology, formal analysis, investigation, resources,
28. Srebric, J. & Chen, Q. Simplified numerical models for complex air supply writing—original draft, writing—review and editing, supervision, visualization. J.H.: meth-
diffusers. ASHRAE Trans. 109 PART 1, 90 (2003). odology, software, formal analysis, investigation, resources, data curation, visualization,
29. Hartmann, A., Lange, J., Rotheudt, H. & Kriegel, M. Emission rate and particle writing—original draft. M.P.: conceptualization, methodology, formal analysis, investigation,
size of bioaerosols during breathing, speaking and coughing. Preprint 1–5 resources, data curation, writing—original draft. S.L.: investigation, resources, writing—ori-
(2020) https://doi.org/10.14279/depositonce-10331. ginal draft. B.K.: investigation, resources, writing—original draft. A.I.: conceptualization,
30. Mürbe, D., Fleischer, M., Lange, J., Rotheudt, H. & Kriegel, M. Aerosol resources. O.P.: software, formal analysis, data curation. M.G.: investigation, supervision,
emission is increased in professional singing. 1–10 (2020) https://doi.org/ funding acquisition. F.Z.: CRD-conceptualization, methodology, investigation, formal ana-
10.31219/osf.io/znjeh. lysis, writing - review and editing. R.M.: conceptualization, methodology, investigation,
31. Stadnytskyi, V., Bax, C. E., Bax, A. & Anfinrud, P. The airborne lifetime of writing - review and editing, supervision, project administration.
small speech droplets and their potential importance in SARS-CoV-2
transmission. Proc. Natl Acad. Sci. USA 117, 11875–11877 (2020).
32. Kormuth, K. A. et al. Environmental persistence of influenza viruses is
Funding
Open Access funding enabled and organized by Projekt DEAL.
dependent upon virus type and host origin. mSphere 4, 1–14 (2019).
33. Jayaweera, M., Perera, H., Gunawardana, B. & Manatunge, J. Transmission of
COVID-19 virus by droplets and aerosols: a critical review on the unresolved Competing interests
dichotomy. Environ. Res. (2020) https://doi.org/10.1016/j.envres.2020.109819. The authors declare no competing interests.
34. Wölfel, R. et al. Virological assessment of hospitalized patients with COVID-
2019. Nature 581, 465–469 (2020).
35. Wang, D. et al. Clinical characteristics of 138 hospitalized patients with 2019 Ethics statement
novel coronavirus-infected pneumonia in Wuhan, China. JAMA - J. Am. Med. The Ethics Committee of the Martin Luther University (Halle, Germany) approved the
Assoc. 323, 1061–1069 (2020). data collection for the RESTART-19 study (reference number 2020-095). The responsible
36. Liu, L., Li, Y., Nielsen, P. V., Wei, J. & Jensen, R. L. Short-range airborne authorities of the Federal State of Saxony (Saechsisches Staatsministerium fuer Soziales
transmission of expiratory droplets between two people. Indoor Air 27, und gesellschaftlichen Zusammenhalt) provided special permission for the mass event.
452–462 (2017). The Public Health Authority of the city of Leipzig approved the hygiene and safety
37. Morawska, L. et al. Airborne particles in indoor environment of homes, practice for the event date.
schools, offices and aged care facilities: the main routes of exposure. Environ.
Int. 108, 75–83 (2017). Additional information
38. Landesportal Schleswig-Holstein (2021). Für Schleswig-Holstein gemeldete Supplementary information The online version contains supplementary material
Corona-Fälle. Available at: https://www.schleswig-holstein.de/DE/Schwerpunkte/ available at https://doi.org/10.1038/s41467-021-25317-9.
Coronavirus/Zahlen/zahlen_node.html (Accessed: 15 May 2021).
39. Robert-Koch-Institut (RKI) (2020). COVID-19 Datenhub. Available at: https:// Correspondence and requests for materials should be addressed to S.M. or R.M.
npgeo-corona-npgeo-de.hub.arcgis.com/search (Accessed: 15 May 2021).
40. Stadt Leipzig (2020). Bevölkerungsbestand. Available at: https:// Peer review information Nature Communications thanks Dennis Feehan, Congrong He
statistik.leipzig.de/statcity/table.aspx?cat=2&rub=5&obj=0 (Accessed: 15 and the other, anonymous, reviewer(s) for their contribution to the peer review of this
May 2021). work. Peer reviewer reports are available.
41. Moritz, S. et al. Data from: The Risk of Indoor Sports and Culture Events for
the Transmission of COVID-19. Zenodo https://zenodo.org/record/ Reprints and permission information is available at http://www.nature.com/reprints
5137667#.YQKKYOdCSUk (2021).
42. Horn, J. Restart_Data_Publication_The_risk_of_indoor_sports_and_culture_ Publisher’s note Springer Nature remains neutral with regard to jurisdictional claims in
events_for_the_transmission_of_COVID-19. Zenodo https://doi.org/10.5281/ published maps and institutional affiliations.
zenodo.4770064 (2021).
43. Purschke, O. restart19_contacts: First release of R-routines to analyse the
Restart-19 contact tracer data. Zenodo https://doi.org/10.5281/
zenodo.4647830 (2021). Open Access This article is licensed under a Creative Commons
Attribution 4.0 International License, which permits use, sharing,
adaptation, distribution and reproduction in any medium or format, as long as you give
appropriate credit to the original author(s) and the source, provide a link to the Creative
Acknowledgements Commons license, and indicate if changes were made. The images or other third party
First, we especially thank Karsten Guenther, Managing Director of SC DHfK Handball, material in this article are included in the article’s Creative Commons license, unless
Leipzig, and Philipp Franke and Matthias Koelmel (Directors of the Quarterback indicated otherwise in a credit line to the material. If material is not included in the
Immobilien Arena), who provided the inspiration for setting up this study and supported article’s Creative Commons license and your intended use is not permitted by statutory
the experiment, provided the arena and helped to recruit participants. We thank the regulation or exceeds the permitted use, you will need to obtain permission directly from
musician Tim Bendzko who performed the concert. We also thank the governments of the copyright holder. To view a copy of this license, visit http://creativecommons.org/
the Federal States of Saxony and Saxony-Anhalt who agreed to fund the project and the licenses/by/4.0/.
required tests. We thank all the helpers in the project, who prepared and organized the
full day event. Finally, we would like to thank all participants of the experiment who
donated their time for this project. © The Author(s) 2021
NATURE COMMUNICATIONS | (2021)12:5096 | https://doi.org/10.1038/s41467-021-25317-9 | www.nature.com/naturecommunications 9You can also read