The S&P Liquidity Adequacy Ratio and its Role in Upper Management Decision Making - Energy Risk USA 2007 May 16th, Houston, Texas

Page created by Scott Herrera
 
CONTINUE READING
The S&P Liquidity Adequacy Ratio and its Role in Upper Management Decision Making - Energy Risk USA 2007 May 16th, Houston, Texas
The S&P Liquidity Adequacy Ratio
and its Role in Upper Management
         Decision Making
           Energy Risk USA 2007
          May 16th, Houston, Texas

         John Wengler, Chief Risk Officer
              Entergy Services, Inc.
Overview

Calculating the ratio between available liquidity
and potential liquidity demands
The different S&P Liquidity Adequacy ratios by
energy sector
Perspectives from Standard & Poor’s
Communicating liquidity adequacy to upper
management to enhance decision making
Customizing your own stress scenarios
Industry Perspectives

                                                    Page 2
Background on Entergy

 Geographic Scale                                               Entergy’s Business Model
 Entergy’s Businesses          Entergy Nuclear
   30,000 MW electric          • 6 non-utility units owned at
   generating capacity           5 sites (5,000 MW)              Supply/Demand    Climate/Weather Data
                                                                                                                  Long Positions
   2nd largest U.S. nuclear    • 1 plant managed (800 MW)        Environment      Competitive Behavior
   generator                     45% of 07 earnings              Fuel Prices      Legislation/Regulation           Structured
                                                                                                                   Structured       Strict
   2.6 million customers         guidance midpoint               Credit Markets   Capital Markets                   Contracts
                                                                                                                    Contracts        Risk
   $10 billion revenues                                                                                                             Limits
   14,500 employees
                                                                             Rigorous                                Asset
                                                                                                                     Asset
                                                                             Analysis                             Development
                                                                                                                  Development
                                                                                                                  /Acquisitions
                                                                                                                  /Acquisitions
                                                                                              Portfolio
                                                                                              Portfolio
                                                                             Current         Management
                                                                                             Management
                                                                             Point of                          Asset
                                                                                                                Asset
                                                                              View                           Disposition
                                                                                                             Disposition

                                                                                                             Structured
                                                                                                             Structured
                                                                Business     Create                          Contracts
                                                                                                              Contracts
                                                                Business      Create
                                                                Strategy
                                                                Strategy     Options
                                                                             Options                        Short Positions

                                                                                                              Produce
                                                                                                              Produce
                                                                Driven by:                                   Products/
                                                                                                             Products/
                                                                Markets                                       Services
                                                                                                              Services
                                                                Skills                                                             Competitor/
Utility                               Non-Nuclear Wholesale                                                                          Industry
  5 electric utilities (5 regulators)                           Scale                         Operational
                                                                                              Operational      Achieve
                                                                                                               Achieve
                                      Assets                                                                                        Standards
  4 contiguous states – Arkansas,                               Scope                         Excellence
                                                                                              Excellence     Productivity
                                                                                                             Productivity
                                        1,500 MW non-
  Louisiana, Mississippi, Texas                                 Positions
                                        nuclear wholesale
  22,000 MW of generating capacity      capacity owned                                                         Manage
                                                                                                               Manage
  15,500 miles of transmission                                                                              Relationships
                                                                                                            Relationships
  lines
  55% of 07 earnings guidance
  midpoint (includes Parent &
  Other)
                                                                                                                                   Page 3
The Methodology Helps Answer the Question of Whether a
         Company Has Adequate Liquidity If …

     The company was suddenly downgraded below
     investment grade

  and

     Market prices instantaneously increased (or
     decreased)

                                                   Page 4
How to Calculate “S&P Liquidity Adequacy Ratio”?

 It’s the ratio of: Primary Liquidity / Potential Liquidity Demands

 Primary Liquidity
    Unrestricted Cash
    Unused and Available Credit Facilities
    Discretionary Gas/Oil Inventory

 Potential Liquidity Demands
    Assumes negative Mark-to-Market exposure (MtM) with hard credit
    thresholds would be collateralized with cash or Letters of Credit (LCs)
    if firm is downgraded. Any corporate guarantees assumed to be
    converted to cash or LCs
    Negative MtM associated with contracts with adequate assurance (soft
    trigger) is cash collateralized
    Current 30-day accounts payable are immediately paid
    Commercial paper with pay down terms in event of downgrade
    Static margin at exchanges and regional transmission organizations
    Triggers in various loans and contracts

                                                                              Page 5
How to Calculate “S&P Liquidity Adequacy Ratio”?

 Two Ratios
    CELA: Credit Event Liquidity Adequacy
    MCELA: Market & Credit Event Liquidity Adequacy
      Price stress by 15% for Year 1 and 20% or Years 2
      and beyond
      Same stress for all commodities
      Test under both increase and decrease; report the
      “worst case” outcome
 The objective is to have $1 in liquidity to cover
 every $1 in potential price-stressed liquidity
 demands
    This leads to a minimum ratio of 1.0x
    It would be more conservative to apply this minimum
    threshold to the MCELA ratio

                                                          Page 6
Liquidity Adequacy Ratios By Industry Sector*

S&P Liquidity Adequacy Ratio1, by Industry Sector (2005)2
                                                         Downgrade3
                                                         w/out Price         Downgrade3 with Price Stress5,
                                                        Stress, CELA4                 MCELA6
                         Sector                            (Median)          Median    Lowest       Highest
 Exploration and production                                  5.90             3.78       0.40         5.30
 Merchant energy                                             5.90             3.93    Not avail     Not avail
 Regulated electric utilities                                2.98             2.11       0.90         5.50
 Diversified                                                 2.07             1.46       0.55         3.75
 Utilities with large gas-marketing operations               1.23             1.09       0.75         1.85
 Integrated oil, midstream and refiners                      1.11             0.96    Not avail     Not avail
 1. Liquidity Adequacy Ratio = Liquidity / Potential Liquidity Demands. Objective is to exceed 1.0.
 2. Source: S&P, "S&P Survey Highlights Weakness in Liquidity Risk Management in the U.S. Energy
 Industry", 12-May-2005.
 3. Downgrade to any credit rating below investment grade or call for adequate assurance.
 4. CELA = Credit Event Liquidity Adequacy (Credit event only, no price stress)
 5. S&P Price Stress assumes 15% for first 12 months and 20% for Years 2 and beyond.
 6. MCELA = Market & Credit Event Liq. Adequacy (Credit event plus price stress)

         *Source: S&P, “S&P Survey Highlights Weaknesses in Liquidity Risk
         Management in the U.S. Energy Industry,” May 12, 2005.
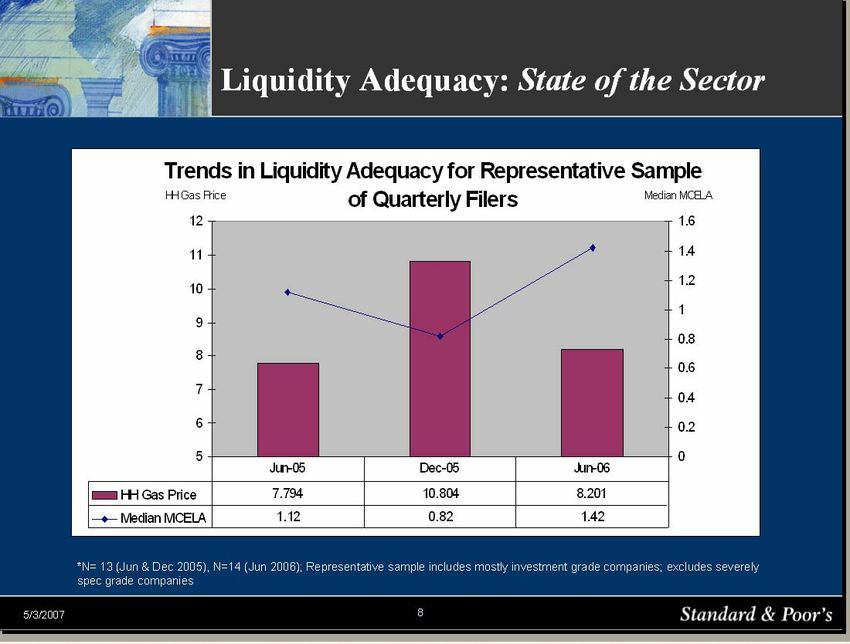
                                                                                                                Page 7
Trends in Liquidity Adequacy*

             *Source: Used by permission by Jeanny Silva, S&P
                                                          Page 8
S&P’s Perspective of Recent Liquidity Adequacy Trends*

    Average MCELA is up 16% relative to a year ago
    Average primary liquidity is up 25%
       Expanded bank lines account for most of improvement- up
       42%
       But unrestricted cash balances down 34%
    While average total credit exposure is up only 9%
       Increase in credit exposure mostly due to higher CP balances
       Average total net exposure (MTM+60 day, after netting) is
       actually down 4%
           MTM still dwarfs 60-day exposure (on average)
           Out-of-the money contracts are either rolling off or being
           replaced
    Collateral posted as % of total net exposure is only
    marginally up (2%)
       Counterparties have not reduced or otherwise modified
       contract credit terms
                                 *Source: Used by permission by Jeanny Silva, S&P
                                                                              Page 9
How Does S&P Incorporate Liquidity Adequacy Ratios
                in its Analysis*?

CELA and MCELA ratios are only part of the overall liquidity
  analysis. S&P also considers:

   Upcoming debt maturities
   Ability to tap capital markets
   Ability to work with counterparties/banks to re-negotiate
   collateral provisions or increase bank lines
   Flexibility to postpone planned capital expenditures
   Ability to exit one or more trading business lines if needed

                              *Source: Used by permission by Jeanny Silva, S&P
                                                                          Page 10
Some Additional S&P Feedback

As long as ratio is greater than 1.0x, S&P has traditionally not
addressed the ratio further with companies.
   The emphasis is larger for companies with trading, marketing and/or
   merchant activities
   More accepting of
Individual Companies Further Customize or Approach
   Liquidity Adequacy from their Own Perspective
  Informally surveyed firms on Philadelphia Utilities Index
  Most companies use both S&P ratio method but also customize for their
  needs
  Company A
     Created similar model 18 months before S&P first requested; focus on 95%
     confidence interval; now considering 99%
  Company B
     Customizing for worst exposure which increases as prices fall but load volumes
     increase. Uses 99% confidence interval. Instead of looking backwards, look
     forward over next 90 days. We set risk limits on this measurement and notify as
     needed.
  Company C
     Assume prices returns to historical peak levels plus two sigma accompanied by
     a fixed cash drain scenario
  Company D
     Stress is in 40-50% range. Covert all exposures to BCF Equivalent (BCF).
     Compare stressed liquidity demands against available headroom between
     primary liquidity and non-stress liquidity demands. Headroom must always be
     adequate, particularly during cash-flow “pinch point” months of January and
     July.

                                                                                       Page 12
Communicating to Upper Management
       to Enhance Decision Making

Easy to understand, easy to calculate
Directly links to discussions with Treasury and
Bankers
The “S&P” Good Housekeeping Label helps
Most companies interviewed report both S&P
ratio and customized ratios to their risk
committees and Board of Directors

                                                  Page 13
Different Graphical Presentation Approaches
   Fictional data, does not represent Entergy or any company, and provided for illustrative purposes only

S&P Liquidity Adequacy Ratio                                                                                                       Historical Liquidity Adequacy Ratio
Near-term liquidity / price-stressed margin calls                                                                                                   (Fictional Company Data)
                                                                                                                3.5
                                                                                                                                                                                                           Downgrade Only
                                                                                                                3.0                                                                                        (CELA)

                                                                                         S&P Liquidity Ratio
                                                                                                                2.5
                                                                                                                                                                                                           Downgrade &
                                                                                                                2.0                                                                                        Price Stress
                                                                                                                                                                                                           (MCELA)
                                                                                                                1.5
                                                                                                                1.0                                                                                        Target (= 1.0)

                                                                                                                0.5
                                                                                                                0.0
                                                                                                                      Qtr A Qtr B Qtr C Qtr D Qtr E Qtr F Proj Proj
                                                                                                                                                          Qtr F Qtr G
                                                                                                                                                        Date

                                                                                                                      Liquidity and Potential Demands (Stressed)
  Quarter A   Change in     Change in   Quarter B   Change in    Change in   Quarter C                                                             (Actual and Projections)
               Liquidity    Demands                  Liquidity   Demands

                                                                                                               80.0

                                                                                                               70.0

                                                                                                               60.0
                                                                                                               50.0                                                                                       Revolver (Avail)
                                                                                                                                       $50                                                                Cash
                                                                                                               40.0
                                                                                         $

                                                                                                                          $40                                        $45                                  MTM
                                                                                                                                                        $30                                  $30
                                                                                                               30.0                                                                    $35                60-Day Demands
                                                                                                               20.0              $15
                                                                                                                                                  $10
                                                                                                                                                               $15          $15
                                                                                                               10.0       $15
                                                                                                                                       $20              $20
                                                                                                                                                                     $15
                                                                                                                                                                                             $20
                                                                                                                                 $10              $10                                  $10
                                                                                                                                                                $5              $5
                                                                                                                0.0
                                                                                                                             A                B                 C                  D                  E
                                                                                                                          tr               tr                tr                 tr                 tr
                                                                                                                      Q                Q                 Q                 jQ                 jQ
                                                                                                                                                                         ro             P   ro
                                                                                                                                                                     P

                                                                                                                                                                                                                     Page 14
Sample of Some Industry Perspectives*

                  ☺
   Overall positive industry attitude
                                                                        &
                                                           Does S&P even use?
   Helped put liquidity on map, even                       S&P author did not mention
   among non-risk folks                                    liquidity adequacy in Top 10
   Does the job even if it is a bit                        utility issues
   quirky                                                  Volatility assumptions inverted
   Believes that there are more firms                      and too low
   fighting to be BB+ to avoid death                       Adequate assurance is not 100%;
   spirals                                                 more like 25-40% pay down
   Looking for vendors to help ease                        Some firms cannot gather data in
   calculation                                             order to calculate
   Commercial folks must identify or                       If focus on ratio, can drive
   acquire liquidity source before                         “wrong behavior” by increasing
   committing to new contracts                             liquidity to cover dangerous
   Great for “apples to apples”                            liquidity drains
   comparisons                                             Will S&P focus instead on new
                                                           PIM?

* Informal survey of integrated electric utilities listed in the Philadelphia Utility Index

                                                                                              Page 15
Summary

Relatively easy to calculate… can be customized
for internal analysis

Ratios differ according to underlying risk of
industry sector

Effective communication can enhance decision
making

Generally positive industry attitude even if
companies have not heard a lot of feedback from
S&P itself

                                                  Page 16
For More Information

    John Wengler
  Chief Risk Officer
Entergy Services, Inc.
    832-681-3367
jwengle@entergy.com

                         Page 17
You can also read