The Search for the Farthest Quasar: Consequences for Black Hole Growth and Seed Models - arXiv
←
→
Page content transcription
If your browser does not render page correctly, please read the page content below
MNRAS 000, 1–8 (2021)                           Preprint 3 November 2021             Compiled using MNRAS LATEX style file v3.0

                                              The Search for the Farthest Quasar: Consequences for Black
                                              Hole Growth and Seed Models
                                                  Fabio Pacucci1,2? , Abraham Loeb1,2
                                              1 Center   for Astrophysics | Harvard & Smithsonian, Cambridge, MA 02138, USA
                                              2 Black   Hole Initiative, Harvard University, Cambridge, MA 02138, USA
arXiv:2110.10176v2 [astro-ph.GA] 2 Nov 2021

                                              3 November 2021

                                              ABSTRACT
                                              The quest for high-redshift quasars has led to a series of record-breaking sources, with the current record holder at
                                              z = 7.642. Here, we show how future detections of z > 8 quasars impact the constraints on the parameters for black
                                              hole growth and seed models. Using broad flat priors on the growth parameters (Eddington ratio fEdd , duty cycle
                                              D, seed mass M•,seed and radiative efficiency ), we show that the large uncertainties in their determination decrease
                                              by a factor ∼ 5 when a quasar’s detection redshift goes from z = 9 to z = 12. In this high-redshift regime,  tends
                                              to the lowest value allowed, and the distribution for M•,seed peaks well inside the heavy seed domain. Remarkably,
                                              two quasars detected at z > 7 with low accretion rates (J1243+0100 and J0313–1806) already tighten the available
                                              parameter space, requiring M•,seed > 103.5 M and  < 0.1. The radiative efficiency is a crucial unknown, with
                                              factor ∼ 2 changes able to modify the predicted mass by ∼ 3 orders of magnitude already at z ∼ 9. The competing
                                              roles of inefficient accretion (decreasing ) and black hole spin-up (increasing ) significantly impact growth models.
                                              Finally, we suggest that yields currently predicted by upcoming quasar surveys (e.g., Euclid) will be instrumental
                                              for determining the most-likely seed mass regime. For example, assuming thin-disk accretion, a detection of a quasar
                                              with M• ∼ 1010 M by z ∼ 9 − 10 would exclude the entire parameter space available for light seeds and dramatically
                                              reduce the one for heavy seeds.
                                              Key words: black hole physics – methods: statistical – galaxies: active – quasars: general – early Universe – surveys

                                              1 INTRODUCTION                                                    the growing issue was pointed out by Haiman & Loeb (2001)
                                                                                                                with the detections of the first z ∼ 6 quasars (Fan et al.
                                              The last half century in the search for high-z quasars has led
                                                                                                                2001).
                                              to a chain of detections, constantly breaking the record for
                                              the farthest one (e.g., Fan et al. 2001, 2003; Mortlock et al.       The problem of how to form these SMBHs quickly enough
                                              2011; Wu et al. 2015; Bañados et al. 2018; Yang et al. 2020;      to match these observations remains open. The first popu-
                                              Wang et al. 2021). Quasars are powered by super-massive           lation of black holes, commonly referred to as black hole
                                              black holes (SMBHs) with mass & 109 M , typically accret-         seeds, likely formed around the cosmic time when also the
                                              ing at rates comparable to the Eddington limit, i.e. the rate     first population of stars (Pop III) were born, at z ∼ 20−30, or
                                              at which the outward radiation acceleration balances the in-      ∼ 200 Myr after the Big Bang (Barkana & Loeb 2001). This
                                              ward gravitational acceleration. Currently, the record for the    would leave ∼ 500 Myr of cosmic time from the formation
                                              highest redshift quasar is held by J0313–1806, a source at        of the first seeds to the observation of the currently farthest,
                                              z = 7.642 powered by a SMBH of (1.6±0.4)×109 M (Wang              fully-fledged SMBHs (Loeb & Furlanetto 2013). Depending
                                              et al. 2021). Based on its redshift, J0313–1806 is shining a      on their initial mass, seeds are commonly categorized into
                                              mere ∼ 680 Myr after the Big Bang. The detection of farther       light seeds and heavy seeds, with typical mass M• ∼ 102 M
                                              quasars is putting a significant strain on the standard theory    and M• ∼ 105 M , respectively (see, e.g., Inayoshi et al. 2020
                                              of black hole growth (see, e.g., Woods et al. 2019; Inayoshi      and references therein).
                                              et al. 2020 for recent reviews), as it is becoming increasingly     Forming a ∼ 109 M SMBH by z ∼ 7 from a light seed is
                                              challenging to build up & 109 M SMBHs in time to match            very challenging, unless periods of super-Eddington or hyper-
                                              high-z observations. This problem with high-z quasars was         Eddington accretion rates can be sustained by the growing
                                              explored already by Turner (1991), when the highest redshift      black hole (e.g., Begelman 1978; Wyithe & Loeb 2012; In-
                                              quasars were detected merely at 4 < z < 5. More forcefully,       ayoshi et al. 2016; Begelman & Volonteri 2017; Alexander
                                                                                                                & Natarajan 2014; Pacucci et al. 2017; Natarajan 2021).
                                                                                                                Note that while super-Eddington accretion rates are typi-
                                              ?   fabio.pacucci@cfa.harvard.edu                                 cally of the same order of magnitude of the Eddington rate,

                                              © 2021 The Authors
2 F. Pacucci & A. Loeb
hyper-Eddington episodes can reach hundreds or even thou- to-date accretion rate distributions of high-z quasars (Fan
sands times larger values, due to photon trapping conditions et al. 2019b).
quenching the effect of radiation pressure on the infalling
gas (Wyithe & Loeb 2012; Inayoshi et al. 2016; Begelman
& Volonteri 2017). 2 THEORY
Formation mechanisms for heavy seeds started to being
developed at the turn of the century in order to jump-start First we describe the simple growth model used along with
the growth process and possibly ease the challenges of form- the Monte Carlo simulations performed.
ing quasars by z ∼ 6. Typically, they are formed by one of
the following mechanisms. First, a monolithic collapse of a
2.1 Black Hole Growth Model
pristine gas cloud in atomic cooling halos, where the cool-
ing action of hydrogen molecules is quenched by some irra- We begin by defining the most important parameters of the
diation/heating mechanisms (Loeb & Rasio 1994; Bromm & growth model. A black hole seed of initial mass M•,seed is
Loeb 2003; Lodato & Natarajan 2006), possibly undergoing seeded at z = 25, corresponding to a cosmic time tseed = 130
to a short-lived phase of super-massive star (Loeb & Rasio Myr. We calculate the mass M• at cosmic time t with the
1994; Hosokawa et al. 2013). These seeds are typically in the well-known formula:
intermediate mass range 105−6 M . Second, runaway colli-
1 − ∆t
sions and mergers of either Pop III stars (Portegies Zwart M• (t) = M•,seed exp fEdd D . (1)
tEdd
& McMillan 2002; Katz et al. 2015; Boekholt et al. 2018)
or black holes in a dense gaseous environment (Davies et al. The accretion time (also known as the lifetime of the
2011; Lupi et al. 2016). These seeds are typically in the mass quasar, see, e.g., Eilers et al. 2021) is defined as ∆t = t−tseed ,
range 103−4 M . while the Eddington time tEdd ≈ 450 Myr is a combination of
As future telescopes will enable deeper surveys of high-z constants. The Eddington ratio fEdd is defined as the ratio
quasars (e.g., Euclid, the Roman Space Telescope, Lynx, the between the actual mean accretion rate and the mean Ed-
James Webb Space Telescope), it is a prime time to discuss dington accretion rate over the time interval ∆t. As the black
the implications of future detections of quasars at z > 8 on hole mass increases, also its instantaneous Eddington accre-
growth and seed models of black holes. Note that the first tion rate increases as ṀEdd ∝ M• . The duty cycle D is the
data release of Euclid is predicted to yield between 13 and fraction of the time ∆t spent accreting. Note that in Eq. (1)
25 quasars in the redshift range 7 < z < 9, depending on the quantities fEdd and D are degenerate: the same final mass
the rate of decrease of the spatial density of quasars as a can be obtained by appropriately rescaling the two growth
function of redshift (e.g., Euclid Collaboration et al. 2019; parameters by a factor. Finally, is the mean radiative effi-
Fan et al. 2019a). This decrease is estimated from observa- ciency factor over the time ∆t. The radiative efficiency factor
tions at lower redshift, typically 4 . z . 6 (McGreer et al. determines the fraction of the accretion energy per unit time,
2013; Jiang et al. 2016), and then the linear extrapolation at Ṁ c2 , that is converted into radiative luminosity: L = Ṁ c2 .
z & 7 is used to compute yields (Euclid Collaboration et al. For thin disk accretion, the value of varies between 5.7% for
2019). Depending on the steepness of the density decrease, non-rotating black holes to 32% for maximally rotating black
the farthest M• & 109 M quasar in the observable Universe holes (see Bardeen 1970 and the discussion in, e.g., Fabian &
is currently estimated to be found between z = 9 and z = 12 Lasenby 2019; Pacucci & Loeb 2020).
(Ben-Ami et al. 2018; Fan et al. 2019a).
The highest redshift at which we can observe a M• & 109
2.2 Monte Carlo Simulations
SMBH is crucially important to constrain the fundamental
parameters of black hole growth, as well as the typical seed We perform Monte Carlo simulations of the growth of black
mass required. In this paper, we discuss the implications of holes using Eq. 1 as the target function. We fix the seeding
the detection redshift of the “farthest quasar in the Universe”. redshift z = 25 corresponding to a tseed = 130 Myr. Accord-
Before delving into the description of the theoretical model ing to the latest high-z surveys (McGreer et al. 2013; Jiang
in §2 and the results in §3, a discussion of what we mean et al. 2016; Wang et al. 2019; Fan et al. 2019a), the space
by “farthest quasar” is warranted. Of course, black holes of density of quasars is rapidly declining above z ∼ 6 and the
small mass and accreting at low rates should exist at redshifts farthest quasar in the Universe with M• & 109 M should be
z
7, possibly at z ∼ 20 − 30 (Barkana & Loeb 2000), even observable between z = 9 and z = 12 (see, e.g., Fig. 1 in Fan
if they will not observable in the foreseeable future. These et al. 2019a and the discussion in Euclid Collaboration et al.
smaller, slowly accreting black holes are not necessarily to be 2019). Of course, these estimates are based on extrapolations
considered “quasars”. Previous studies (e.g., Fan et al. 2019a; from quasar luminosity functions at lower redshifts, and may
Wang et al. 2019) predict that the highest-redshift quasar be a poor description of the earlier Universe. Here, in line
observable should be at z ∼ 9, defining quasar as a SMBH with current predictions, we consider detection redshifts for
with mass M• > 109 M . This definition is supported by quasars between z = 9 and z = 12. Also, consider that with a
current observations, as we are only able to observe SMBHs seeding at z = 25, an observation at z = 9 would correspond
on that mass scale at z & 7. Our study, though, deals with to a time ∆t ∼ 450 Myr, equal to the e-folding Eddington
future observations of SMBHs at z > 7, which may probe time.
mass scales much lower than ∼ 109 M . Hence, in this study, We consider a growth model for the Monte Carlo simulation
“farthest quasar” is intended, more broadly, as the highest- described by four parameters: [ fEdd , D, , M•,seed ]. Note that
redshift SMBH with mass M• > 106 M and accreting at the seed mass is by definition a constant over ∆t (i.e., the
rates larger than 10% of their Eddington rate, based on up- black hole is seeded only once). D is the fraction of ∆t spent
MNRAS 000, 1–8 (2021)The Search for the Farthest Quasar 3
accreting, while fEdd and can vary during ∆t. Hence, the
values of fEdd and should be considered as averages over
the total time ∆t between seeding and detection.
We divide the redshift range 9 < z < 12 into 10 bins and
for each detection redshift zdet we study the distribution of
103 realizations of the growth model that allow the forma-
tion of a 109 M black hole in a time equal or shorter than
the cosmic time between the seeding redshift z = 25 and
zdet . We then save the combinations of “successful” growth
parameters [ fEdd , D, , M•,seed ]. The mass 109 M was cho-
sen as representative of typical masses of quasars found at
z > 6 (Inayoshi et al. 2020).
In our baseline analysis, we consider the following priors
on the four parameters. The duty cycle has a flat prior:
D ∈ [0, 1]. The radiative efficiency factor has a flat prior
within its physically meaningful range: ∈ [0.057, 0.32]. Light
seed masses have a flat prior in the logarithm of the mass
range: Log10 M•,L ∈ [0, 3], while heavy seed masses have a flat
prior in the logarithm of the mass range: Log10 M•,H ∈ [3, 6]
(e.g., Inayoshi et al. 2020). Note that these ranges are very
generous, as typical masses for light and heavy seeds are
∼ 102 M and 105 M , respectively. Finally, the Eddington
ratio prior distribution is the most critical. While episodes
of super-Eddington or even hyper-Eddington accretion likely
occurred (Inayoshi et al. 2016; Begelman & Volonteri 2017) at
z > 6, with Eddington ratios of the order of even 100 − 1000,
choosing a prior distribution of fEdd that includes such ex-
treme values would be unwise for two reasons: (i) hyper-
Eddington accretion episodes are short-lived, with typical du-
ration times of ∼ 0.1 Myr (Inayoshi et al. 2016), hence the
mean would be much lower; (ii) choosing an upper limit on
the prior distribution that is too large would artificially push
the final distribution to the large values, in order to form the
SMBHs in time. Hence, we choose a flat prior fEdd ∈ [0, 1] as
well. This choice is supported by observations: high-z quasar
surveys have found typical distributions of Eddington ratios
distributed as a lognormal with a peak at fEdd ∼ 1.07 and
a standard deviation of 0.28 dex (Willott et al. 2010). This
distribution of Eddington ratios is, by definition, at detec-
tion: this does not imply that the SMBH was accreting at
similarly large accretion rates for its entire history between
seeding and observation. Limitations and caveats of this ap-
proach are discussed more broadly in §4.
The Monte Carlo simulations and Eq. (1) are used in two
separate settings, whose results are described in turn in §3.1
and §3.3. In the first kind of analysis, we fix a final mass at
the detection redshift zdet and investigate the probability dis-
tributions of parameters that can reproduce that observation, Figure 1. Statistical distributions (2D joint in the lower half and
along with the accuracy with which they can be determined. 1D marginalized in the diagonal) of the sets of fedd , D, , M•,seed
This analysis is also applied in §3.2 to discuss constraints from that can produce at least a 109 M SMBH by the detection redshift
current detections. In the second kind of analysis, we leave zdet , with zdet = 9, 12.
the final mass at the detection redshift as a free parameter,
and investigate the maximum mass achievable as a function
of z, starting from different models of black hole seeds and achievable in different seeding models and accretion condi-
radiative efficiencies. tions (§3.3).
3.1 Determination of Growth Parameters
3 RESULTS
The parameter space [ fEdd , D, , M•,seed ] that allows the for-
Next we present the results of our study, concerning the deter- mation of a M• ≥ 109 M black hole at a given detection
mination of the growth parameters with redshift (§3.1), its redshift zdet is shown in Fig. 1, for redshifts z = 9, 12, the ex-
application to current data (§3.2), and the maximum mass treme values of the current redshift range where the farthest
MNRAS 000, 1–8 (2021)4 F. Pacucci & A. Loeb
z=6 z=9 z = 12 6
fEdd 0.81 ± 0.15 0.88 ± 0.10 0.96 ± 0.03
Median with IQR as confidence interval
D 0.81 ± 0.14 0.88 ± 0.1 0.96 ± 0.03 5
0.08 ± 0.02 0.07 ± 0.01 0.060 ± 0.002
4
Eddington ratio (fEdd)
M•,seed 4.49 ± 1.33 5.34 ± 0.57 5.84 ± 0.13 Duty Cycle ( )
3 Radiative Efficiency ( )
Log10 Seed Mass (Mseed)
J0313-1806
Table 1. Statistical descriptors of the distributions shown in Figs.
1 and, as a comparison, for zdet = 6. The values are reported as 2
mean ± standard deviation. The value of M•,seed is expressed as
Log10 . 1
M• & 109 M detectable quasar should be located (Fan et al. 0
6 7 8 9 10 11 12
2019a; Euclid Collaboration et al. 2019). Redshift
A statistical description of the distribution, for zdet = 9 and 0.5
zdet = 12, as shown in Fig. 1, and at zdet = 6 for comparison,
is provided in Table 3.1. Each distribution is described with
a set of mean ± standard deviation. 0.4
J0313-1806
From these results it is apparent that the uncertainties
Relative error: IQR/Median
in the determination of the growth parameters are rapidly
shrinking with increasing detection redshift. In particular, the 0.3 Eddington ratio (fEdd)
standard deviations are typically reduced by a factor 10 in Duty Cycle ( )
shifting from zdet = 6 to zdet = 12, and by a factor ∼ 5 merely Radiative Efficiency ( )
0.2 Seed Mass (Mseed)
from zdet = 9 to zdet = 12. The Eddington ratio and duty cy-
cle are fully degenerate and tend to values ∼ 1 at the highest
detection redshifts. The radiative efficiency tends to values
close to the limit for thin-disk, non rotating black holes, i.e. 0.1
= 0.057, while the seed mass very significantly tends to the
heavy seed mass range, with Log10 M•,seed = 5.84 ± 0.13 at
the highest detection redshift. 0.0
6 7 8 9 10 11 12
It is important to note that this simple model is based on Redshift
very generous flat priors and does not rely on any cross depen-
dency between the parameters. For example, a determination
Figure 2. Top panel: Typical values of the growth parameters,
that high-z quasars have large spins, possibly generated by
along with their uncertainties shown as an inter-quartile range
stable accretion via a disk, would dramatically reduce the (IQR). Bottom panel: Relative errors (IQR/median value) in
parameter space of the radiative efficiency, leading to values the estimates of the growth parameter. Both are reported as a
closer to ∼ 0.32. This would, in turn, shift the accept- function of the detection redshift.
able ranges for other parameters significantly. A discussion
of some of these cross dependencies in provided in §4.
The typical values of the parameters, along with their un- the allowed parameter space, it is already possible to draw
certainties reported as an inter-quartile range (IQR), are some conclusions. For example, Fig. 3 shows that seed masses
shown in the left panel of Fig. 2. The IQR was chosen instead M•,seed . 103 are disfavored. Note that large values of the
of the standard deviation because some of the distributions accretion efficiency > 0.1 are already disfavored, while inter-
are skewed around the median. mediate values of fEdd ∼ 0.5 and D ∼ 0.5 are still acceptable,
The relative errors (IQR/median value) in the estimates of although statistically disfavored.
the growth parameter, as a function of the detection redshift, Several quasar detections come with an estimate of the
are shown in the top panel of Fig. 2. The relative errors de- Eddington ratio fEdd , which can be used as a prior in our
crease in a similar manner by a factor ∼ 5 from zdec = 6 to model to gain further insights into the remaining parameters.
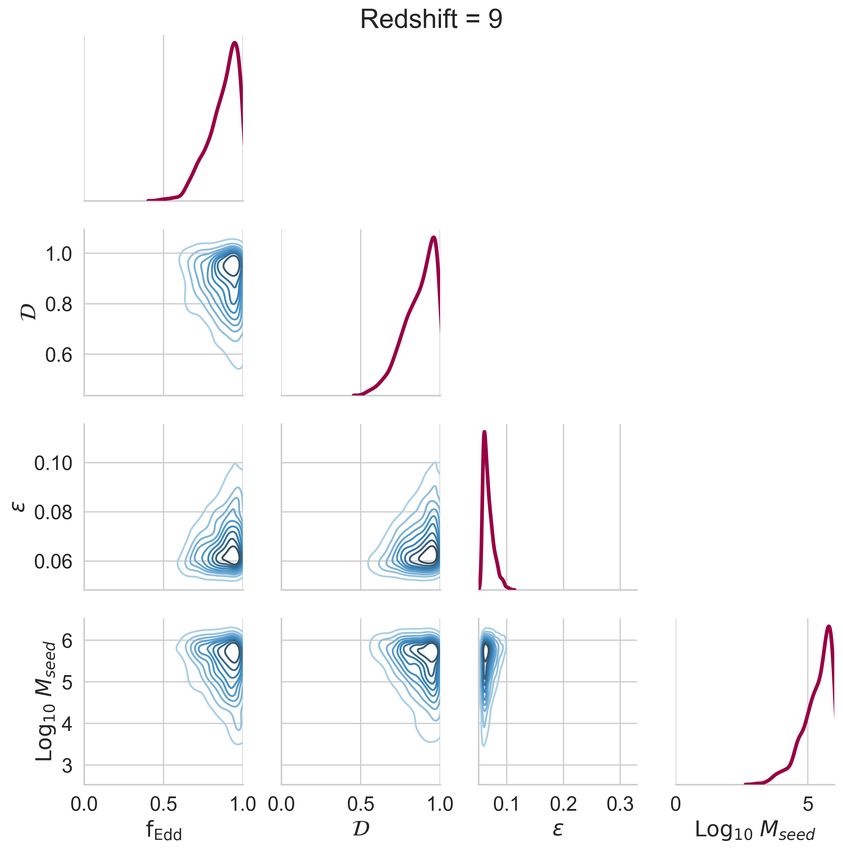
zdec = 12. This analysis shows that, even with a blind and un- Assuming for simplicity of representation D = 1, in Fig. 4
constrained search of the growth parameter space, the detec- we show the results of this analysis. We display the kernel
tion of quasars between z = 9 and z = 12 would significantly density estimate (KDE) and marginal distributions of and
increase the accuracy in our estimates of such parameters. M•,seed for eight quasars detected at z > 7 (Mortlock et al.
2011; Wang et al. 2018; Bañados et al. 2018; Matsuoka et al.
2019a,b; Yang et al. 2019, 2020; Wang et al. 2021). Note
3.2 Constraints from Current Detections
that this same dataset was used in Vagnozzi et al. (2021) to
In Fig. 3 we provide the same statistical analysis as in Fig. estimate the ages of the oldest objects in the Universe.
1, but for the current farthest quasar detected (Wang et al. As expected, most of these detections are still at low red-
2021) at z = 7.642 and with mass M• = 1.6 × 10⁹ M . shift and cannot tightly constrain the parameter space. For
While the detection redshift is still low to significantly tighten example, in some cases the seed mass ranges from ∼ 10 to
MNRAS 000, 1–8 (2021)The Search for the Farthest Quasar 5
Redshift = 7.642
Quasar ID
6 J1342+0928
J1243+0100
1.0 J1120+0641
J0038+1527
0.8 J0252+0503
5 J2356+0017
0.6 J1007+2115
0.4 J0313 1806
Log10 Mseed
4
0.125
0.100
0.075 3
0.050
6 2
Log10 Mseed
4
2
1
0.0 0.5 1.0 0.0 0.5 1.0 0.1 0.2 0.3 0 5
fEdd Log10 Mseed 0.04 0.06 0.08 0.10 0.12 0.14 0.16 0.18 0.20
Figure 3. As in Fig. 1, but for the currently highest-redshift
quasar detected, with M• = 1.6 × 10⁹ M and zdet = 7.642. The Figure 4. Kernel density estimate (KDE) and marginal distribu-
detection redshift is already sufficiently high to discard some areas tions for and M•,seed for eight quasars detected at z > 7 and
of the parameter space. with estimated values of the fEdd , which are used as priors. This
plot assumes, for simplicity of representation, D = 1.
∼ 106 M , and the radiative efficiency reaches values up to
mination of the probability distribution of , which will likely
∼ 0.15.
come from higher redshift detections (see §3.1), is of primary
Interestingly, the two quasars J1243+0100 and J0313–1806
importance.
show much tighter parameter spaces, because their estimated
Some of the current z > 6 detections of quasars, shown
Eddington ratios are fEdd = 0.34 ± 0.2 (Matsuoka et al.
as black circles in Fig. 5, already rule out several models
2019a) and fEdd = 0.67 ± 0.14 (Wang et al. 2021), re-
of growth. For example, a light seed mass ∼ 102 M with
spectively. These quasars are accreting at lower Eddington
continuous Eddington accretion is currently ruled out for any
rates (i.e., at a slower pace), and this significantly tight-
> 0.07. Note that, using the dimensionless spin parameter
ens the allowed parameter space, with M•,seed > 105 M for
0 < a < 1 (a = 0 for a non-rotating black hole and a = 1
J1243+0100 and M•,seed > 103.5 M for J0313–1806, while
for a maximally rotating black hole), the previous lower limit
also requiring lower radiative efficiencies . 0.1. Remark-
sets a limit on the typical SMBH spin for thin-disk accretion:
ably, the detection of additional quasars with low values of
a > 0.3.
fEdd will also tighten the available parameter space, without
Data for the ∼ 200 detected quasars at z > 6 is obtained
requiring the very high redshifts necessary for sources accret-
from Inayoshi et al. (2020) and integrated with recent detec-
ing at fEdd ∼ 1.
tions, i.e., Yang et al. (2020); Wang et al. (2021). The light
shaded region indicates the approximate maximum mass ob-
servable in quasars that are radiating energy via their accre-
3.3 Maximum Black Hole Mass: Dependence on
tion disk (King 2016; Inayoshi & Haiman 2016), while the
Seed Models and Radiative Efficiency
black shaded region indicates an absolute upper limit on the
In Fig. 5 we show the maximum mass achievable by a mass reachable by an accreting black hole at a given redshift.
black hole seeded at z = 25, assuming continuous (D = 1) It is obtained by calculating at each z the maximum mass of
Eddington-limited ( fEdd = 1) accretion. We consider two a dark matter halo whose number density is equal to 1/V (z),
seeding scenarios: (i) “All seeds” includes light and heavy with V (z) being the comoving volume of the Universe at that
seeds up to a typical mass 105 M , while (ii) “Light seeds redshift. We assume a Sheth-Mo-Tormen (Sheth et al. 2001)
only” includes only light seeds up to a typical mass 102 M . halo mass function and a full-sky survey with 4π steradians of
The growth lines sharing the same color but different trans- coverage. This mass is then converted into baryons assuming
parency levels describe accretion scenarios with varying ra- a baryonic fraction fb = 0.15. The maximum mass is obtained
diative efficiencies, from = 0.057 (no transparency) up to assuming that the black hole is able to accrete the baryonic
= 0.1 (maximum transparency), in ten steps. Even a change mass of its host in its entirety, in what is a very solid upper
by a factor < 2 in the radiative efficiency can have dramatic limit.
consequences on the predicted mass growth, up to ∼ 3 orders The two vertical, dashed lines show the current predictions
of magnitude by detection redshift zdet = 9. A better deter- (Fan et al. 2019a; Wang et al. 2019; Euclid Collaboration
MNRAS 000, 1–8 (2021)6 F. Pacucci & A. Loeb
11 4 DISCUSSION AND CONCLUSIONS
Maximum mass of observable quasars
(Inayoshi & Haiman 2016, King 2016) The highest-redshift quasar currently stands at z = 7.642,
10 with a typical mass ∼ 109 M (Wang et al. 2021). In this pa-
per we studied how the detection of higher-redshift quasars,
k=-0.78
k=-0.50
which will most likely occur with upcoming surveys (e.g., Fan
Log10(M , max) [M ]
9 et al. 2019a; Wang et al. 2019; Euclid Collaboration et al.
2019), will shed light on the growth parameters involved in
high-z black hole growth, as well as enhancing our knowledge
8 on the mass distribution of seeds. We quantified how, as the
time between seeding and observation is reduced with increas-
ing detection redshift, the combination of growth parameters
7 that can give rise to a specific black hole mass shrinks signif-
All seeds icantly. Hence, upcoming z > 7 quasars surveys will play a
Light seeds only crucial role in the determination of the allowable parameter
6 space for black hole growth.
6 7 8 9 10 11 12 13 14
Redshift It is important to point out that the broad range of our
flat priors are not due to lack of complexity in our model,
but reflect the real uncertainties in this field. The primary
Figure 5. Maximum mass achievable by a black hole seeded at
z = 25 which undergoes continuous Eddington-limited accretion.
goal of our study is to show how these uncertainties will be
Red lines: the seed mass is within the light seeds regime, i.e. ∼ reduced by higher-redshift detections.
102 M . Blue lines: the seed population also includes heavy seeds, Obviously, there are caveats and limitations to our study.
with mass ∼ 105 M . The different levels of transparency show the First, we assume that the growth parameters are constant
radiative efficiency assumed, from = 0.057 (no transparency) to from seeding to detection redshift. As discussed in §2.2, this
= 0.1 (maximum transparency). The black circles indicate the is equivalent to consider them as averages of variable param-
∼ 200 quasars at z > 6 known so far. The vertical, dashed lines eters over the growth time. While a reasonable assumption,
show the current redshift range for the farthest M• & 109 M
the average is not representative of extreme values which can
quasar observable by future surveys, while the shaded regions on
occur in the parameter space and that can speed up or ham-
top show the current limits for the maximum mass of a black hole
observable (see text for a detailed description). per the growth. A distribution of randomly changing param-
eters, possibly with a frequency matched to some fraction of
the Eddington time, would be more realistic, but any choice
of this type would be even more arbitrary than considering
time averages. For this reason, we stand by our choice to
consider averages of [ fEdd , D, , M•,seed ] as a good represen-
et al. 2019) for the farthest M• & 109 M quasar observ- tation of the growth process over timescales comparable to
able assuming a rate of quasar volume density decrease with the Eddington time. Second, in Fig. 5 we showed how the
redshift k, i.e. ρQSO = 10−kz . These limits show any detec- maximum mass achievable depends strongly on the radia-
tion of z > 9 quasars in future surveys will provide crucial tive efficiency of the accretion process. For example, a mere
insights in shrinking the parameter space for growth param- change in the radiative efficiency parameter by a factor 2
eters available. In particular, a detection of a quasar with could change the maximum mass achievable by ∼ 3 orders
M• ∼ 1010 M by z ∼ 9 − 10 would exclude entirely the of magnitude by z ∼ 9 in the light seeds only scenario. In
parameter space available for light seeds and dramatically this study we considered only a standard thin disk accretion,
reduce the one for massive seeds (unless we account for con- with values for ranging between 0.057 and 0.32 (Bardeen
tinuous accretion in highly radiative inefficient scenarios, i.e. 1970; Fabian & Lasenby 2019). Alternative scenarios have
< 0.057, see §4). been proposed in highly inefficient accretion flows, where the
It is worth noting that future high-z quasar surveys (e.g., radiative efficiency is even lower. For example, in the slim
Euclid and the Large Synoptic Survey Telescope, or LSST) disk scenario (Mineshige et al. 2000; Volonteri et al. 2015;
may have the sensitivity to detect quasars with masses Pacucci et al. 2015) a typical radiative efficiency of = 0.04
down to 107−8 M , further constraining their demograph- is achieved for black holes accreting at fedd ∼ 50. With a con-
ics. Nonetheless, extreme SMBHs with masses & 109 M un- stant Eddington-limited accretion from z = 25, a light black
doubtedly play a more significant role in shrinking the pa- hole seed with such a radiative efficiency would grow to a
rameter space available for the growth parameters. In fact, mass in excess of 1010 M by the detection redshift z = 9.
statistical distributions, such as those in Fig. 1, obtained For all these reasons, investigating the typical radiative ef-
for the formation of a 108 M and a 107 M SMBH by the ficiency of high-z accretion lays at the basis of any of our
same redshift have typical standard deviations ∼ 35% and attempts to constrain growth parameters and seeding mod-
∼ 70% larger, respectively. For example, the detection of a els for black holes. While large quantities of gas in the high-
M• ∼ 107−8 M quasar by z ∼ 9 would still broadly allow z Universe would favor inefficient accretion flows and lower
a seed mass of M•,seed ∼ 103 M and Eddington ratios and values of the radiative efficiency (e.g., Begelman & Volonteri
duty cycles as low as ∼ 0.5. On the contrary, the detection 2017), a stable accretion via a disk would spin up the black
of the same lower-mass quasars at z ∼ 12 would more sig- hole (e.g., Berti & Volonteri 2008), leading to an increase of
nificantly constrain the parameter space, with a seed mass the radiative efficiency and hampering the growth (Novikov
M•,seed & 104.5 now strongly favored. & Thorne 1973). The interplay between these two factors in
MNRAS 000, 1–8 (2021)The Search for the Farthest Quasar 7
shaping the growth history of early black holes remains to be REFERENCES
seen.
Alexander T., Natarajan P., 2014, Science, 345, 1330
Future quasar surveys will be fundamental to study the Bañados E., et al., 2018, Nature, 553, 473
parameter space available for growth and seeding models. Bardeen J. M., 1970, Nature, 226, 64
Gravitational lensing, by magnifying the light of extremely Barkana R., Loeb A., 2000, ApJ, 531, 613
faint sources above the flux limit, will enhance our chances Barkana R., Loeb A., 2001, Phys. Rep., 349, 125
of detecting very early SMBHs (Fan et al. 2019b; Pacucci & Begelman M. C., 1978, MNRAS, 184, 53
Loeb 2019). While the predicted yields of quasar surveys sug- Begelman M. C., Volonteri M., 2017, MNRAS, 464, 1102
gest that the farthest detectable quasar with M• & 109 M Ben-Ami S., Vikhlinin A., Loeb A., 2018, ApJ, 854, 4
will be somewhere between z = 9 and z = 12, these predic- Berti E., Volonteri M., 2008, ApJ, 684, 822
tions are based on extrapolations and may reserve surprises. Boekholt T. C. N., Schleicher D. R. G., Fellhauer M., Klessen R. S.,
What if the spatial density of quasars decreases much more Reinoso B., Stutz A. M., Haemmerlé L., 2018, MNRAS, 476,
366
rapidly than predicted, and we observe the highest-redshift
Bromm V., Loeb A., 2003, ApJ, 596, 34
quasar by z ∼ 8? This would push to relaxing some of the Carr B., Silk J., 2018, MNRAS, 478, 3756
requirements for building high-z black holes, leaving much of Davies M. B., Miller M. C., Bellovary J. M., 2011, ApJ, 740, L42
the parameter space still available. Even more interestingly, Eilers A.-C., Hennawi J. F., Davies F. B., Simcoe R. A., 2021, ApJ,
what if the spatial density decreases much more slowly, or 917, 38
even reaches a plateau? This instance would require a full re- Euclid Collaboration et al., 2019, A&A, 631, A85
view of the bottom-up paradigm of black hole growth, seeking Fabian A. C., Lasenby A. N., 2019, arXiv e-prints, p.
alternative models that are able to create already very mas- arXiv:1911.04305
sive black holes at high-z (e.g., primordial black holes, Carr Fan X., et al., 2001, AJ, 122, 2833
& Silk 2018). Fan X., et al., 2003, AJ, 125, 1649
Obscured accretion phases in z & 7 quasars may signifi- Fan X., et al., 2019a, BAAS, 51, 121
Fan X., et al., 2019b, ApJ, 870, L11
cantly impede (or bias) their observations. For example, Ni
Haiman Z., Loeb A., 2001, ApJ, 552, 459
et al. (2020), using the BlueTides cosmological simulations,
Hosokawa T., Yorke H. W., Inayoshi K., Omukai K., Yoshida N.,
predict that large fractions (60% to 100%) of z > 7 quasars 2013, ApJ, 778, 178
with X-ray luminosity LX > 1043 erg s−1 may be heavily ob- Inayoshi K., Haiman Z., 2016, ApJ, 828, 110
scured (i.e., with a column density in excess of 1023 cm−2 ). Inayoshi K., Haiman Z., Ostriker J. P., 2016, MNRAS, 459, 3738
Additionally, they find that > 99% of z > 7 quasars are dust Inayoshi K., Visbal E., Haiman Z., 2020, ARA&A, 58, 27
extincted and, hence, non detectable in ultraviolet surveys. Jiang L., et al., 2016, ApJ, 833, 222
If obscuration indeed reduces the yields of future surveys, it Katz H., Sijacki D., Haehnelt M. G., 2015, MNRAS, 451, 2352
may also push the “farthest detectable quasar” to lower red- King A., 2016, MNRAS, 456, L109
shifts. In this case, growth models will need to rely on gravi- Lodato G., Natarajan P., 2006, MNRAS, 371, 1813
tational waves observations to detect higher-redshifts SMBHs Loeb A., Furlanetto S. R., 2013, The First Galaxies in the Universe.
Princeton University Press
(Ricarte & Natarajan 2018; Pacucci & Loeb 2020).
Loeb A., Rasio F. A., 1994, ApJ, 432, 52
In one way or another, future quasar surveys will inevitably
Lupi A., Haardt F., Dotti M., Fiacconi D., Mayer L., Madau P.,
push the boundaries of the unknown and reveal some of the 2016, MNRAS, 456, 2993
mysteries that still surround the growth and early years of Matsuoka Y., et al., 2019a, ApJ, 872, L2
these cosmic giants. Matsuoka Y., et al., 2019b, Astrophys. J., 883, 183
McGreer I. D., et al., 2013, ApJ, 768, 105
Mineshige S., Kawaguchi T., Takeuchi M., Hayashida K., 2000,
PASJ, 52, 499
ACKNOWLEDGEMENTS Mortlock D. J., et al., 2011, Nature, 474, 616
The authors thank Xiaohui Fan for insightful comments on Natarajan P., 2021, MNRAS, 501, 1413
Ni Y., Di Matteo T., Gilli R., Croft R. A. C., Feng Y., Norman
the manuscript, as well as inspiring discussions with Tyrone
C., 2020, MNRAS, 495, 2135
Woods. We also thank the anonymous referee for construc-
Novikov I. D., Thorne K. S., 1973, in Black Holes (Les Astres
tive comments on the manuscript. F.P. acknowledges support Occlus). pp 343–450
from a Clay Fellowship administered by the Smithsonian As- Pacucci F., Loeb A., 2019, ApJ, 870, L12
trophysical Observatory. This work was partly performed at Pacucci F., Loeb A., 2020, ApJ, 895, 95
the Aspen Center for Physics, which is supported by National Pacucci F., Volonteri M., Ferrara A., 2015, MNRAS, 452, 1922
Science Foundation grant PHY-1607611. The participation of Pacucci F., Natarajan P., Volonteri M., Cappelluti N., Urry C. M.,
F.P. at the Aspen Center for Physics was supported by the 2017, ApJ, 850, L42
Simons Foundation. This work was also supported by the Portegies Zwart S. F., McMillan S. L. W., 2002, ApJ, 576, 899
Black Hole Initiative at Harvard University, which is funded Ricarte A., Natarajan P., 2018, MNRAS, 474, 1995
by grants from the John Templeton Foundation and the Gor- Sheth R. K., Mo H. J., Tormen G., 2001, MNRAS, 323, 1
don and Betty Moore Foundation. Turner E. L., 1991, AJ, 101, 5
Vagnozzi S., Pacucci F., Loeb A., 2021, arXiv e-prints, p.
arXiv:2105.10421
Volonteri M., Silk J., Dubus G., 2015, ApJ, 804, 148
DATA AVAILABILITY Wang F., et al., 2018, Astrophys. J. Lett., 869, L9
Wang F., et al., 2019, ApJ, 884, 30
The data underlying this article will be shared on reasonable Wang F., et al., 2021, ApJ, 907, L1
request to the corresponding author. Willott C. J., et al., 2010, AJ, 140, 546
MNRAS 000, 1–8 (2021)8 F. Pacucci & A. Loeb Woods T. E., et al., 2019, Publ. Astron. Soc. Australia, 36, e027 Wu X.-B., et al., 2015, Nature, 518, 512 Wyithe J. S. B., Loeb A., 2012, MNRAS, 425, 2892 Yang J., et al., 2019, Astron. J., 157, 236 Yang J., et al., 2020, ApJ, 897, L14 This paper has been typeset from a TEX/LATEX file prepared by the author. MNRAS 000, 1–8 (2021)
You can also read