The Senate Standing Committee on Education and Employment Legislation Committee Inquiry into the Higher Education Support Legislation Amendment A ...
←
→
Page content transcription
If your browser does not render page correctly, please read the page content below

The Senate Standing Committee on Education and Employment Legislation Committee Inquiry into the Higher
    Education Support Legislation Amendment (A More Sustainable, Responsive and Transparent Higher
                                   Education System) (HESLA) Bill 2017

                            Regional Universities Network (RUN) responses to Questions on Notice

Senator McKenzie (to Professor Greg Hill, Vice-Chancellor, University of the Sunshine Coast, and Chair of the Regional Universities Network (RUN))

Q. What proportion of the money spent on your undergraduate program is not for the provision of teaching the education (of?) students – for instance,
those that are being funded through it – but that you have actually been subsidising the research program in your university?

A. The University of the Sunshine Coast spends about 7.5 per cent of its Commonwealth Grant Scheme funding on research and about the same on
engagement, totalling around 15 per cent.

                                                                                                                                                        1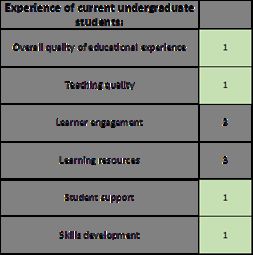
Questions to RUN/member universities:

Senator McKenzie:

Q. Give me a sense of the increased student population that the demand driven system has delivered to your institutions over time. I want to understand
the staff increases – and I do not mean administrative staff. What I mean is teaching staff to service those students. I do appreciate that an aspect of
servicing those students does require administration staff, but I think students would assume that, if there are more of them in front of lecture theatres
or online then there should be more lecturers dealing with that. So I want to understand the proportionality. We heard from the students yesterday and
indeed a union around a decrease in student experience, higher staff-student ratios et cetera, despite the figures showing that there is more money and
therefore there are more students. So I really want to understand the nexus a bit more. I ask each of you to provide your operating budget, your staff
cohort changes and your student increases over time.

The following responses have been provided by RUN universities – broadly, the growth in student numbers has been accompanied by a growth in teaching
staff. The demand driven system is a significant component which has contributed to the growth in student numbers.

CQUniversity
The overall trend in Equivalent Full Time Student Load (EFTSL) over the period 2008 to 2016, and the per cent change from 2011-2016, is shown in the table
below – there has been a significant growth in domestic students and a decline in international students over the period.

                                                                                                                                                       %
                                                                                                                                                    Change
                                                                                                                                % Change 2011-       2008-
             2008      2009        2010         2011         2012         2013         2014          2015           2016             2016            2016

Domestic      6,379      6,499       6,577        6,883        7,554        8,331        8,842          9,255          9,980                 45%       56%

Overseas      5,645      5,956       6,221        5,346        4,233        3,149        3,445          3,778          3,794                 -29%      -33%

Total        12,024    12,455       12,798       12,228       11,787       11,479       12,287         13,033         13,774                 13%       15%

                                                                                                                                                         2
The EFTSL for Domestic Bachelor students has grown by 57% over the 2011-2016 period which can be primarily related to demand driven system:

                                                                                                                                                        %
                                                                                                                                                        Change
                                                                                                                                       % Change 2011-   2008-
                         2008     2009          2010       2011           2012      2013      2014           2015           2016       2016             2016

           Bachelor       4,817         4,644      4,738          5,174     5,770     6,427          6,931          7,483      8,149              57%     69%
Domestic
           Total          4,817         4,644      4,738          5,174     5,770     6,427          6,931          7,483      8,149              57%     69%

The numbers of teaching staff have increased over the same period:

                                                                                                                                             2011-      2008-
                                2008        2009           2010           2011      2012        2013           2014         2015    2016     2016       2016

Teaching only function            146           108           121           236       230              197          347       379      356

Teaching and research
function                          299           305           290           237       250              260          128       192      246

Total                             445           413           411           473       480              457          475       571      602       27%       35%

Federation University Australia
Academic staffing has increased largely in line with increase in student enrolments from 2012 to 2016.

                                                                                                                                                           3
Changes in Students and Staff: (data from FedUni Pocket Stats trend 2005-2016):
Student experience:
Over this period Ballarat/FedUni had retained Good Universities Guide 5 star rating for Teaching Quality and Overall Experience.
In Quality Indicators for Learning and Teaching 2016, performance indicators relating to the experience of undergraduate students are as follows:
a) FedUni ranks above national average in all indicators:
Experience of current undergraduate students:
Data source: Student Experience Survey 2015 and 2016
Overall quality of educational experience Above 80.30% 79.90%
Teaching quality Above 82.60% 81.50%
Learner engagement Above 64.80% 64.20%
Learning resources Above 86.10% 85.20%
Student support Above 78.60% 72.00%
Skills development Above 82.50% 81.20%
4b) Ranks in 1-3 in Victoria in all indicators:
Southern Cross University (SCU)
Student numbers at Southern Cross University
Whilst the Demand Driven System increased the number of students at many universities, the number of Domestic Bachelor students at Southern Cross
University has been substantially unchanged. In 2015 (most recent published figures), Southern Cross University had 8,887 Domestic Bachelor students, two
more than the year before the introduction of the Demand Driven System.
5Table 1: Southern Cross University Domestic Bachelor student counts, 2011-15
2011 2012 2013 2014 2015
Commencing students 3,187 3,172 3,444 3,407 3,853
Total students 8,885 8,899 8,877 8,916 8,887
Source: https://www.education.gov.au/student-data queried 26-07-2017
Over the period 2011-15 the number of Commencing students has fluctuated primarily due to administrative factors (moving existing students into updated
course offerings).
Teaching staff FTE at Southern Cross University
Since the introduction of the Demand Driven System, the total staff Full-Time Equivalent (FTE) devoted to Teaching Only or Teaching and Research
increased in 2012-13, before falling in 2014 and 2015.
Table 2: Southern Cross University Teaching FTE, 2011-15
2011 2012 2013 2014 2015
Teaching Only FTE 170 177 207 218 208
Teaching & Research FTE 196 215 190 166 163
Total FTE (Teaching Only /Teaching & Research) 366 392 397 384 371
Source: Southern Cross University Institutional Performance Portfolio (IPP) Table 106
In the period since 2011, Southern Cross has substantially increased the number of Teaching Only FTE, from 170 to 208 in 2015.
University of New England (UNE)
The following table outlines UNE’s growth in total students, equivalent full time student load (EFTSL), academic staff full time equivalent (FTE),
student load per academic staff FTE, and operating expenditure over 4 years following implementation of the demand-driven system (from
2012). UNE’s student-staff ratio has remained relatively consistent over this period.
6UNE 2012 2013 2014 2015
Number of Students 20165 20912 21419 21992
Student Load (EFTSL) * 11259 11521 11713 11706
Academic Staff FTE** 445 488 457 466
Student Load per Staff FTE 25.3 23.6 25.6 25.1
Operating expenditure ($m) 251.5 279.9 290.6 308.1
*Equivalent Full Time Student Load; **Full Time Equivalent
Source: uCube Higher Education statistics data, Selected Higher Education Statistics – 2015 Student Data (Dept of Education) and UNE annual reports
University of Southern Queensland (USQ)
The change in various parameters between 2012 and 2016 illustrates the proportionality of changes in equivalent full time student load (EFTSL) and staff
full time equivalent (FTE) load over the period:
2016 c/f
USQ
2012
Total EFTSL* 4%
UG CGS EFTSL 18%
UG Non-Designated CGS
19%
EFTSL
7Overall staff FTE** 15%
Academic salaries
37%
expenditure
Equivalent Academic FTE 16%
Operating budget 19%
Surplus/deficit*** -39%
*Equivalent Full Time Student Load
** Full Time Equivalent
***Surplus/deficit shows the underlying impact on what we refer to as the “future fund” – the fund to invest in necessary infrastructure, both physical and technical
infrastructure (the latter increasingly growing in cost), program development and revision and staff development.
Neither these figures nor feedback e.g. in annual surveys etc. suggest any overall decrease in student satisfaction, quality of teaching or graduate outcomes.
University of the Sunshine Coast (USC)
Staff full time equivalent and student load have grown in parallel at USC:
USC 2013 2014 2015 2016 2017
Staff FTE 375.23 414.77 452.48 491.26 533.53
% increase 10.5 9.0 8.5 8.6
Student EFTSL 7,296 7,989 8,675 9,822 11,177
% increase 9.5 8.6 9.8 8.4
** Full Time Equivalent *Equivalent Full Time Student Load
8Q. And also just on your online cohorts, how much does it actually cost to deliver, per student, your courses online? And I appreciate that there are a lot
of upfront costs, but once you are up and running, what is the difference between offering an online and offline course in the same faculty?
A response from some relevant RUN members is as follows (not all of our universities have significant online delivery).
CQUniversity
The significant differences in cost of delivery are due to differences in discipline, not in delivery mode.
More than 50 per cent of students take distance education/online units, and students use the online Learning Management System, Moodle (as do face-to-
face students). Moodle is structured around the resource-based learning model, which provides everything from online video lectures to readings, and
these are provided to all students regardless of mode of enrolment. However, it is more expensive with international students where the university is
required under the ESOS Act to provide face-to-face lectures and tutorials. This inhibits the university’s ability to utilise efficiencies such as video-
conferenced lectures and tutorials and flipped-classrooms on multiple sites.
USQ
There is no real cost differential between on campus and online/external for a range of reasons such as:
• online learning management system is now key to both on campus and online/external teaching;
• recorded lectures, online tutorials, webinars etc. are similar costs to there on campus equivalent;
• very few programs are totally online. Most require residential sessions and/or placements, such as nursing, education, engineering, psychology;
• most services and support are accessed by on campus students via technology so there is no real differentiation between this group and off campus
students – this includes with respect to one-on-one sessions where zoom (or similar technology) is widely used.
UNE
When considering only the direct cost of teaching, there is very little variance between internal and online delivery. On average, for those schools where
both internal and online modes are offered, the variance in direct teaching costs is very low (less than 1%). This is reflective of UNE’s general practice of
allocating the same level of teaching resources to online and on-campus students.
When the attribution of indirect costs associated with maintaining campus facilities such as teaching laboratories, lecture theatres and other amenities is
included the difference in attributed cost is larger. This can be misleading however as courses where teaching laboratories or other infrastructure are
required often cannot be delivered fully online. When the upfront costs of establishing either the physical (for on-campus students) or virtual (for online
students) teaching infrastructure are not considered the estimated marginal cost of delivery to either an on-campus or online student is very similar.
9Senator Reynolds:
Q. Do any of you do work in terms of reviewing the post-study outcomes of your students, your regional students in particular? And after their particular
studies, how many of them on to employment in those areas regionally?
People who study in the regions largely stay in the regions to work. A study undertaken for RUN 1 using Graduate Careers Survey data on the employment
location of a graduate approximately four months after graduation, showed that, between 2007-2011, between 60-80 per cent of RUN graduates with
Bachelor level qualifications were initially employed in a regional location. The data is shown in the chart below:
Percentage of Bachelor level graduates that were employed in a regional location at the survey census date, 2007-2011. Please note that UB refers to
the former University of Ballarat, now Federation University Australia.
USQ
CQU
USC
SCU
UNE
UB
0% 20% 40% 60% 80%
A report by Cadence Economics for Universities Australia has estimated that for every 1000 university graduates entering the workforce 120 new jobs are
created for people without a university degree. 2 Regional universities therefore boost regional employment more broadly than just through their
graduates.
1
RUN, 2013, Economic Impact of the Universities within the Regional Universities Network, page 10. Available from
http://www.run.edu.au/cb_pages/news/Economic_Impact_Study.php.
2
Cadence Economics, 2016, The Graduate Effect: Higher Education Spillovers to the Australian Workforce. Report for Universities Australia. Available from
https://www.universitiesaustralia.edu.au/Media-and-Events/commissioned-studies/The-graduate-effect--higher-education-spillovers-to-the-Australian-workforce
10CQUniversity notes that, in 2014, data from the Australian Graduate Survey indicated that 71 per cent of CQUniversity graduates were employed full time
(83 per cent domestic and 33 per cent international). Just under 60 per cent of all contactable Australia-based alumni were located outside capital cities.
Federation University Australia notes the following Quality Indicators for Learning and Teaching data 2016 which shows various employment outcomes
compared/ranked with other Victorian universities:
USQ points out that many graduates who do not initially get employment in the regions may return and do so later.
Hillman and Rothman (2007) referenced in ACER (2011) 3found that students who leave regional areas to study in an urban institution are unlikely to return
– 74 per cent of regional students remain in cities after graduation.
Senator the Hon Jacinta Collins
3
ACER (2011) ‘Higher education & community benefits: The role of regional provision’, Joining the Dots, Research briefing, Vol 1, No. 5, September 2011
11Q. What is RUN’s assessment of the impact of cuts in this bill, and can you provide an assessment in dollar terms for each of your members, over the
next four years?
The impact of the cuts in the HESLA Bill will be significant on RUN members. It will cause considerable damage to the ongoing capacity of universities, both
regional and non-regional, to adequately service their communities. The consequent loss of this capacity will have considerable detrimental economic and
social impact across Australia.
Regional universities are, proportionally, more reliant on government funding for teaching and learning (around 40 per cent for RUN members), than older,
metropolitan universities (e.g. less than 20 per cent for the Group of Eight). The impact of the efficiency dividend and performance funding relating to the
Commonwealth Grant Scheme will therefore be greater for our universities.
Regional universities are anchor institutions for their regions. Commonwealth Grant Scheme (CGS) funding contributes to the myriad of ways that our
universities provide for our students and communities, including with respect to research and innovation funding, and support for sporting and cultural
activities and facilities. Regional universities do not receive separate, regional development funding – therefore, there is added pressure on our CGS
funding, compared to that of metropolitan universities, to support many of our activities.
Overall, RUN universities estimate that the effect of the implementation of the changes proposed in the HESLA Bill, excluding that due to performance
funding, will be of the order of around $20 million or more per university over the 4 years 2018-2021. Performance funding will put another $7.5 million or
more at risk per year per institution.
Individual universities have provided the following:
CQUniversity
CQUniversity estimates that the impact of the changes in the HESLA Bill, if legislated, will be $20.6M over the 4 years (excluding the possible loss due to the
implementation of performance measure funding).
The efficiency dividend:
- Loss of $2.97M out of CGS grant of $119.8M (~2.5%) - 2018
- Loss of $5.19M out of CGS grant $120.6M (~4.3%) – 2019
- Total= $8.16m
Impact of CGS indexation changes plus the student contribution:
122018 2019 2020 2021
Current
Model $200,385,993 $204,446,601 $206,480,528 $211,491,426
Proposed
Legislation $197,414,484 $199,252,414 $200,350,464 $205,167,303
Estimated
Loss ($2,971,509) ($5,194,187) ($6,130,064) ($6,324,123)
The performance funding will put an additional $8.7M-$8.8M at risk each year.
Federation University Australia
The impact of the implementation of the higher education reforms would mean a cut of at least $5 million over each of the four years 2018-2021.
USC
The impact of the funding cuts on USC will be over $20 million over the four years 2018-2021.
Q. Can RUN elaborate on your view of the regional hubs proposal?
RUN supports the initiative to establish and maintain up to eight community-owned, regional study hubs across mainland Australia.
Study hubs provide important support to distance/external students who stay in regional Australia while studying, and assist student success. A number of
RUN universities operate the own existing study centres/hubs, or are participants with other providers.
In principle, our view is that new hubs should not be established at locations that already have access to a university campus or existing study hub.
13You can also read