THE US MUNICIPAL BOND MARKET - ESG INTEGRATION IN SUB-SOVEREIGN DEBT - unpri
←
→
Page content transcription
If your browser does not render page correctly, please read the page content below
ESG INTEGRATION IN
SUB-SOVEREIGN DEBT
THE US MUNICIPAL
BOND MARKET

An investor initiative in partnership with UNEP Finance Initiative and UN Global Compact

ESG INTEGRATION IN SUB-SOVEREIGN DEBT

    THE SIX PRINCIPLES

    PREAMBLE TO THE PRINCIPLES
    As institutional investors, we have a duty to act in the best long-term interests of our beneficiaries. In this fiduciary role, we
    believe that environmental, social, and governance (ESG) issues can affect the performance of investment portfolios (to
    varying degrees across companies, sectors, regions, asset classes and through time). We also recognise that applying these
    Principles may better align investors with broader objectives of society. Therefore, where consistent with our fiduciary
    responsibilities, we commit to the following:

    1
              We will incorporate ESG issues
              into investment analysis and
              decision-making processes.

    2
              We will be active owners and
              incorporate ESG issues into our
              ownership policies and practices.

    3
              We will seek appropriate
              disclosure on ESG issues by
              the entities in which we invest.

    4
              We will promote acceptance and
              implementation of the Principles
              within the investment industry.

    5
              We will work together to
              enhance our effectiveness in
              implementing the Principles.

    6
              We will each report on our
              activities and progress towards
              implementing the Principles.

    PRI's MISSION
    We believe that an economically efficient, sustainable global financial system is a necessity for long-term value creation. Such
    a system will reward long-term, responsible investment and benefit the environment and society as a whole.

    The PRI will work to achieve this sustainable global financial system by encouraging adoption of the Principles and
    collaboration on their implementation; by fostering good governance, integrity and accountability; and by addressing
    obstacles to a sustainable financial system that lie within market practices, structures and regulation.

    PRI DISCLAIMER
    The information contained in this report is meant for the purposes of information only and is not intended to be investment, legal, tax or other advice, nor is it intended to be relied upon
    in making an investment or other decision. This report is provided with the understanding that the authors and publishers are not providing advice on legal, economic, investment or other
    professional issues and services. PRI Association is not responsible for the content of websites and information resources that may be referenced in the report. The access provided to
    these sites or the provision of such information resources does not constitute an endorsement by PRI Association of the information contained therein. Except where expressly stated
    otherwise, the opinions, recommendations, findings, interpretations and conclusions expressed in this report are those of PRI Association, and do not necessarily represent the views of
    the contributors to the report or any signatories to the Principles for Responsible Investment (individually or as a whole). It should not be inferred that any other organisation referenced
    on the front cover of, or within, the report, endorses or agrees with the conclusions set out in the report. The inclusion of company examples, or case studies written by external
    contributors (including PRI signatories), does not in any way constitute an endorsement of these organisations by PRI Association or the signatories to the Principles for Responsible
    Investment. The accuracy of any content provided by an external contributor remains the responsibility of such external contributor. While we have endeavoured to ensure that the
    information contained in this report has been obtained from reliable and up-to-date sources, the changing nature of statistics, laws, rules and regulations may result in delays, omissions
    or inaccuracies in information contained in this report. PRI Association is not responsible for any errors or omissions, for any decision made or action taken based on information
    contained in this report or for any loss or damage arising from or caused by such decision or action. All information in this report is provided “as-is” with no guarantee of completeness,
    accuracy or timeliness, or of the results obtained from the use of this information, and without warranty of any kind, expressed or implied.

2
THE US MUNICIPAL BOND MARKET | 2021

CONTENTS

EXECUTIVE SUMMARY                                                5

FOREWORD                                                         7

ABOUT THIS PAPER                                                 8

OVERVIEW OF US MUNI MARKET                                       9

CURRENT ESG PRACTICES                                            11

BREAKING DOWN E, S AND G FACTORS                                 14

DATA CONSIDERATIONS                                             24

NEXT STEPS                                                      28

APPENDIX                                                        29

                                                                         3
ESG INTEGRATION IN SUB-SOVEREIGN DEBT
ACKNOWLEDGEMENTS
The PRI would like to thank the sub-sovereign debt advisory
committee (SSDAC) members for their guidance:
■ Emily Robare (Chair), Vice President, PIMCO
■ Andrew Teras, Director, Municipal Research,
Breckinridge Capital Advisors
■ Malcolm A. (Mac) Ryerse, Head of Stewardship,
Responsible Investment, Columbia Threadneedle
Investments
■ Adam Kennedy, Research Analyst, Head of Municipal
ESG Strategy, DWS
■ Alexa Gordon, Portfolio Manager, Goldman Sachs Asset
Management
■ Rachida Mourahib, Head of Fixed Income ESG and
Green Research, HSBC Global Asset Management
■ David Gao, Head of Tax Aware Investment Grade and
ESG Research, JP Morgan Asset Management
■ Frances Lewis, Senior Managing Director, MacKay
Shields
■ Saad Qazi, Senior Investment Analyst, Manulife Asset
Management
■ Mahesh Jayakumar, Investment Officer, Fixed Income
Research Analyst, MFS Investment Management
■ James Lyman, Director of Municipal Fixed Income
Research and Co-Portfolio Manager of NB Municipal
Impact Fund, Neuberger Berman
■ Sarah Wilson, Managing Director and Head of ESG
Integration, Nuveen
■ Ksenia Koban, Payden & Rygel, Senior Vice President,
Municipal Strategist, Co-Chair of ESG Committee
■ Deborah Voit, Investment Analyst, Vanguard
■ Thomas Stoeckmann, Head of Municipal Research,
Wells Capital Management
■ Michael Linko, Credit Analyst, Western Asset
Management
4THE US MUNICIPAL BOND MARKET | 2021
EXECUTIVE SUMMARY
Momentum is building for investors in US municipal bonds Despite an increasingly favourable environment for ESG
(munis) to incorporate environmental, social and governance incorporation, challenges remain:
(ESG) factors systematically in their analysis and valuations.
■ Assessing factors relevant to munis is more nuanced.
As with other fixed income sub-asset classes, ESG factors Topics such as physical or transition climate risk and
have traditionally been integrated in muni bond valuations inequality are similar for munis and other sub-asset
to an extent. However, the need to explicitly integrate ESG classes, however munis may benefit from federal or
factors has historically not been a priority due to muni state support, potentially mitigating the effect on
characteristics, such as their tax-advantaged status, a better valuations.
credit quality relative to corporate bonds and higher returns ■ Risks vary with the type of muni bond. Munis can at
compared with Treasuries. times resemble sovereign borrowers and at times
corporate issuers (see Figure 1).
New developments have heightened awareness of the need
■ Data is inconsistent. For governance and social factors
for an explicit ESG risk assessment, including:
data is plentiful and often free but not disseminated
effectively; for environmental factors it is still
■ Rising commercial pressure on asset managers to
insufficient. Moreover, some issuers lack the necessary
demonstrate ESG incorporation in bond assessment to
resources or perceive disclosure as a burden rather than
asset owners;
a benefit to risk management and borrowing costs.
■ Growing demand from non-US investors, including
European investors, who are now required to explain
This report looks at ESG integration, an approach focused
how they consider ESG factors in their investment
on measuring and managing ESG risks to investment
choices;1
performance. Future work will address thematic and
■ Shifting priorities at the federal level, where the screening approaches to ESG investing and investor
administration has shown increased ambition to tackle engagement on ESG topics. Sub-sovereign debt in other
climate change and boost infrastructure projects, many countries will also be a future topic.
of which are funded by state and local governments;
■ Changing expectations from financial regulators around Importantly, the PRI will also endeavour to broaden the
ESG disclosure and transparency, starting in Europe and investor dialogue with issuers, credit rating agencies
spreading to the US, where signals are increasing.2 (CRAs) and ESG information providers,3 along the lines
of a similar PRI programme in the corporate market.
Such dialogues have helped stakeholders understand
expectations, challenges, and market nuances from a variety
of perspectives.
1 Since the EU Commission launched its action plan on sustainable finance in 2018 and the European Green Deal in 2019, it has introduced several regulations. These include the EU
sustainability-related disclosures in financial sector regulation and the EU taxonomy for sustainable activities – a classification system establishing a list of environmentally sustainable
economic activities. It is also working towards an EU green bond standard.
2 These signals include the US Securities and Exchange Commission requesting public input from investors, registrants and other market participants on climate change disclosure; the
Commodity Futures Trading Commission establishing a new climate risk unit; the Federal Reserve creating a new committee to examine the effects of climate change on banking and
the economy; and the Federal Housing Finance Agency issuing a request for input on the current and future natural disaster risk to the housing finance system.
3 See PRI’s ESG in credit risk and ratings initiative and Do ESG information providers meet the needs of fixed income investors?
5ESG INTEGRATION IN SUB-SOVEREIGN DEBT
Figure 1: The universe of muni bond issuers is complex4
LOCAL ADMINISTRATIONS
CLOSER TO SOVEREIGNS
States Counties Cities, towns, School districts Special districts Special
municipalities assessment or tax
increment districts
GOVERNMENT ENTERPRISES AND AGENCIES
Airports Ports Water and Electric utilities Public higher State housing
sewer utilities education agencies
CLOSER TO CORPORATES
NON-PROFIT AND PRIVATE ENTITIES
Hospitals Foundations Museums Continuing Industrial Multi-family
care retirement development housing bonds
communities revenue bonds
4 The source of information for figures is PRI unless otherwise noted.
6THE US MUNICIPAL BOND MARKET | 2021
FOREWORD
I spoke recently with a county finance officer who remarked
that when it comes to ESG issues, investors often take what
makes sense for corporate research and apply it to public
finance. But as any public official will tell you, companies
and municipalities aren’t the same – public finance operates
with different stakeholders, laws, mandates, pressures, and
revenue-raising mechanisms than a public company – and
investors’ approach to ESG assessment in muni bonds needs
to reflect this.
While we have seen growth in market participants’
appreciation of the need to assess ESG risks, systematic
incorporation of ESG in credit analysis still lags in the
municipal market. Muni credit analysts rightly point out that
some ESG factors overlap with traditional municipal credit
analysis. However, an enormous amount of research, critical
thinking, and collaborative effort is needed to further the
understanding of rapidly evolving ESG risks and their impact
on credit quality.
This report is particularly timely: in the last 18 months, not
only has our world been entirely upended by the coronavirus Emily Robare
pandemic, but we have also seen record-breaking wildfires, Chair, PRI Sub-Sovereign Debt Advisory Committee
extreme drought in many regions of North America, a Vice President, PIMCO
deep freeze in Texas that drove several electric utilities to
bankruptcy, and one of the largest protest movements in US
history, leading to renewed attention to racial injustice.
The combined impact of these events and a growing
recognition of ESG risks have escalated many ESG issues
on the investor and issuer agenda. But ESG research isn’t
all about risks – it’s about opportunities, too. The number
of municipalities establishing greenhouse gas emission
reduction targets is increasing.5 The number of cities paying
attention to, and deploying resources toward, racial equity
and social justice is also growing.6 Finally, early regulatory
signals point to possible changes that could significantly
affect sustainable investment practices in US markets. We
expect these efforts to implement positive change on ESG
issues will only increase in the coming years.
I would like to thank my committee colleagues for their
collaboration, dedication, and willingness to engage on these
topics, and the PRI for its interest in exploring this topic in
greater depth.
5 Forty-five of the 100 most populated US cities have established greenhouse gas reduction targets and corresponding baseline inventories, with the most common representing an 80%
reduction in emissions by 2050. See Brookings (2020) Pledges and progress: Steps toward greenhouse gas emissions reductions in the 100 largest cities across the United States.
6 See Truth, Justice and Reconciliation Commission (2020) Grassroot Law Project and Leading Reform District Attorneys Announce Truth, Justice & Reconciliation Commissions to
Address Decades of Harm Caused by Law Enforcement and Prosecutorial Overreach.
7ESG INTEGRATION IN SUB-SOVEREIGN DEBT
ABOUT THIS PAPER
This report provides an overview of current muni market Future work will examine ESG screening, which is driven
practices and challenges to ESG integration in investment by ESG-related norms and rules; a thematic approach,
decisions. ESG integration focuses primarily on measuring reflecting a desire to achieve specific real-world outcomes;
and managing ESG risks to investment performance. It is and engagement around ESG topics.
one of three approaches that investors use to incorporate
ESG into their valuation process. With this report, the PRI is expanding its fixed income work
of recent years beyond ESG incorporation in corporate and
The report’s content is suitable for fixed income investors sovereign bonds, private debt and securitised products.
and credit analysts in muni bonds who have not yet started Anyone new to responsible investment concepts should
incorporating ESG factors in their investment practices refer to the PRI’s series of guides, An introduction to
or are only just beginning to formalise them. The report is responsible investment and to the Reporting Framework
based on desk-based research and draws on the experience glossary. The PRI’s fixed income resources can be found on
of the members of the SSDAC. its fixed income page.
The US muni market is one of the largest and most liquid
sub-sovereign bond markets in the world. Muni bonds
are unique in many ways. They are similar to sovereign
bonds in that the issuer can often raise and collect taxes.7
However, the issuers may not be as large or as diverse as
sovereigns. Moreover, some muni issuers are focused on
only one sector or service, making them more comparable
to corporates than sovereigns. As a result, when it comes to
ESG integration, some considerations are similar to those
for corporate bonds, while others resemble sovereign debt
due to the public-sector nature of the issuers.
7 See OECD Library for a definition of the differences between central and local government.
8THE US MUNICIPAL BOND MARKET | 2021
OVERVIEW OF US MUNI MARKET
Figure 2: US fixed income market: outstanding bonds as a
KEY MESSAGES percent of total (4Q 2020). Source: SIFMA
■ The US muni bond market is characterised by a 2%
myriad of issuers operating in different sectors.
■ Issuers may receive varying levels of support from 3% 2%
state or federal governments and muni bonds
generally offer a tax benefit. Some are backed by the 8%
revenue streams from specific projects; others are
general obligation (GO) issues.
■ Retail investors own a large share of muni bonds 41%
although this has declined in recent years. 21%
At nearly US$4trn8, the muni market represents about 8% of
the US bond market and is one of the largest sub-sovereign 22%
markets in the world (see Figure 2).
Before addressing how ESG considerations feature in this
asset class, it is important to understand the muni market’s
distinct characteristics.
US treasuries Mortgage-related Corporate debt
■ The market is very broad. The number of active issuers Munis Agency Asset-backed
with bonds outstanding is around 36,0009 and the
number of issues is even larger. Money markets
■ Issuer types vary significantly (see Figure 3).
Figure 3: Composition of Bloomberg Barclays tax-exempt municipal indices by issuer type. Source: Bloomberg*
Investment grade (Bloomberg Barclays Municipal Bond Index) High yield (Bloomberg Barclays Muni High Yield Index)
Special
Special
assessment
assessment
Farebox
Farebox OtherOther 2.1% 2.1% OtherOther Economic
Economic
(mass(mass
and rapid
and rapid transit)13.1%13.1%
transit) MelloMello
RoosRoos 7.9%7.9% and industrial
and industrial
StateState Farebox
Farebox
1.58%1.58% 1.8% 1.8% development
development
Non-toll
Non-toll 14.1%14.1% (mass(mass
and rapid
and rapid
transit)
transit)
2.2%2.2% 13.7%13.7%
1.6% 1.6%
Gas forward
Gas forward Student
Student
housing
housing
1.9% 1.9% 2.3%2.3%
Tobacco
Tobacco
Tax backed
Tax backed
district
district
Tax backed
Tax backed
district
district 11.6%11.6%
Hospitals
Hospitals 2.6%2.6%
2.1% 2.1%
9.6%9.6%
County
County Higher
Higher
education
education
2.2%2.2% 2.8%2.8%
Government
Government
leaselease Miscellanious
Miscellanious
tax tax
2.4%2.4%SalesSales
tax tax
WaterWater 2.9%2.9%
2.9%2.9%
and sewer
and sewer Appropriation
Appropriation SalesSales
tax tax
Electricity
Electricity 8.3%8.3% 3.3%3.3% 10.6%10.6%
and public
and public
3.4%3.4% City City Water
Water
and sewer
and sewer
3.4%3.4% 3.6%3.6%
SchoolSchool
district
district Continuing
Continuing
IncomeIncome
tax tax Multi-family
Multi-family care retirement
care retirement
7.0%7.0%
financing
financing housing
housingSchool
School centres
centres
Tollroads,
Tollroads,
4.5%4.5% 5.6%5.6% district
district 9.6%9.6%
Airports
Airports Higher bridges
Higher bridges
5.4%5.4%Charter
Charter
4.7%4.7%Appropriation
Appropriation
education and
education tunnels
and tunnels schools Hospitals
schools Hospitals
5.2% 5.2% 5.6%5.6% 6.7% 6.7% 5.8%5.8% 7.9%7.9%
*Sectors that comprise 1.5% or less of the total are included in the “Other” category10
8 Source: SIFMA, as of the fourth quarter 2020.
9 Source: Bloomberg (as of May 2021). We note that the number of municipal bond issuers is frequently quoted as 50,000. According to the Municipal Securities Rulemaking Board
(MSRB), this is an estimate of the number of total historic issuers of municipal bond debt, some of which has been retired. See MSRB (2019) Municipal Securities: Financing the Nation’s
Infrastructure.
10 In the investment grade index, the “Other” category includes: miscellaneous tax; ports and marinas; combined utilities; single-family housing; economic and industrial development;
bond bank; education lease; multi-family housing; tobacco; primary and secondary education; continuing care retirement centres; guaranteed student housing; tax increment financing;
student loans; ad valorem lease; charter schools; resource recovery; special assessment; Mello-Roos; nursing and assisted living; private schools; parking facilities. In the high yield
index, the “Other” category includes: tax increment financing; nursing and assisted living; resource recovery; government lease; city; electricity and public power; toll roads, bridges
and tunnels; single-family housing; private schools; ad valorem lease; airports; bond bank; education lease; primary and secondary education; income tax financing; guaranteed; parking
facilities; ports and marinas; state; combined utilities; student loans; county; gas forward; non-toll.
9ESG INTEGRATION IN SUB-SOVEREIGN DEBT
■ The average maturity of munis at issuance is long. In Figure 4: US muni bond issuance by use of proceeds
January-May 2021, the average tenor was 16.9 years (Jan-May 2021). Sources: Refinitiv, SIFMA Research
(compared with 15.7 for corporate bonds) reflecting
the long-term nature of many projects being financed 30%
(see Figure 4, which shows the use of proceeds of muni
bonds).11
■ Most bonds offer a favourable tax treatment. Interest
20%
on nearly 90% of outstanding muni bonds is tax-exempt
at the federal level, and many are also exempt from
state taxes when the investor is a resident of the state
where the bond was issued. Taxation considerations 10%
are important for issuers too; borrowing costs are
restrained by investors’ willingness to accept a lower
yield in exchange for the tax advantage.12
■ Retail investors are an important part of the buyer 0%
base. The proportion of muni securities held by
on
ion
ies
ing
are
es
r
se
he
i
rpo
ati
ilit
ilit
us
tat
hc
Ot
households and non-profit organisations stands at uc
Ut
ac
Ho
alt
pu
or
Ed
cf
about 45%, however that figure declined by nearly 10
sp
He
ral
bli
an
percentage points since 2005 (see Figure 5).
ne
Pu
Tr
Ge
■ Debt servicing sources vary. Revenue bonds fund a
specific project that generates a revenue stream to
service the debt, such as charges on toll roads. GO Figure 5: Holders of muni bonds by type (4Q 2020).
bonds instead pledge the full faith and credit of the Sources: SIFMA, Federal Reserve*
issuer. They often fund public projects that do not
generate revenues and can be serviced through local 100%
taxes or other means. 90%
■ State and local governments operate under different 80%
jurisdictions. Regulatory requirements and the level 70%
of support from other entities, such as state or federal
governments, can vary substantially. 60%
50%
40%
30%
20%
10%
0%
08
06
09
05
07
20
10
14
18
16
12
19
13
15
17
11
20
20
20
20
20
20
20
20
20
20
20
20
20
20
20
20
Households and non-profit organiations Funds
Banking institutions Insurance companies
Other
* The Federal Reserve classifies “households and non-profit organisations”
as including domestic hedge funds, private equity funds and personal trusts.
However, at least recently, the proportion of munis held by non-profits and
domestic hedge funds appears to be minimal. “Funds” include mutual funds,
money market funds, closed-end funds and exchange traded funds. The
category ‘Other’ includes holdings by a variety of institutions including state
and local governments and non-US residents.
11 Sources: Refinitiv, SIFMA Research.
12 See Brookings (2020) Why the surge in taxable municipal bonds?; MSRB (2021) 2020 Municipal Bond Market in Review.
10THE US MUNICIPAL BOND MARKET | 2021
CURRENT ESG PRACTICES
KEY MESSAGES
■ Investors have been slower to formally incorporate ESG factors into muni bond analysis compared with other fixed
income sub-asset classes.
■ The complexity of the market and its relatively better credit quality have made the need for a more holistic approach
to risk assessment appear less urgent.
■ Muni issuers display ESG risk characteristics that in some instances resemble sovereign issuers and in others
corporate issuers.
Many ESG factors have traditionally been viewed as inherent Finally, municipalities may receive state or federal support
in, and integrated into, muni risk assessment, similar to beyond that offered to corporates to mitigate environmental
other fixed income instruments. It is only recently that and social risks. This support may vary: for example, the
institutional investors have started to frame muni ESG risks response to the coronavirus pandemic13 was more generous
in a more formal fashion. than after the 2009 recession. And, while such support
is not guaranteed, it may diminish the credit risk of muni
The diversity and complexity of the market highlighted in bonds.
the “Overview of US muni market” section partly explains
why it has taken longer than in other fixed income sub- As a result, identifying the materiality of ESG factors in
asset classes for muni bond market participants to frame the muni market has historically attracted less interest
ESG considerations in investment decisions. Issuers reflect compared with other fixed income asset classes. ESG
the wide geographical diversity of the US, implying that factors are considered material if they affect the bond’s
environmental and social risks also vary significantly. initial pricing, its performance or credit quality (i.e. the
issuer’s willingness or ability to service and repay debt).
Furthermore, although riskier than Treasury bonds, muni However, other factors generally play a greater role in price
credit quality is generally better than corporate bonds: and yield in the muni market, such as interest rates, inflation
the average credit quality of the Bloomberg Barclays US and tax status.
Municipal Bond Index is Aa2/Aa3, while the average credit
quality of the Bloomberg Barclays US Corporate Bond Index The muni bond market can resemble corporates, sovereigns
is A3/Baa1. This perceived safer-asset status and higher or neither when considering ESG factors, as shown in
yields than Treasuries may have contributed to delays in Figure 6.
taking a more holistic approach to risk assessment, amid low
interest rates and low inflation.
13 See BlackRock (February 2021) Municipal Market Update; Financial Times (January 2021) Investors race into munis as Biden announces stimulus plan to cash-strapped states.
11ESG INTEGRATION IN SUB-SOVEREIGN DEBT
Figure 6: ESG considerations: similarities and differences across different types of issuers
CORPORATE* US MUNI** SOVEREIGN
ISSUER STRUCTURAL FEATURES THAT MAY OFFSET OR REDUCE AN ESG RISK
Taxation authority to No Depends on security; general Yes
service debt obligation bonds are typically
full faith and credit, which
can include taxing power
Monopoly over selected Occasionally Often Often
products or services
Debt monetisation*** No Deficit financing is rare Yes
due to balanced budget
requirements
External support Potentially from a parent Borrowers may have access No, aside from bilateral or
company or government to other state or federal multilateral debt relief
subsidies support, depending on the
jurisdiction
Diversity of economic Depends on size, product Depends on issuer economic Depends on issuer economic
activity as a risk mitigant offering, breadth of revenue characteristics, breadth of diversification and taxable
streams revenue and purpose of base
financing
MANAGING ESG ISSUES
Availability of ESG data ■ Disclosed by issuers ■ Disclosed by public ■ Disclosed by public
■ Available through CRAs sources and issuers sources and issuers
and third parties (often upon request) (often upon request)
■ Peer comparison ■ Available through CRAs ■ Available through CRAs
difficult and third parties and third parties
■ Data can be patchy ■ Data can be stale
Investors screening issuers Yes Sometimes Rarely
for ESG reasons
Degree of investor Less common than for Less common than for Less common than for
engagement with issuer shareholders corporate bondholders and corporate bondholders and
more challenging more challenging
Able to move geographic Yes No**** No
location
Social stakeholders Employees, customers, Local population, taxpayers, National population,
supply chain employees and the service taxpayers
base
Governing body Appointed Depends on sector as May be elected
to whether elected or
appointed
*Corporate excludes quasi-governmental organisations, which have the legal characteristics of both governmental and private entities.
**US muni issuers as per the classification of Figure 1.
***Debt monetisation is also known as monetary financing and is colloquially referred to as printing money by a central bank to allow a sovereign to finance its
deficit or repay its debt.
****General obligation issuers typically cannot move. In rare cases revenue bond issuers may be able to relocate within their service area.
12THE US MUNICIPAL BOND MARKET | 2021
However, whilst investors have been slow to adopt a formal
ESG incorporation approach to date, new factors have come QUALITATIVE FINDINGS FROM THE PRI
into play that are changing the landscape: REPORTING DATA
From the 2020 annual reporting to the PRI by signatories
■ There is evidence that retail and institutional investors on their responsible investment practices the following
want to be more informed about ESG investing can be observed:
options.14
■ Asset management firms are working to demonstrate ■ Many signatories invest in munis that fund
ESG incorporation across all asset classes in a purposeful projects, particularly infrastructure with
standardised fashion, driven by commercial pressures positive environmental and societal outcomes (e.g.
from clients and beneficiaries. related to affordable housing, waste management,
pollution control).
■ CRAs have sharpened their focus on ESG factors.15
■ Given the high credit quality of many of the muni
■ Foreign investors have been increasingly interested
issuers in their portfolios (e.g. Federal Home Loan
in the taxable segment of the muni market. European
Banks), some signatories admit that they tend to
investors – who are relatively more advanced in ESG
downplay ESG risks.
incorporation practices – are part of this trend.16
■ Of the three ESG categories, governance is the most
scrutinised. Signatories list several aspects that
they consider in addition to financial management,
including diversity and board independence,
disclosure policies, pension plan management and
past controversies.
■ Data coverage and scoring of muni bonds by third-
parties is scarce. As a result, beyond traditional credit
quality assessment and fundamental analysis, some
signatories are creating proprietary ESG analytics
and frameworks to score munis. These scores may
have varying weights, depending on the type of
issue and sector, and are used to guide portfolio
construction and bond selection (for instance,
between alternatives with the same credit quality).
■ Negative screening is limited – for example it may
be applied when there are governance issues or to
exclude traditional ‘sin sectors’ such as tobacco,
gambling or ammunitions, although these represent
a small share of outstanding bonds. Positive
screening is more common, especially among impact
investors.
■ Some signatories report engaging directly with
issuers to get additional information for their due-
diligence analysis, to assess the viability of plans and
strategies, and to monitor areas of concern.
■ There is incipient evidence of efforts to align
investment selection and strategies with the UN
Sustainable Development Goals.
14 See S&P (May 2020) Move over Millenials: ESG Investing Is a Multigenerational Conversation.
15 This is partly through the PRI’s ESG in credit risk and ratings initiative and also due to regulatory changes: see ESMA (2020) Guidelines on disclosure requirements applicable to credit
ratings.
16 See Bloomberg (May 2021) BABs Revival Boosts Overseas Participation; Politico (April 2021) Supporters hope for Build America Bonds revival in infrastructure plan.
13ESG INTEGRATION IN SUB-SOVEREIGN DEBT
BREAKING DOWN E, S AND G FACTORS
KEY MESSAGES
■ Environmental: The frequency of severe climate events has been increasing, with ramifications for agricultural
productivity, land valuations, and public spending.
■ Social: Relevant factors can include demographics, community equity and the population cohort served by a funded
project.
■ Governance: The essential nature of public services means governance is relevant to many types of risk; cybersecurity
has emerged as a new investor concern as it could lead to financial and reputational losses.
Discussions with the SSDAC highlighted that muni bond ENVIRONMENTAL FACTORS
investors remain focused on downside risks, similar to all
fixed income investors. To that end, governance has always Market participants and regulators have increasingly focused
been closely scrutinised and remains particularly relevant. on climate change risks in recent years, particularly risks
However, the emphasis on environmental and social risk linked to physical exposure or related to the transition
factors is increasing. required to mitigate physical risks. Both of these risk
types may also materialise in parallel, compounding the
Muni issuers’ revenue streams are often concentrated challenge.17 Municipalities offer and manage a broad range of
geographically and economically. This can intensify the services – such as sanitary sewage, waste collection, water
local effect of any one environmental or social factor, supply and land use planning – which are inherently linked to
especially in the US, which has a very diverse physical and biodiversity risks.
social morphology. In fact, although the debate around
climate change and social issues tends to focus on variations PHYSICAL CLIMATE RISK
between countries, differences within countries apply too. Physical climate risk can affect state and local governments
on multiple fronts (see Figure 7). In turn, the consequences
For state and local governments, ESG risks may encompass of climate change may affect issuers’ ability to generate
the whole local population, rather than just a narrower revenues if, for example, property and land valuations
group of customers and employees, as in the case of decline and businesses relocate. Issuers may also need
corporate issuers. This local dependency means that ESG to increase expenditures to cover repairs, infrastructure
factors could affect a muni issuer’s capacity to service its adaptation, compensation, subsidies or higher costs of
debt, for example if the taxable base is affected or public services.
spending increases. That said, state and local governments
may have greater leverage to respond to these risks through
policy intervention. Therefore, the quality of governance can
be even more relevant to the materiality of environmental
and social risks, as it can affect how these risks are managed
or mitigated.
The remainder of this chapter focuses on risks within
each ESG category. It is important to remember that ESG
factors can also be drivers of positive change, for example
if a community benefits from clean energy, resilient
infrastructure or initiatives aimed at conservation, education
or healthcare. Furthermore, the same risk could fall under
more than one of the three ESG categories (for instance,
cybersecurity could be labelled as a social as well as a
governance factor).
The sections below contain six real-world examples that
highlight how ESG factors can affect specific issuers,
including related credit rating agency opinions. The
categorisation of each event as E, S or G was done by the
PRI and all relevant sources are in footnotes.
17 See Climate-Related Market Risk Subcommittee, Market Risk Advisory Committee of the US Commodity Futures Trading Commission (2020) Managing climate risk in the US
financial system.
14THE US MUNICIPAL BOND MARKET | 2021
Figure 7: Effects of physical risks and financial implications for muni bond issuers
PHYSICAL RISKS EFFECTS POSSIBLE CONSEQUENCES
Droughts ■ Job losses
■ Community displacement
■ Public disorder
Flooding ■ Diseases
Living and working conditions ■ Lower production
Freeze ■ Food insecurity
■ Damages to buildings
■ Higher insurance premia/
Severe storm insurability
■ Power cuts/
Tropical cyclone Natural capital and food systems ■ Transport disruption
Wildfire
Winter storm
Physical assets
FINANCIAL IMPLICATIONS FOR MUNI BOND ISSUERS
LOWER REVENUES HIGHER EXPENDITURES
■ Reduced taxable base ■ Repairs
■ Inability of projects to generate cashflow as ■ Compensation
planned ■ Subsidies
■ Policing costs
15ESG INTEGRATION IN SUB-SOVEREIGN DEBT
Weather-related events are becoming more frequent and per year soared to 16.2 events per year during 2016-2020,
expensive: the US has sustained 291 weather and climate hitting 22 in 2020 alone, a new record (see Figure 8). All 50
disasters since 1980, with total costs exceeding US$1.9trn states had at least one billion-dollar disaster over the last 30
(inflation-adjusted).18 And the frequency of these extreme years, with Texas the most hit by far.
weather events is increasing: a 30-year average of 7.1 events
Figure 8: US Billion-dollar weather and climate disasters (2020).* Source NOAA
Central severe weather
- Derecho
Central severe weather
August 10
July 10-11
North Central and Ohio Valley
hail storms and severe weather
April 7-8 Midwest and Ohio Valley
severe weather
Western wildfires,
March 27-28
California, Oregon,
Washington firestorms
Fall 2020 Southeast tornadoes and
northern storms and flooding
Jan 10-12
Tennessee tornadoes and
Western / Central Southeast severe weather
drought and heatwave March 2-4
Summer-Fall 2020
Hurricane Isaias
August 3-4
Central and Eastern South, East and
severe weather Northeast severe weather
May 3-5 Feb 5-7
South, Central and Eastern
Southern severe severe weather
weather May 20-23
April 21-23
Central, Southern, Southeast and Eastern
and Eastern severe weather tornado outbreak
April 27-30 Hurricane Zeta April 12-13
October 28-29
South Texas
hail storms Tropical Storm Eta
May 27 Hurricane Laura Hurricane Sally November 8-12
Hurricane Hanna Hurricane Delta August 27-28 September 15-17
July 25-26 October 9-11
*Note: the chart refers to 2020 alone.
The ramifications of climate change risks are also complex: temperatures and droughts or extreme precipitation can
the direct effects can be local, but they can have knock- have a significant impact on livestock or on crop yields for
on impacts across states, cities and sectors where corn, wheat, soybeans, and cotton. While this could directly
socioeconomic systems are connected. For example, affect the Midwest, it could also have repercussions for food
changes in weather patterns associated with higher prices nationwide and in export markets.
18 For an event to be included for the purposes of determining both the number and cost of events, the CPI-adjusted damages or costs (rather than the actual figure) must be at least
US$1bn. See US National Oceanic and Atmospheric Administration (NOAA).
16THE US MUNICIPAL BOND MARKET | 2021
Extreme weather events create disruption, increased costs, properties with average inundation; non-flooded properties
asset depreciation and can be deadly. For example, flooding included in new floodplain maps experienced an 18% drop
during Super Storm Sandy caused prices to fall by 5%- in prices.19 The largest costs stem from tropical cyclones,
7% for minimally inundated properties and by 8%-13% for followed by severe storms and drought (see Figure 9).
Figure 9: US billion-dollar natural disasters by type (CPI-adjusted).* Sources: PRI based on NOAA data
Number of events Cost (US$bn)
Winter Storm
Wildfire
Tropical Cyclone
Severe Storm
Freeze
Flooding
Drought
140 120 100 80 60 40 20 0 0 200 400 600 800 1000 1200
1980-1999 2000-2020
*For an event to be included for the purposes of determining both the number and cost of events, the CPI-adjusted damages or costs (rather than the actual
figure) must be at least US$1bn.
Despite the increased severity of these events, they have Mitigating factors include:
had a limited effect on issuers’ credit ratings, as noted
in a recent S&P Global Ratings report. For the period of ■ the issuer’s preparedness to address physical climate
2017-2018, the CRA identified ESG factors as drivers for risk
only 34% of 3,315 US public finance rating actions: within ■ the strength of the issuer’s financial position
that subgroup, governance was the most dominant factor
■ the resilience of its infrastructure
affecting credit ratings (67%), followed by social (26%) with
environmental trailing at a mere 5%.20 ■ increased production and economic activity associated
with rebuilding
■ the level of state or federal aid, for example through the
Federal Emergency Management Agency (FEMA)21
■ the degree of insurance policy coverage
19 See Matthew Gibson, Jamie T. Mullins and Alison Hill (2019) Climate risk and beliefs: Evidence from New York floodplains.
20 See S&P Global Ratings (March 2019) When US Public Finance Ratings Change, ESG factors Are Often The Reason.
21 See FEMA Fact Sheet: FEMA’s Public Assistance Process; FEMA 2018-2022 Strategic Plan.
17ESG INTEGRATION IN SUB-SOVEREIGN DEBT
For the case studies in this section, PRI assigned a category as follows:
Environmental Social Governance
ISSUERS:
ISSUER:
BRAZOS ELECTRIC POWER
PARADISE, CALIFORNIA22
COOPERATIVE, COSERV ELECTRIC23
Event Event
The risk of wildfires has grown in California, amid drier A winter storm in February 2021 had disastrous
and warmer weather in fire season and more people living consequences in Texas, in large part because of its effect
in or near forested areas. on the power supply. The state’s grid is mostly separate
from the rest of the US, leaving it vulnerable when
In late 2018 the Camp Fire struck Butte County, California, generators fail. Electricity firms were forced to purchase
killing 85 people and destroying 19,000 buildings. The power at the maximum rate allowed under regulations,
most damaging and deadly fire on record in the state US$9,000 per megawatt hour versus the average 2020
devastated the town of Paradise and 90% of the 27,000 price of US$22. Natural gas fuel prices jumped too. Almost
residents left, at least temporarily. five million customers went without power and 700
people died, according to a Buzzfeed News analysis of
Credit implication excess deaths.
Paradise was one of three obligors in a pool for a series Credit implication
of bonds issued as part of the California Statewide
Communities Development Authority’s Pension Obligation Companies faced large bills from the Electric Reliability
Bond Program, which allows local governments to finance Council of Texas (ERCOT), which operates the grid that
unfunded pension liabilities. Moody’s downgraded the encompasses most of the state. One company, Brazos
relevant securities, the 2007 Series A-2 Bonds, from B1 to Electric Power Cooperative (BEPC), filed for bankruptcy
Caa3 in January 2019. citing debt owed to ERCOT.
The credit ratings agency said that the damage to BEPC’s troubles had repercussions for CoServ Electric,
Paradise would prevent it from paying debt service on its otherwise known as the Denton County Electric
share of the bonds in the short term. At the time of the Cooperative. CoServ is the largest member of BEPC’s
downgrade, its share of the debt service outstanding was distribution cooperative, taking a third of its electric
41%. sales, and it is obliged to buy from BEPC. In March, Fitch
downgraded CoServ from AA- to A, based in part on the
However, the bonds have since been upgraded to Ba2. expectation that the cooperatives will be forced to bear
Moody’s said that a US$270m settlement Paradise BEPC’s costs as determined by the bankruptcy court.
received from utility PG&E for the latter’s role in the However, the utilities may benefit from moves by state
fire boosts its ability to service debt while maintaining legislators, including allowing the issuance of bonds
operations and investing in capital requirements. backed by customers’ bills.
22 See Aon Weather, Climate and Catastrophe Insight – 2020 Annual Report; California Department of Forestry and Fire Protection; population data from Data Commons; Moody’s
(January 2019) Moody’s downgrades California Statewide Communities Development Authority Taxable POBs 2007 A-2 (CABs) to Caa3 from B1 and assigned a stable outlook; Moody’s
(March 2021) California Statewide Communities Dev. Auth. Update to credit analysis following upgrade of 2007 A-2 POBs to Ba2 from Caa2; Vox (October 2019) The survivors.
23 See Bloomberg (May 2021) Texas Bill Would Spread Blackout Costs Over Decades; BuzzFeed News (May 2021) The Texas Winter Storm And Power Outages Killed Hundreds More
People Than The State Says; Fitch Ratings (March 2021) Fitch Downgrades CoServ Electric, TX’s First Mort Notes to ‘A’ from ‘AA-’; Rating Watch Maintained; Reuters (May 2021) Brazos
seeks approval of $350 million bankruptcy loan; The Texas Tribune (March 2021) Texas lawmakers want to prevent another power crisis. But the legislation doesn’t go far enough
to do that, critics say; The Texas Tribune (May 2021) Texas lawmakers propose electricity market bailout after winter storm; The Texas Tribute (June 2021) Texas power generation
companies will have to better prepare for extreme weather under bills Gov. Greg Abbott signed into law.
18THE US MUNICIPAL BOND MARKET | 2021
The resilience of muni bonds to natural disaster may not
continue, however: ISSUER:
GALLIA COUNTY, OHIO 29
■ Climate change risks are expected to increase over
time. Science-based models indicate that further global
Event
warming will continue to increase the severity and
frequency of acute climate events and intensify climate The biggest taxpayers in Gallia County, located in south-
hazards.24 east Ohio, are coal-fired power plants, accounting for
■ Disaster aid through FEMA could become more more than one-third of the county’s property tax base in
limited going forward, either because the frequency tax year 2019. Gallia’s median household income is 71%
and magnitude of events increases or because FEMA of the national average and the employment rate is 53%,
reduces support to incentivise local governments to be versus 63% nationwide. Doubts over the future of coal in
less complacent and adapt to climate change faster.25 the US raise questions about how communities reliant on
■ Finally, risk recognition ahead of the manifestation of the coal industry will adapt.
physical events could bring forward changes in asset Credit implication
valuations, insurance coverage and capital allocation.
For example, although evidence is still mixed, some The transition to a low carbon economy may ultimately
studies point to price drops for coastal properties. This affect Gallia’s credit quality. Coal plant closures could have
could be due either to exposure to sea level rise or to a detrimental impact on the county’s finances through loss
the perception that this risk may materialise.26 of tax revenues as well as loss of local employment, and
S&P has said that this could lead to lower credit ratings.
TRANSITION RISK The ratings agency has pointed out that the county is
home to a heavy concentration of the natural resources
Transition risks arise from measures taken to mitigate
and mining industries.
the impact of climate change or from policy responses
to climate change. A recent study outlining five different
technological pathways to achieve the target of net-zero
emissions by 2050, in line with the renewed commitment
by the US to the Paris Agreement, highlighted profound
changes to local landscapes, industries and communities in
the next few years.27
Many of these changes will require upfront investment, with
the same study estimating at least US$2.5trn of additional
capital spending towards energy supply, industry, building
and vehicles by 2030. As the ultimate guardians of land-
use planning and public investment, as well as the first
responder to climate-related events, local governments,
counties and municipalities are responsible for the planning
and implementation of adaptation practices.28
Changes to policy and spending priorities will have
repercussions for sectoral economic activities and for state
and local governments’ budgets, especially for those reliant
on economic activities that are vulnerable to transition risks,
such as in the utility sector.
24 See McKinsey Global Institute (2020) Climate risk and response: Physical hazards and socioeconomic impacts.
25 See Bloomberg (May 2021) Why Local Governments Don’t Pay for Expensive Disaster Insurance.
26 See Markus Baldauf, Lorenzo Garlappi and Constantine Yannelis (2020) Does Climate Change Affect Real Estate Prices? Only If You Believe In It: Houses that are projected to be under
water in climate change “believer” neighbourhoods sell for less than those in “denier” neighbourhoods; projected climate changes could change real estate prices decades before
the predicted damages are expected to happen, but the analysis is agnostic about whether believers are overreacting or deniers are underreacting. See Asaf Bernstein, Matthew T.
Gustafson and Ryan Lewis (2019) Disaster on the horizon: The price effect of sea level rise: Homes exposed to sea level rise sell for about 7% less. See Justin Murfin and Matthew
Spiegel (2020) Is the Risk of Sea Level Rise Capitalized in Residential Real Estate?: There are limited effects on prices of coastal home sales based on their inundation thresholds under
projections of sea level rise.
27 See Eric Larson, Chris Greig, Jesse Jenkins, Erin Mayfield, Andrew Pascale, Chuan Zhang, Joshua Drossman, Robert Williams, Steve Pacala, Robert Socolow, Ejeong Baik, Rich Birdsey,
Rick Duke, Ryan Jones, Ben Haley, Emily Leslie, Keith Paustian and Amy Swan (2020) Net-Zero America: Potential Pathways, Infrastructure, and Impacts, interim report.
28 See Global Center on Adaptation State and Trends in Adaptation Report 2020.
29 See Official Statement Relating to the Original Issuance of COUNTY OF GALLIA, OHIO $7,800,000 County Jail Improvement Bonds, Series 2020A (General Obligation) (Limited Tax)
(November 2020); S&P Global Ratings (March 2021) Gallia County, Ohio; General Obligation; The Columbus Dispatch (January 2021) Power plant communities look toward a future
beyond coal; US Census Bureau data.
19ESG INTEGRATION IN SUB-SOVEREIGN DEBT
Ultimately, differing regulations across states and local Below are examples of useful social indicators:
governments, as well as the degree of federal funding for
technical support and guidance, will affect the relevance DEMOGRAPHIC CHARACTERISTICS
of transition risks for muni investors. The choices public Population trends, such those relating to wealth, income and
policymakers face could shape, or be influenced by, local age, affect muni issuers’ current and future budgets.
production, prices and demand preference and will depend
on technology options and costs. With respect to revenues:
Policymakers’ responses will also depend on the challenges ■ The higher the proportion of the population in
for specific locations, industries and communities; employment, the higher the income tax revenue for
population density; public acceptance; and potential co- issuers that collect this tax.
benefits of remedial action (for example, the positive impact
on health as air pollutants are reduced). These factors
■ A wealthier population generates more tax revenues
illustrate the intertwining of environmental factors with through income tax or indirect taxes, such as sales or
social issues and governance. property taxes.31
With respect to costs:
SOCIAL FACTORS ■ A higher proportion of retired public workers is
Muni issuers fund a wide range of essential services with likely to increase pension expenditures. Across state
inherent social implications, such as education, healthcare and local governments, defined benefit schemes
and water supply for local communities. The composition remain preponderant (in 2018, 94% of state and local
and the characteristics of the local population can impact employees had access to such a plan); the ratio of active
the level of spending required for these services and the workers to current retirees varies greatly across states
revenues available to repay debt, whether through general and many plans are underfunded.32
taxes or project-specific income. ■ Spending on welfare and health is likely to depend on
demographics and the population income. The most
Many material social factors are similar to the ones that recent data, from 2017, shows 35% of public welfare
sovereign bondholders consider, such as demographic expenditure and 89% of health and hospital spending
trends, if they apply to the whole population of a state, was funded at the state and local government level,
city or local government.30 In contrast, if the issuer is, for rather than the federal level.33
example, a hospital or museum, then the social factors apply
to a narrower portion of the population. In these instances,
From a pure ESG integration perspective, social risks can
social factors are more similar to those considered by
vary depending on the social and economic features of
corporate bondholders when focusing, for example, on retail
different communities. However, an outcome-based or
customers or company employee metrics.
thematic approach may seek to address problems, rather
than measuring only the risk premium associated with a
muni bond investment.
30 See PRI (2019) A practical guide to ESG integration in sovereign debt.
31 Taxes make up a significant proportion of state and local government revenue. See the Urban Institute, State and Local Revenues.
32 See the Urban Institute, State and Local Government Pensions.
33 See the Urban Institute, Health and Hospital Expenditures; the Urban Institute, Public Welfare Expenditures.
20THE US MUNICIPAL BOND MARKET | 2021
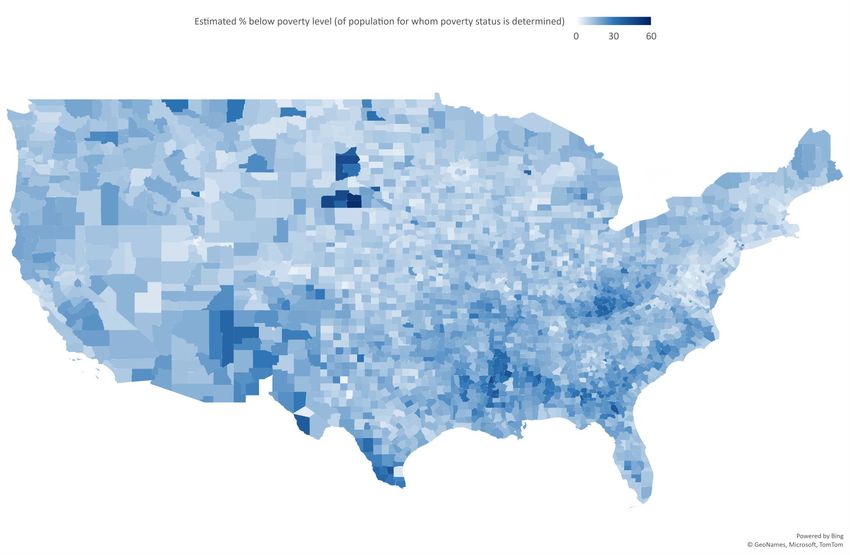
Figure 1o: Poverty rate by county. Source: US Census Bureau, 2015-2019 American Community Survey 5-Year Estimates
Estimated % below poverty level (of population for whom poverty status is determined)
0 30 60
21ESG INTEGRATION IN SUB-SOVEREIGN DEBT
SOCIAL JUSTICE AND EQUALITY EMPLOYEE ISSUES
■ Declining trust in governing institutions among groups ■ A working environment where employees perform well
can pose a risk to credit, for example if it contributes (with low turnover, good training, health benefits and
to social unrest that can damage an issuer’s financial safe working conditions) may benefit an issuer’s financial
position.34 performance and its reputation.
■ At the same time, poor oversight by state and ■ Public sector bodies tend to have a more unionised
local governments of issues affecting minority and workforce, meaning employees have more leverage
disadvantaged cohorts can prevent an equitable to negotiate and address grievances with employers.
provision of services and perhaps hinder local economic Employees also have a greater ability to disrupt the
growth.35 issuer’s activities and financials in the event of a dispute.37
ISSUER:
ISSUER:
UNIVERSITY OF
MINNEAPOLIS, MINNESOTA36
SOUTHERN CALIFORNIA38
Event Event
After George Floyd was killed by a police officer on 25 May The University of Southern California, based in Los Angeles
2020 in Minneapolis, Minnesota, the city became the site of and the largest private university in California, has agreed
unrest, with protests against racial inequality and calls for to pay more than US$1bn to women treated by its former
police reform. More than 1,500 businesses were damaged or gynecologist in relation to sexual harassment and abuse
destroyed in the wider urban area in the weeks following the claims. Some US$852m of this was announced in March
death. Debate in the wake of the incident raised questions 2021, in what news organisation NPR called “the biggest sex
about police funding. abuse pay-out in higher education history.”
Credit implication Credit implication
S&P changed the outlook from stable to negative for the Moody’s changed USC’s outlook from stable to negative
city’s general obligation debt in September 2020, attributed in March 2021 as a result of financial exposure to the legal
in part to the fallout from Floyd’s death. The ratings agency issues. It also said this could lead to reputational harm, which
pointed to potential costs related to reform of policing, could perhaps reduce student demand or philanthropic
potential liabilities from lawsuits related to his death, and support. However, the ratings agency said in March that this
increased worker compensation claims related to the unrest. demand and support had remained robust so far.
It also said that it could revisit its assessment of the city’s
governance risk “if its approach to police reform perpetuates
conditions that could lead to greater social unrest”.
In March, Minneapolis agreed to pay a US$27m settlement
to Floyd’s family, some of which came from its general fund.
Beyond this immediate cost, questions remain over how
cities like Minneapolis reform and fund policing services
and deal with discontent. In 2021, the city’s police budget
fell by US$28m, or 15%, compared with a general budget
cut of 7% across city departments. While this appears to
be a significant slash to policing services, additional funds
are available to the police chief, with city council approval,
and resources have also been re-allocated to alternatives to
policing.
34 See Moody’s (October 2020) Cities shift funds as focus on policing grows; credit impact hinges on costs, social risks.
35 See Moody’s (June 2020) Social unrest and underlying inequality pose fiscal and governance credit risks.
36 See AP (March 2021) Floyd family agrees to $27M settlement amidst ex-cop’s trial; Bloomberg (December 2020) After Pledges to Disband the Police, Minneapolis Makes Compromise
Budget Cuts; Bloomberg (May 2021) Minneapolis One Year Later; Bloomberg (January 2021) Cities Say They Want to Defund the Police. Their Budgets Say Otherwise; CNN Business
(May 2021) One year after George Floyd’s murder, Minneapolis’ businesses are still reeling; S&P Global Ratings (September 2020) Minneapolis GO Debt Outlook Revised To Negative
On Elevated Credit Deterioration Risk From Concurrent Challenges.
37 See Bureau of Labor Statistics (2021) Union Members; Bureau of Labor Statistics (2021) Major Work Stoppages in 2020.
38 See Moody’s (March 2021) Rating Action: Moody’s revises University of Southern California’s (CA) outlook to negative; assigns Aa1 to revenue bonds; Moody’s (March 2021) Credit
Opinion: University of Southern California, CA; NPR (March 2021) USC Agrees To $852 Million Settlement To End Sex Abuse Litigation; NPR (October 2018) USC Reaches $215 Million
Settlement Over Gynecologist Abuse Allegations.
22You can also read