THE USE OF CHEMOMETRICS TO DISCRIMINATE SAMPLE ADULTERATION IN DIFFERENT LEVELS: THE CASE OF PERUVIAN MACA - BRJAC
←
→
Page content transcription
If your browser does not render page correctly, please read the page content below
Brazilian Journal of Analytical Chemistry
Pre-publication – Accepted after peer review
doi: 10.30744/brjac.2179-3425.AR-12-2021
ARTI CLE
The use of Chemometrics to Discriminate Sample
Adulteration in Different Levels: the case of
Peruvian Maca
Heloísa de Carvalho Rodrigues1, Hellen Fernanda da Silva Paulino2, Patrícia Valderrama1 ,
Paulo Henrique Março1*
Programa de Pós-Graduação em Tecnologia de Alimentos, Universidade Tecnológica Federal do Paraná –
1
Campus Campo Mourão, Via Rosalina Maria dos Santos, 1233, Área Urbanizada I, 87301-899, Campo Mourão,
PR, Brazil
Departamento de Engenharia de Alimentos, Universidade Tecnológica Federal do Paraná – Campus Campo
2
Mourão, Via Rosalina Maria dos Santos, 1233, Área Urbanizada I, 87301-899, Campo Mourão, PR, Brazil
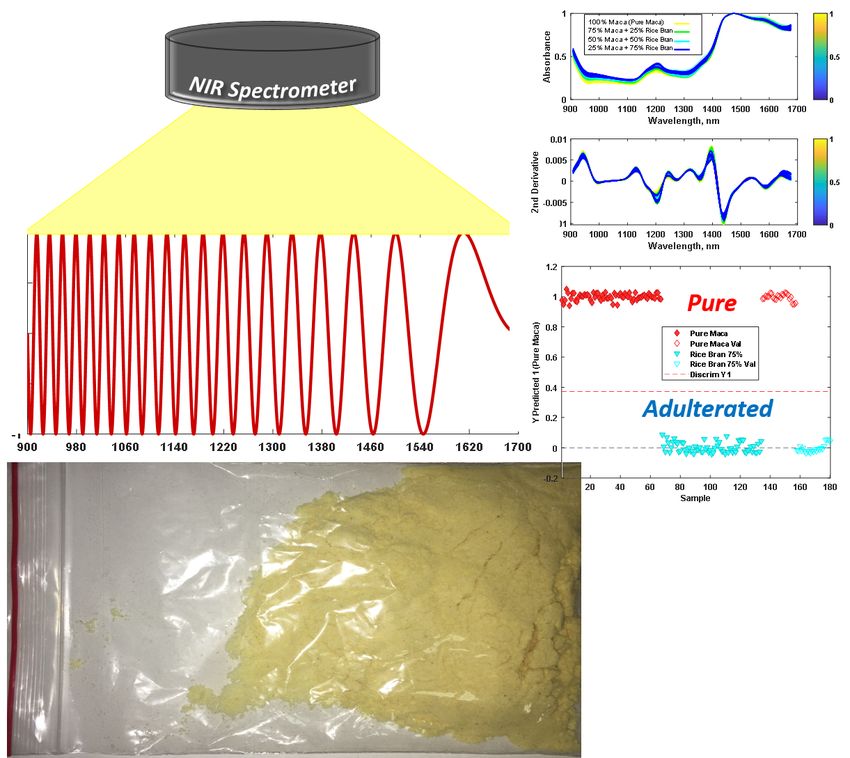
This study aimed to use chemometrics as a tool to
allow for near-infrared (NIR) spectroscopy to
detect adulteration in Peruvian maca powder. To
adulterate the samples, pure maca powder was
mixed with rice flour and rice bran, which are the
most employed adulterants, using proportions of
25%, 50%, and 75% of each. After adulteration,
the mixtures were submitted to NIR spectroscopy.
The spectral data were used to build discriminant
models through Partial Least Squares Discriminant
Analysis (PLS-DA), and each model was
evaluated through permutation tests to check for
reliability. It was observed that all samples were
discriminated against the pure ones, providing
unitary sensitivities and specificities. All the
models built were tested by the pairwise Wilcoxon
signed-rank test, pairwise signed-rank test, and a
randomization t-test, and the results indicated that
the permuted and un-permuted models were not similar. The results indicated that NIR spectroscopy can
be used to discriminate between pure maca powder samples and maca powder adulterated with different
levels of rice flour and rice bran, achieving unitary sensitivity and specificity in the PLS-DA models.
Keywords: food analysis, fraud, Peruvian maca, chemometrics, PLS-DA.
Cite: Rodrigues, H. C.; Paulino, H. F. S.; Valderrama, P.; Março, P. H. The use of Chemometrics to Discriminate Sample
Adulteration in Different Levels: the case of Peruvian Maca. Braz. J. Anal. Chem., 2021, 8 (00), pp 00–00. doi: http://dx.doi.
org/10.30744/brjac.2179-3425.AR-12-2021
Submitted 21 January 2021, Resubmitted 7 April 2021, 2nd time Resubmitted 16 April 2021, Accepted 20 April 2021, Available
online May 2021.
68 1 of 9Braz. J. Anal. Chem., 2021, 8
INTRODUCTION
As a consequence of the modernization of analytical techniques, in the food industry, the interpretation
of the results obtained by chemical analysis referring to the composition of food increasingly demand
chemometric strategies, to allow more assertive interventions. Food fraud and adulteration generally aim
to increase profit, distorting the desired or required characteristics of the original product. These infractions
are recurrent, often due to deficiency or lack of knowledge and or an inspection by the competent authorities.
One of the reasons for that is due to the inspection for fraud detection which requires, in most cases,
time-consuming analysis and/or expensive techniques, such as the ones derived from chromatography,
often demanding sample preparation and trained operator. In this sense, food analysis is a field in which
analytical chemistry is mandatory to allow for food authentication.
According to the Food and Agriculture Organization of the United Nations, the term “superfoods” was
introduced in 2005 by the food and beverage industry to describe a range of fruit and vegetables thought
to confer significant and essential components to human health and nutrition [1]. Nonetheless, there is
a need to check not only the active substances which are present in it but also to verify the possibility
of adulteration. One of the considered super-foods is the Peruvian maca (Lepidium meyenii), which is
a species of tuber grown mainly in the high Andes region of Peru. The consumption of this cultivar is
widespread among inhabitants of that region and is usually related to benefits for human health, with the
effects attributed mainly to the content of the hypocotyl, the region of the plant where many of the most
desired nutrients are concentrated [2]. Interest in maca has been increasing in recent years due to popular
appeal related mainly to fertility. However, considering the form in which this plant is legally marketed
(flour), makes it susceptible to adulteration by the addition of other flours of similar appearance, which is
mainly due to the high market value [3].
Spectroscopic techniques such as in the ultraviolet (UV), near-infrared (NIR), mid-infrared (MIR) regions
appear as possible alternatives for industrial processes that can lead to the detection of fraud, bringing
advantages such as the analysis speed, little or no sample preparation, non-invasive and non-destructive
characteristics, resulting in reduced costs compared to other consolidated techniques, that are used in
standard analytical protocols, as shown in earlier studies as in the case of oil capsules [4], that uses to
be evaluated by gas-chromatography [5]. However, the use of spectroscopic techniques is challenging
when dealing with samples that produce signals with a high degree of similarity, being necessary to use
multivariate statistical methods associated with the chemical knowledge of the samples to allow for a
feasible interpretation [6].
Among these multivariate options, the partial least squares discriminant analysis (PLS-DA) [7] is a
supervised pattern recognition method used for discrimination based on the assignment of classes to
known data and has been successfully used for food analysis. In a previous study, we did apply PLS-DA
to discriminate lettuce cultivated with and without pesticides evaluated through mass spectrometry [8], to
discriminate roasted arabica coffee evaluated by NMR spectroscopy [9], to check for milk adulteration [10]
beside other applications. Therefore, this study aimed to discriminate samples of Peruvian maca powder
adulterated by adding different proportions of rice flour and rice bran. As far as we know, in Brazil, the
main adulteration in this food is done by adding rice bran due to its organoleptic similarity, even though it
has never been formally reported, which encourage us to offer this alternative methodology to be used for
authentication purposes.
MATERIALS AND METHODS
Samples
Nine different samples of Peruvian maca were purchased in the trade of Campo Mourão (Paraná State,
south of Brazil) and region. The samples were found in the form of finely divided powder (in bulk) and in
capsules, totaling 9 different brands. Each sample was divided into 10 different portions containing 10 g of
maca powder, totalizing 90 samples. The acquisition was done during the period from November 2018 to
February 2019. Besides the Peruvian maca samples, though for adulteration purposes.
69 2 of 9Rodrigues, H. C.; Paulino, H. F. S.; Valderrama, P.; Março, P. H.
Sample preparation
The Peruvian maca was adulterated separately with rice flour and rice bran, choosing proportions
considered as low (25%), half (50%), and high (75%) adulteration levels (percentage indicating w/w).
These proportions were chosen considering the discriminant capability and the amount of sample available
to the study. The weighing was performed using an analytical scale model 2204 Bioscale balance, being
samples stored in individual plastic bags, duly identified, and stored under refrigeration to be measured
the next day. Considering 9 different pure maca, the option was using 10 replicates of each sample,
resulting in 90 pure maca samples, 10 pure rice flour samples, 10 pure rice bran samples, 90 samples
adulterated with 25% rice flour, 90 samples adulterated with 25% rice bran, 90 samples adulterated with
50% rice flour, 90 samples adulterated with 50% rice bran, 90 samples adulterated with 75% rice flour,
and 90 samples adulterated with 75% rice bran. The granulometry was not standardized to simulate a
real “in field” application, in which the models would be able to be used for sample screening regarding
adulteration.
Near-Infrared Spectroscopy
The NIR spectra were acquired using a JDSU MicroNIR 1700® spectrophotometer, located in the
CAMulti laboratory at the UTFPR - Campus Campo Mourão. The measurements were performed using
20 scans for each spectrum. Samples were removed from the refrigerator two hours before starting the
measurements to reach room temperature. From each sample, 10 replicates were produced, with the
average spectrum of the 10 measurements used as representative of each sample for all data processing.
The measurements were taken with the samples inside plastic packages, being the same procedure used
for the calibration of 100% reflectance (with the reflectance sphere also packed in plastic) and turning off
the light source to calibrate the zero reflectance.
Chemometrics
The chemometric procedures adopted were mainly related to the elimination of noise and irrelevant
information. Multiplicative Scatter Correction (MSC), standard normal variation (SNV), and second
derivatives were used, and the models obtained from these different treatments were compared in order to
allow for the choice of the best ones in terms of sensibility/specificity [7]. To build the models, the Kennard-
Stone [11] approach was used to select 67 samples for calibration and 23 samples for validation. The best
models were built after mean-centering the spectra and performing MSC to the samples adulterated with
rice bran. To the samples adulterated with rice flour, the best models also demanded performing second
derivatives. All the models were built through cross-validation using the “venetian blinds” method with 10
splits and 1 sample per split.
After pre-processing, PLS-DA was applied to discriminate pure maca samples from 25% adulterated
with rice flour (model 1). Then, pure maca versus 50% adulteration with rice flour (model 2) and so pure
maca vs 75% adulterated with rice flour (model 3). The same procedure was done to the adulterant rice
bran, providing model 4 (pure maca vs 25% adulteration with rice bran), model 5 (pure maca vs 50%
adulteration with rice bran), and model 6 (pure maca vs 75% adulteration with rice bran). The spectral
data were processed using Matlab R2017® and PLS Toolbox 7.8® provided by EMBRAPA Solos do Rio de
Janeiro.
PLS-DA performance
To check for PLS-DA models’ performance, the diagnostic tests used were sensitivity and specificity,
which details can be found somewhere else [7]. Moreover, the models were evaluated through permutation
tests, which are tests in which the “y-block” is randomly reordered. The permutation tests consisted of
verifying the Pairwise Wilcoxon signed rank test, Pairwise signed rank test, and a Randomization t-test
according to Souza et al [8].
3 of 9Braz. J. Anal. Chem., 2021, 8
RESULTS AND DISCUSSION
The models built to discriminate between maca powder from rice bran demanded mean-centering
and multiplicative scatter correction, while the models for the discrimination between maca and rice flour
demanded, besides mean-centering and multiplicative scatter correction, the use of second derivatives.
Otherwise, the models are not able to discriminate between these classes (pure vs contaminated). Table
I presents the sensitivity, specificity, Pairwise Wilcoxon signed rank test (Wilcoxon), Pairwise signed rank
test (Sign Test), and the Randomization t-test (Rand t-test) to each achieved model. Model 1 refers to the
discrimination between pure maca and maca adulterated with 25% rice bran; model 2 to the discrimination
between pure maca and adulteration with 50% rice bran, and model 3 to the discrimination between pure
maca and the adulterated with 75% rice bran. Models 4, 5, and 6 refer to the adulteration of 25%, 50%,
and 75% with rice flour, respectively.
Table I. Parameters of merit of the discrimination models
Latent
Model Sensitivity Specificity Wilcoxon Sign Test Rand t-test
Variables
1 2 1.00 1.00 0.000 0.000 0.005
2 2 1.00 1.00 0.000 0.000 0.005
3 2 1.00 1.00 0.000 0.000 0.005
4 4 1.00 1.00 0.000 0.000 0.005
5 4 1.00 1.00 0.000 0.000 0.005
6 4 1.00 1.00 0.000 0.000 0.005
Figure 1 (A) presents the spectra of pure maca adulterated with 25%, 50%, and 75% of rice bran,
and (B) its respective derivatives, while Figure 1 (C) presents the spectra of pure maca adulterated with
25%, 50% and 75% of rice flour and (D) its respective derivatives. It can be observed that the spectra are
influenced by the adulteration, increasing vibration intensities below 1400 nm when adulterated with rice
bran and decreasing it when adulteration is made by adding rice flour. Moreover, when the adulteration is
done by adding rice bran, it is not possible to see any trend in wavelengths higher than 1500 nm, while for
rice flour adulteration the absorbance to this region trends to go down. The rice bran is made from the rice
skin (obtained from the polishing of the pealed rice) and rice flour is produced by grinding the rice grains.
Therefore, besides the difference in the composition, they differ in the particle size, which is bigger in rice
flour than in rice bran.
4 of 9The use of Chemometrics to Discriminate Sample Adulteration in Different Levels: the case of Peruvian Maca
Figure 1. (A) Spectra of the pure maca and respective adulteration with rice bran and
(B) its respective derivatives; (C) Spectra of the pure maca and respective adulteration
with rice flour and (D) its respective derivatives.
5 of 9Braz. J. Anal. Chem., 2021, 8
Figure 2 presents the model’s discrimination considering only class 1 (pure maca), to differentiate pure
from the adulterated with different bran proportions and the respective VIP scores. The VIP scores indicate
that the most important region to be verified is located around 1100–1200 nm, which is assigned to second
overtones of methylenic stretches [12]. The regions of 960 nm, 1140 nm and 1200 nm correspond to OH,
R-NH2, and CH, and are highly prevalent in the protein molecule and can be related to the protein content
in the samples [13]. Even though the region around 1400 nm, which is assigned to second combination
bands of OH and CH bonds, is down the importance limit in the VIP scores (below 1), it is remarkable that
this region increases together with the addition of rice bran.
Figure 2. Estimated class values for training and prediction sets for discrimination between (A) pure
maca and maca adulterated with 25% rice bran; (B) pure and adulterated with 50% rice bran; (C) pure
and adulterated with 75% rice bran. (D), (E) and (F) are the respective VIP Scores.
6 of 9Rodrigues, H. C.; Paulino, H. F. S.; Valderrama, P.; Março, P. H.
The same strategy was used to discriminate between samples adulterated with rice flour, as shown in
Figure 3. Looking at the VIP scores, it can be observed that, besides 1200 nm, the region between 1400
-1500 nm is above the threshold (value 1), being also important for this discrimination. This region is
assigned to the first overtones of OH stretches [12].
Comparing these effects, the VIP scores suggest that the adulteration made by rice flour is more
susceptible to effects attributed to OH stretches, being possibly related to water absorption, while rice
bran is richer in proteins compared to rice flour. Considering the rice bran composition, the protein content
varies from 13-18% [14,15], while to rice flour, this quantity falls to about 4-7% [16].
Figure 3. Estimated class values for training and prediction sets for discrimination between (A) pure maca and
maca adulterated with 25% rice flour; (B) pure and adulterated with 50% rice flour; (C) pure and adulterated with
75% rice flour. (D), (E) and (F) are the respective VIP Scores.
7 of 9Braz. J. Anal. Chem., 2021, 8
The main drawback of using NIR spectroscopy to discriminate samples regarding adulteration is the
difficulty to characterize the substances responsible for the differentiation. Nonetheless, it seems to be
a feasible tool for sample discrimination, which could allow for a significant increase in the number of
evaluated samples, improving the quality control on these emerging foods.
CONCLUSIONS
NIR spectroscopy can be used as a technique to discriminate Peruvian maca adulteration with rice
bran and rice four since it could be associated with chemometrics tools, showing potential to be used as a
feasible method for sample discrimination regarding adulteration. The use of PLS-DA on the NIR spectral
data allowed for the exploration of different levels of adulteration and the permutation tests confirmed
that the models achieved discrimination of maca samples. Moreover, the adulterants did impose different
influences on the spectra, increasing the absorbance below 1400 nm when maca was adulterated with rice
bran and decreasing it when adulteration was made by adding rice flour. Also, even though all the models
achieved unitary sensibility and specificity, it would be required to increase the variability of the samples
to reach more robustness.
Acknowledgements
This work was supported by the Brazilian National Council for Scientific Research (CNPq), [grant
number 485640/2013-9 and Scientific Beginner], and CAPES (001), besides the CAMult-CM laboratories.
Conflicts of interest
The authors declare that this study has no relationships which may constitute a conflict of interest at
any level.
REFERENCES
1. Hewett, W. E. Post-harvest requirements: farm to market and is there a case for certifying superfruit?
In: Proceedings of the International Symposium on Superfruits: Myth or Truth? Ho Chi Minh, Vietnam,
on 1-3 July 2013, p 140.
2. Lozano-Canales, A.; Janampa-Santome, M.; Clark, D.; Gonzáles, W. L. Sci. Hortic., 2019, 253, pp
341–348 (https://doi.org/https://doi.org/10.1016/j.scienta.2019.04.059).
3. Beharry, S.; Heinrich, M. J. Ethnopharmacol., 2018, 211, pp 126-170 (https://doi.org/10.1016/j.
jep.2017.08.003)
4. Leme, L. M.; Nakamura, F.; Tanamati, A. A. C.; Valderrama, P.; Março, P. H. LWT, 2019, 109, pp 179–
185 (https://doi.org/10.1016/j.lwt.2019.03.088).
5. Martinez, N.; McDonald, B. Veterinary Dermatology, 2021 (https://doi.org/https://doi.org/10.1111/
vde.12950)
6. Ferreira, M. M. C. Quimiometria: Conceitos, Métodos e Aplicações (ISBN: 9788526810631) Editora da
UNICAMP, Campinas, SP, 2015.
7. Brereton, R. G.; Lloyd, G. R. J. Chemom., 2014, 28, pp 213–225 (https://doi.org/10.1002/cem.2609).
8. Souza, S. J.; Valderrama, P.; Consolin Filho, N.; Pilau, E. J.; Tanamati, A. A. C.; Wentzell, P. D.; Março,
P. H. J. Chemom., 2020, 34 (12), e3299 (https://doi.org/10.1002/cem.3299).
9. Happyana, N.; Hermawati, E.; Syah, Y. M.; Hakim, E. H. H. Current Research in Nutrition Food Science,
2020, 8 (2), pp 479–488 (https://doi.org/10.12944/CRNFSJ.8.2.13).
10. Mabood, F.; Jabeen, F.; Ahmed, M.; Hussain, J.; Al Mashaykhi, S. A. A.; Al Rubaiey, Z. M. A.; Farooq,
S.; Boqué, R.; Ali, L.; Hussain, Z.; et al. Food Chem., 2017, 221, pp 746–750 (https://doi.org/10.1016/j.
foodchem.2016.11.109).
11. Kennard, R. W.; Stone, L. A. Technometrics, 1969, 11, pp 137–148 (https://doi.org/10.2307/1266770).
12. Burns, D. A.; Ciurczak, E. W. (Editors) Handbook of near-infrared analysis, 3rd Edition. (ISBN
9780849373930) CRC Press, 2007.
8 of 9The use of Chemometrics to Discriminate Sample Adulteration in Different Levels: the case of Peruvian Maca
13. Workman Jr, J.; Weyer, L. Practical Guide and Spectral Atlas for Interpretive Near-infrared Spectroscopy,
2nd Edition. CRC Press, Boca Raton, FL, 2012.
14. Faria, S. A. S. C.; Bassinello, P. Z.; Penteado, M. V. C. Braz. J. Pharm. Sci., 2012, 48 (4), pp 651–657
(https://doi.org/10.1590/S1984-82502012000400008).
15. Liu, Y.; Zhang, H.; Yi, C.; Quan, K.; Lin, B. Food Chem., 2021, 342, 128352 (https://doi.org/10.1016/j.
foodchem.2020.128352).
16. He, Y.; Chen, F.; Shi, Y.; Guan, Z.; Zhang, N.; Campanella, O. H. Food Science and Human Wellness,
2021, 10 (1), pp 45–53 (https://doi.org/10.1016/j.fshw.2020.05.010).
9 of 9You can also read