The Value of Data and Its Impact on Competition - Marco Iansiti Working Paper 22-002 - Harvard ...
←
→
Page content transcription
If your browser does not render page correctly, please read the page content below
The Value of Data and Its Impact on
Competition
Marco Iansiti

Working Paper 22-002
The Value of Data and Its Impact on
  Competition
  Marco Iansiti
  Harvard Business School

 Working Paper 22-002

Copyright © 2021 by Marco Iansiti.
Working papers are in draft form. This working paper is distributed for purposes of comment and discussion only. It may
not be reproduced without permission of the copyright holder. Copies of working papers are available from the author.
Funding for this research was provided in part by Harvard Business School.
The Value of Data and Its Impact on Competition

Marco Iansiti

Harvard Business School
Boston, MA 02163

Keystone Strategy
Boston, New York, San Francisco, Seattle

Note: The author and Keystone have performed consulting work on behalf of Facebook and most other
technology platforms, as well as the US Department of Justice and the European Commission. The author
thanks Rohit Chatterjee, Junsu Choi, Shehryar Hasan, and Jeff Marowits for invaluable help in performing the
analysis for the paper.

                                                     1
Abstract

Common regulatory perspective on the relationship between data, value, and competition in online platforms
has increasingly centered on the volume of data accumulated by incumbent firms. This view posits the existence
of “data network effects”, where more data leads to product improvements, which in turn leads to additional
users and more data. In particular, this has raised concerns around incumbent data advantage creating an
insurmountable barrier to entry and leading to winner-take-all outcomes in online platforms.

However, this perspective generally does not reflect the value of data in practical settings. More recent work
across economics, management science, and engineering shows that there are a variety of factors that impact
the value of data and that implications for competition are much more complex and subtle. The framework in
this paper presents four key factors – data quality, scale and scope of data, and data uniqueness – that can
influence the value that firms can derive from data.

Applying the framework to Netflix, Waymo, and the online advertising industry provides compelling evidence
that incumbent data advantage, while generating value for innovation and for the consumer experience, does
not necessarily lock out competitors and is not determinative of success. These examples illustrate that data can
often serve as a catalyst for innovation that benefits both consumers and the broader ecosystem. The extent to
which data accumulation can provide actual incremental value, and whether this is a cause for concern in
enabling healthy competition, requires a case-by-case evaluation using the framework, as these factors depend
significantly on the domain and context.

                                                       2
I. Overview
Debate on competition policy in digital markets has increasingly focused on data as the centerpiece of
arguments. A recent government-initiated investigation into possible changes to the UK’s competition
framework, for example, reported that accumulation of data by incumbent firms is a significant barrier to
market entry and could lead to increased concentration in digital markets (Furman et al., 2019).
This view tends to focus on the volume of data accumulated (i.e., “more is better”) and emphasizes the
“feedback loop” generated by data, where more data leads to product improvements, which in turn leads to
additional users and more data – eventually leading to increased revenues and market share for incumbent
firms. Borrowing on the theory of network effects, this has led to discussions around “data network effects”
and how data accumulation can lead to winner-take-all outcomes in online platforms. This perspective,
however, generally does not reflect the value of data in practical settings. While common regulatory perspective
often assumes a superlinear increase in value as a function of data volume, research demonstrates that this is
typically not the case.
The most recent work across economics, management science, and engineering offers some nuance in
understanding the value of data and implications for competition. Firms typically face diminishing returns to
data value, and depending on the context and complexity of the domain, additional data may not necessarily
confer learning across other users of the product. For example, Netflix discovered that there were rapidly
diminishing returns to data in driving improvements in their recommendation algorithm, beyond a modest
threshold. Similarly, Waymo, with all the data it has collected over the past decade, continues to face challenges
associated with the long tail of scenarios its autonomous cars encounter on the road. Waymo’s challenge is
further compounded due to localized learning: learnings from the tail in one city generally do not transfer to
other cities due to specifics such as traffic rules, weather, and geographic terrain.
While both Netflix and Waymo have made significant investments in developing the capabilities and
infrastructure required to leverage data at petabyte-scale, neither has been able to avoid competition. In fact,
both firms have seen increasing levels of competition and innovation in their respective markets. In the case of
Netflix, the new entry of firms such as Disney, HBO, and Apple into content streaming demonstrates that
Netflix’s incumbent data advantage did not lock out competitors. Similarly, Waymo is compelling evidence of
robust competition and innovation amidst significant scale and scope of data. Even in online advertising, which
is frequently cited as an example where data accumulation by incumbents has led to insurmountable barriers to
entry, there is nuance required in assessing data value and data is often not the sole determinant of success.
What appears to be needed is a practical and realistic framework to assess the actual value of data and its impact
on competition. This paper lays out such a framework, integrating ideas from the economics, management
science, and engineering literature. The framework focuses on four key characteristics of data – quality, scaling,
scope, and uniqueness. The extent to which data accumulation can provide actual incremental value and
whether this is a cause for concern in enabling healthy competition can be evaluated on a case-by-case basis
using the framework described.
II. Literature Review
A. Concerns regarding data as a barrier to entry and data network effects
Over the past decade, economists, practitioners, and regulators have voiced concerns regarding market failures
that might arise due to the accumulation of data (Carriere-Swallow and Haksar, 2019; Furman et al., 2019;
Schweitzer and Welker, 2019; de Corniere and Taylor, 2020; Tirole, 2020). In particular, several works have
claimed that there is a self-reinforcing data feedback loop: better access to data helps firms improve upon their
product, leading to more users, which in turn leads to additional data (Farboodi et al., 2019; Ichihashi, 2020).
This has raised regulatory concerns with regards to “big data” as a significant barrier to entry, potentially
3resulting in winner-take-all markets in data-intensive industries, and allowing incumbent firms to leverage their
data resources in order to enter and capture adjacent markets (Stucke and Grunes, 2015; Rubinfeld and Gal,
2017).
More recently, this has extended to the notion that certain markets are characterized by “data network effects”
(Gregory et al., 2020). Markets are characterized by “network effects” when the value of a network to a user
depends on the number of other users on the network (Rohlfs, 1974). Network effects have also been at the
forefront of discussions on competition in online markets, where discourse has centered around network size
being determinative of the outcome of a winner-take-all system and potentially leading to market failure
(Church and Gandal, 1992; Besen and Farrell, 1994; Sheremata, 1997). Extending this to data, some have
claimed that the strength of data network effects depends mainly on data volume and could potentially lead to
market failure in industries where incumbents have access to a large volume of data (Abrahamson, 2014; Prufer
and Schottmüller, 2017).
However, even with traditional network effects, more recent literature suggests that network size is just one
factor in determining the strength of network effects (Kokkoris and Lianos, 2010; Afuah, 2013; Koh et al., 2014;
Hagiu and Rothman, 2016; McIntyre and Srinivasan, 2017; Zhu and Iansiti, 2019; Iansiti, 2021). Claims
regarding remedial failure as a consequence of network effects often rely on strict assumptions and fail to
consider that its strength depends on a wide variety of factors, including network structure and the presence of
multi-homing (Aldrich and Kim, 2007; Choi, Kim and Lee, 2010; Zhu et al., 2019; Jullien and Sand-Zantman,
2021). The same is true for data network effects, where theory has often relied on simplistic assumptions and
has not been translated into a rigorous economic model nor established empirically (Lerner, 2014; Tucker and
Wellford, 2014; Kennedy, 2017; Auer et al., 2019).
B. Additional nuance in characterizing the value of data and data network effects
Recent literature suggests that there are a variety of factors, beyond data volume, that must be considered in
order to understand the value of data and implications for competition. These factors include the ways in which
data can drive product improvements, how learnings from data transfer across users, and whether competitors
are excluded from using similar data (Tucker, 2019; de Corniere and Taylor, 2020; Cappa et al., 2021).
Depending on whether learnings from data are “within-user” or “across-user”, data network effects may not
occur (Hagiu and Wright, 2020a). Across-user learning refers to when a firm is able to improve its product for
each customer based on the learning across data from all customers. This may result in network effects in
specific scenarios – for example, when it is combined with continued product improvements (Hagiu and
Wright, 2020b). On the other hand, while within-user learning can improve the experience for individual users
and generate switching costs, it does not result in a network effect as learning is localized to each user. Other
factors that affect data value include a firm’s position along its “learning curve” (the rate of progress in deriving
learning from additional data) and the properties of that learning curve.
For data to provide a sustainable competitive advantage, they must provide accurate, actionable insights that
can be utilized by firms to drive learning in real-world scenarios (Lambrecht and Tucker, 2015; Athey, 2017).
Data must also be inimitable and rare, resulting in learnings that rivals are unable to easily replicate (Lerner,
2014; Lambrecht and Tucker, 2015). In practice, this occurs infrequently, as data are non-rival in consumption,
have low production costs, and are often either available open source or can be acquired by new entrants
through data markets (Varian, 2018; Jones and Tonetti, 2020). The fact that customers frequently multi-home
across several digital services further weakens data barriers to entry.
C. Engineering literature on value of data
Engineering literature provides a particularly useful lens in understanding the economics of data in real-world
applications. In general, machine learning research has shown that using more data to train and optimize an
4algorithm can lead to improvements in performance (Banko and Brill, 2001; Halevy, Norvig and Pereira, 2009).
This has been particularly true in the case of deep learning, where model performance continues to increase as
a function of the size of the dataset in tasks such as machine translation, speech recognition, and computer
vision (Hestness et al., 2017; Kaplan et al., 2020; Bahri et al., 2021).
However, the same research also shows that the extent to which data can result in a sustainable competitive
advantage depends heavily on the domain and application. Model “learning curves” (how model performance
increases as a function of dataset size) generally consist of three regions: (i) the “small data” or “cold start”
region; (ii) the “power-law” region; and (iii) the “irreducible error” region (Hestness et al., 2017). In the “cold
start” region, models find it challenging to learn from the small number of training samples available, so any
additional data that can be acquired to form a minimum viable corpus are highly valuable. In the “power-law”
region, each additional data point helps to improve the performance of the algorithm. Crucially, there are
diminishing returns to data in this region, the steepness of which is defined by a power-law exponent. In
applications such as machine translation, as an approximation, model performance has been found to improve
with the square root of the number of data points. Finally, the model enters the “irreducible error” region,
where additional data do not help to improve performance.
While the steepness and characteristics of the learning curve (e.g., when each region occurs) are context-
dependent and must be tested empirically, they are crucial in understanding data value and implications for
competition. In one example, research conducted by Amazon found no empirical evidence of a version of data
network effects in retail product forecasting, where increasing the number of products did not result in
substantial improvements across various lines of merchandise, beyond a small threshold (Bajari et al., 2019).1
Other research has shown that in domains such as news personalization and video recommendations, model
performance saturates rapidly with additional data (Takács et al., 2008; Larson et al., 2018; Claussen, Peukert
and Sen, 2019).
The time-dependency of data also impacts the extent to which data are valuable. Depending on the domain,
the relevancy of data can diminish over time due to shifts in customer tastes and behaviors (Chiou and Tucker,
2017; Li and Ching, 2020; Valavi et al., 2020). As a result, a current dataset of bounded size can obtain similar,
or better, performance compared to a much larger volume of historical data (Valavi et al., 2020). In a domain
where data is highly time-dependent, “stocks” of historical data are therefore less valuable than continuous data
“flows”. Relatedly, there has been an increasing amount of research on data quality and relevance as opposed to
data quantity, which shows that whether – and the extent to which – data are valuable is context-dependent.
Individual data points have varying degrees of contribution to algorithm performance, and in the case of
mislabeled data, or data drawn from a different distribution, they can even harm performance (Ghorbani and
Zou, 2019; Jia et al., 2019; Ghorbani, Kim and Zou, 2020; Swayamdipta et al., 2020).
Recent work has also continuously advanced techniques that can be used to replicate learnings with smaller sets
of data, further reducing barriers to entry. Techniques such as synthetic data generation, and transfer and few-
shot learning can help firms achieve a high level of performance with a limited set of context-specific data (He
et al., 2008; Pan and Yang, 2010; Torrey and Shavlik, 2010; Snell, Swersky and Zemel, 2017; Xu et al., 2019;
Brown et al., 2020).
D. A hybrid approach to assessing the value of data and its competitive advantage
It is clear that there is complexity and nuance in assessing the value of data and implications for competition.
The current regulatory perspective, which focuses on data volume and a simplistic view of data network effects,
1 In another dimension, Amazon found that increasing the number of time periods a product was for sale resulted in
increased forecast performance for that specific product (with diminishing returns).
5is inadequate in providing practitioners and regulators a realistic assessment of the circumstances in which data
can provide a sustainable competitive advantage.
A practical framework needs to merge concepts found across economics, management science, and engineering
literature and must be applied on a case-by-case basis, depending on the context and domain, in order to
determine the true value of data.
III. Framework for Assessing the Value of Data and Its Impact on Competition
The value of data, and the extent to which data can confer competitive advantage, depends on four key
dimensions: (i) data quality, (ii) how data value and costs scale with additional data, (iii) scope and boundaries
within and across which data can add value, and (iv) uniqueness of data access and data-enabled learning. Figure
1 below outlines a framework incorporating these dimensions.
6Figure 1: Value of Data Framework
7A. Data Quality
Data by themselves are not inherently valuable if they are not usable. In order to provide value, data first need
to be collected, cleaned, and processed for downstream usage. The complexity of data collection and ensuring
data usability has continued to increase in recent years with the scale and diversity of data collected, with issues
ranging from data discovery (finding the necessary data and serving to those who require it) to data integrity
(Panzer-Steindel, 2007; Talmon, 2020; Dixit, 2021). There are also considerations and processes specific to
making data usable for machine learning systems. For example, data must first be labeled in order to train a
supervised machine learning algorithm,2 and in the case of data dispersion – where multiple relevant datasets
are stored in unique formats – data must be joined into a dataset suitable for machine learning.
Data quality is also determined by how accurate and relevant data are for the task at hand, as measured by the
extent to which data reflect ground truth labels and can improve model performance in real deployment
scenarios. In the context of machine learning systems, mislabeling of data occurs frequently, can be difficult to
identify at scale, and negatively impacts model performance (Northcutt, Athalye and Mueller, 2021). Data
collected for training, and how they are labeled, ultimately determines the output of machine learning systems
and quality of user experience. Non-relevant, low-quality data can cause “data cascades,” where data issues lead
to compounding events causing negative downstream effects that result in technical debt (Sambasivan et al.,
2021). While data cascades are prevalent, machine learning practices have traditionally undervalued data quality
and have instead focused more on data volume and model development.
The duration of data relevancy and how fast it decays over time – referred to as time-dependency – is also crucial
in understanding the value of data, particularly in domains with rapidly shifting user preferences and trends
(e.g., social media, streaming platforms). Loss of data relevancy can lead to deterioration in model performance
and business value. For example, Facebook discovered that using stale machine learning models significantly
impacted performance for a wide set of algorithms the firm deployed, including one designed to ensure
community integrity (as adversaries constantly come up with new ways to display objectionable content).
Algorithms that power the News Feed and Ads Ranking were also impacted significantly by stale models, with
the impact being “measured in hours” for the latter (Hazelwood et al., 2018).3 In such cases, a limited but
current set of data can result in similar, or even better, performance than a large amount of historical data, and
increasing data volume by incorporating older datasets may even hurt performance (Valavi et al., 2020).
The usability, accuracy, relevance, and time-dependency of data significantly influence the degree to which firms
can gain value from data and implications for competition. Each provides an additional dimension to consider
beyond data volume and requires a case-by-case evaluation depending on the domain.
Dimensions of data quality include:
• Usability: how easy is it to ingest and use the data in downstream models and applications?
• Accuracy: does collected data reflect “ground truth” data? For example, mislabeled data will hurt
performance for machine learning models.
• Relevance: extent to which data are relevant (i.e., has statistical power) to deployment scenarios.
• Time-dependency: duration of relevance of data and how fast it decays over time.
2 Supervised learning algorithms rely on an expert-labeled dataset of the outcome (Y) based on the features (X). The
objective is for the algorithm to match these labels as best as possible using the features. For example, a supervised learning
approach to classifying cats vs. dogs would require each picture being labeled appropriately (as either cat or dog). Other
approaches include unsupervised learning, which attempts to identify patterns in the features without labels, and
reinforcement learning, where an agent learns to interact with the environment and aims to maximize the reward it receives
through an iterative process of exploration and exploitation.
3 The deterioration of performance, in this case, was due to the combination of leveraging stale data and models (i.e., not
being able to explore new models and parameters).
8B. Data Scaling
In considering data volume and its implications for value and competition, there must be an assessment of how
additional data can transfer into real-world learnings (e.g., improvements in algorithm performance, product
quality and user experience, revenue and costs). In practical deployments, additional data rarely result in an
exponential increase in algorithm performance and face diminishing returns to scale.
Model learning curves, or scaling laws, are typically comprised of three regions: a “small data” or “cold start”
region, a “power-law” region, and an “irreducible error” region (Hestness et al., 2017). Once a firm is past the
“small data” region and overcomes the cold start problem, it falls into the “power-law” region, which exhibits
diminishing returns to data, until performance finally plateaus in the “irreducible error” region. These regions,
in turn, inform how much value can be derived from data. In the “cold start” region, any additional data are
particularly valuable as models find it challenging to learn from the small number of training samples available.
In the “power-law” region, there are diminishing returns to data, the steepness of which is generally defined by
a power-law exponent that must be tested for empirically.4 Finally, the model enters the “irreducible error”
region, where additional data do not help to improve performance.
Scaling law dynamics are, in part, driven by the fact that data often follow a long-tailed distribution, which has
implications for marginal data value and cost of data acquisition. Depending on the domain, and the extent to
which data are long-tailed, firms may face diseconomies of scale where the economics of data get worse over
time relative to new entrants. This is because the marginal value of an additional data point diminishes quickly
as it becomes more difficult to find a unique, and thus valuable, data point in the tail. In comparison, the cost
of acquiring, processing, and maintaining data found in the tail may plateau, or decrease at a slower rate, as
more time and resources are spent dealing with edge cases. In particular, it is becoming clear that long-tailed
distributions are common in machine learning (Zhang et al., 2016; Van Horn et al., 2017; Liu et al., 2019).
The economics of data depend not only on the length of the tail, but also the coverage required of the tail. This
requirement is heavily dependent on the domain and product specifications – for example, development of
fully autonomous vehicles requires complete coverage of the tail in order to create a functional product (in
which case, data in the tail are both highly valuable and costly to collect), whereas recommendation engines
may require less coverage of the tail in order to deploy a high-quality product.
Finally, the extent to which clustered learning can occur informs the strength of learning effects and the value of
data points in the long tail. A “cluster” typically contains observations that are correlated along a dimension
(e.g., segment of users with similar tastes, or in a similar geographic region). Clustered learning then enables
transferability of learnings across data points in a cluster, or from one cluster to other clusters. For example, in
autonomous vehicle development, transferability can be limited as learnings from one city may not inform
learnings in other cities due to differences in traffic rules, weather, and geographic terrain. At the extremes,
learning can either be “across-user” (where data from an individual user inform learning across all users) or
“within-user” (where learning is limited to only that individual user). However, in most applications, there will
be gradations between those two points, where learning can transfer across clusters of correlated data points.
In assessing the value of data and implications for competition, it is therefore crucial to assess the length of the
tail and coverage required, and the extent to which learnings are clustered. These dynamics ultimately manifest
as scaling laws, and while their shape and characteristics are context-dependent and must be tested for
empirically, they are key in understanding the value of data.
4 This assumes that the model, and model parameters, are fixed. In real-world deployments, learning curves can be closer
to linear in this region with significant engineering effort, through an iterative process of adding high-quality data and
model development.
9Dimensions of scaling include:
• Scaling Laws: how does model performance, or product quality, increase as a function of data volume?
• Long Tail: proportion of edge cases relative to common inputs within data. The extent to which data
are long-tailed will impact the economics of data (marginal value and costs of data acquisition).
• Clustered Learning: how one user’s data (or cluster of users) improve model performance, or product
quality, for another user (or cluster of users).
C. Data Scope
Data scope defines the boundaries within and across which data can be used to derive value. Data are typically
more valuable if it is complementary to other types of data and if it can be reused across a diverse set of use cases.
Combining complementary datasets – sometimes referred to as data “recombination” – can generate significant
performance improvements for machine learning tasks (Jia and Liang, 2016). Recently, this has particularly been
true in recommendation systems, where models such as graph neural networks have been used to leverage
diverse types of data. Pinterest, for example, uses graph neural networks for recommendations, incorporating
the graph structure inherent to its platform (e.g., pins and boards as nodes, membership of pins to corresponding
boards as edges), as well as both visual and textural features, to obtain significant improvements in performance
(Ying et al., 2018). Similarly, Netflix utilizes a diverse set of data for its recommendation algorithms, with inputs
including movie metadata, user demographics, and viewing context (Netflix Technology Blog, 2012).
However, while data recombination can be valuable, it is not guaranteed to result in performance
improvements. In the context of machine learning, the practical issue of data dispersion must be addressed,
where different formats of data – often stored in different places – must first be combined into a dataset that
can be used to train machine learning algorithms (Paleyes, Urma and Lawrence, 2020). Ultimately, the data
being combined must be relevant to the task at hand and there must be meaningful interaction, and
complementarity, between the data to provide benefits.
The non-rival nature of data also allows firms to reuse the same data across many different use cases. For
example, location data can be utilized for several different purposes: Google uses location information not just
to improve search results and personalize advertisements, but to drive research in epidemiology, natural disaster
response, and infrastructure planning (Google AI Blog, 2019). Multiple firms can also collaborate and use the
same data simultaneously, which can drive innovation and efficiency for consumers (Jones and Tonetti, 2020).
For example, both Netflix and Waymo have previously released large datasets to the public, demonstrating how
firms can utilize the non-rival nature of data to drive innovation in their ecosystems.
Dimensions of scope include:
• Complementarity: relevance of data to other available data; a dataset is complementary if it increases
the value of an existing dataset.
• Reusability: ability to use data multiple times for multiple purposes.
D. Data Uniqueness
Data value is further defined by the extent to which they are exclusive and imitable. If data are not proprietary or
do not result in learnings that are unique to a firm, they cannot provide a sustainable competitive advantage.
In practice, data that are useful for driving product improvements are often possible for companies to acquire
or emulate as data are non-rival and have low production costs (Lambrecht and Tucker, 2015; Varian, 2018;
Jones and Tonetti, 2020). Firms have utilized open-source data and data markets in order to acquire data, and
new entrants can often collect similar data resources to incumbents as customers frequently multi-home across
services. For instance, data on social interaction are not unique to Facebook, but are also available on Twitter
10or LinkedIn (among others), and are tailored to each platform (for example, LinkedIn obtains social interaction
data that are more specific, and valuable, for its platform).
Even when data are exclusive, however, it may not lock out competitors if data are imitable and there are multiple
routes to replicate the learnings from data (Lambrecht and Tucker, 2015). Ultimately, users do not select a
product based on the amount of data a firm has access to; instead, adoption is determined by the learnings
from data and how they translate into a better user experience. Both Uber and Lyft disrupting the taxi industry,
and Tinder disrupting online dating, are examples where a superior product experience enabled new entrants
to overtake incumbents, without initial access to a large volume of data.
Furthermore, machine learning research shows continual progress in areas that allow for easier replicability of
learnings from data, allowing firms to achieve high algorithm performance with limited amounts of data. State-
of-the-art techniques include generation of synthetic data using generative adversarial networks, and transfer
learning and few-shot learning, which allow models to be trained on a large dataset and subsequently fine-tuned
on a smaller set of task-specific data (Snell, Swersky and Zemel, 2017; Xu et al., 2019; Brown et al., 2020). These
advancements – while relatively new – serve to further minimize barriers to entry.
In cases where data are truly exclusive and inimitable, they can provide significant value and competitive
advantage. However, data are often not as uniquely valuable as is commonly assumed. When data, or the
learnings from data, are easily imitable by competitors, they cannot provide a sustainable long-term advantage.
Dimensions of uniqueness include:
• Exclusivity: how proprietary and unique data are to a firm.
• Imitability: difficulty of acquiring similar data, correlated or otherwise substitutable data, or achieving
the same results without data.
IV. Case Studies
In this section, I apply the concepts described in the framework above and describe two case studies that
illustrate markets where data are a crucial component, yet market leaders with a large accumulation of data
continue to face robust competition and innovation. The first case study describes Netflix, which is facing
increased competition from new market entrants despite its significant incumbent data advantage.5 The other
case study details Waymo, which despite possessing significant scale and scope of data, also faces competition
in its goal to develop a fully autonomous vehicle. These two case studies illustrate that incumbent data advantage
does not necessarily lock out competitors, and that nuance is required in evaluating the value of data.
Lastly, I also discuss data value in the context of online advertising, which is often used as an example to
demonstrate that data accumulation and “big data” lead to winner-take-all outcomes. I describe two regimes of
data used in online advertising, segmented by time-dependency, and show that it is challenging to conclude that
data volume alone is determinative of success in online advertising.
A. Netflix
Since its earliest days as a DVD-by-mail rental service, Netflix has leveraged data and data-enabled learning to
enhance and personalize the user experience. Now, with over 200 million users across more than 190 countries,
Netflix relies on a sophisticated software and data infrastructure capable of processing petabytes of data per
day in real time. These data are used to train algorithms that influence all aspects of its business, from
recommending content to users to negotiating license agreements.
5 The Appendix contains additional details on Netflix for each dimension of the value of data framework.
11As a premium video streaming business, Netflix relies on relatively weak network effects. While it was able to
provide value to consumers quickly by acquiring a critical mass of movies and TV shows, the same is true for
competitors. Network effects are further weakened by prevalent multi-homing on both sides: Netflix procures
content from production studios that often offer their content across multiple streaming platforms, and many
Netflix users also tend to multi-home across streaming services, in part due to low switching costs.
In the absence of strong network effects, Netflix has continuously invested in harnessing learning effects:
developing infrastructure to collect and process high quality data, increasing the scalability of its algorithms and
the extent to which clustered learning can occur,6 and expanding data scope. However, despite the firm’s early
focus on data and data-enabled learning, Netflix has not been able to avoid competition.
There are many reasons for sustained competition in premium video streaming services. First, there are limits
to scaling of data value in the video streaming industry, where marginal value of data saturates rapidly while
content and user acquisition costs continue to incur significant costs (Amatriain, 2014). Second, competitors
have been able to imitate Netflix’s learnings from data, tailored to their own platform, after reaching a critical
mass of content. Lastly, the competitive advantage that Netflix can derive from stocks of historical data is
further weakened by time-dependency, where the relevancy of streaming data decays significantly with time
(Hardesty, 2019).
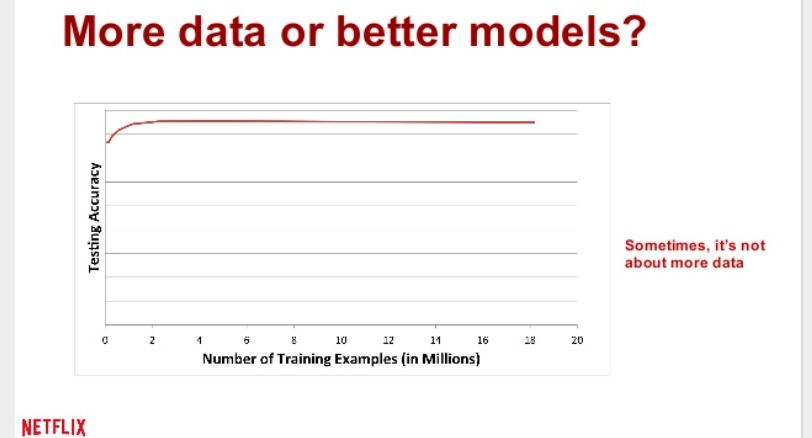
This is well-illustrated by the competitive landscape in the video streaming market. A number of firms offer
competitive options in the video streaming space, including Amazon and Hulu. New market entrants are
common: in recent years, multiple firms including Disney, HBO, Comcast, and Apple have entered the market,
leading to a substantial decrease in market share for Netflix. In the year 2020 alone, Netflix saw its global market
share fall from 29% to 20% (Frankel, 2021) and its share of streaming activity fell from 32% to 22% from Q2
to Q4 2020, largely as a result of new market entrants (Reelgood for Business, 2021).
6In 2016, Netflix transitioned from local models (for each geographic region) to a global model for its recommendation
engine, which allowed it to better leverage clustered learning and offer improved recommendations to users in new
markets, as well as users with niche tastes. Additional details are found in the Appendix.
12Figure 2: Subscription Video on Demand Streaming Share, Top Five Platforms, Q2-Q4 20207
It is clear that Netflix’s incumbent data advantage has not been able to lock out competitors in the video
streaming market. Instead, in order to remain competitive and attract customers, firms have had to continuously
innovate on content and provide a more personalized user experience tailored to their platforms. Disney Plus,
as a platform that has a lot of repeat viewing and a mix of short and long form content, is working to identify
characteristics that define repeat viewing behavior (e.g., story arcs, protagonists); taking into account the specific
context of the user’s experience (for example, recommending a short if that appears to be the user’s current
“mood”); and using natural language processing to analyze closed caption files to understand the “aboutness”
of content and its emotional arcs (Forbes Insights Team, 2020). On the other hand, HBO Max is taking an
alternative approach to personalization. While algorithms are still used to recommend content, human curation
is heavily emphasized, with pockets of the platform dedicated to content recommended by curators ranging
from WarnerMedia editors to celebrities (Alexander, 2020).
This competitive innovation has resulted in a diverse set of capabilities and experiences across video streaming
platforms, providing a wider range of options to consumers. In the video streaming market, it is this innovation
that attracts users and data to each platform in the first place, whereas large volumes of data and data network
effects have a limited role in foreclosing competition.
B. Waymo
Waymo first started as an experimental self-driving car project inside Google’s X lab in January 2009. Through
the spinoff and transition to a subsidiary under Alphabet in 2016, Waymo has continued to focus on its goal of
bringing autonomous vehicles to market.
7Figures adapted from Q3 2020 Video Streaming Report and Q4 2020 VOD Streaming Report (Santos, 2020; Reelgood for
Business, 2021).
13Waymo relies significantly on machine learning algorithms to power key components of autonomous driving
across perception, prediction, and planning. As such, data are essential in the development of fully autonomous
vehicles. To collect data to train its neural networks, Waymo vehicles have driven over 20 million miles on
public roads across 25 cities and have generated petabytes of data daily through the suite of lidar, radars, and
high-resolution cameras equipped on its vehicles (Waymo, 2020b; Wiggers, 2020). In addition to real world
driving, Waymo also utilizes computer simulations to expand the scale and complexity of the data that it collects.
A simulation enables for more miles to be driven (more than 20 million miles are driven per day inside Waymo’s
simulation software) and helps to accelerate the velocity of learning by introducing edge cases and testing
experimental scenarios. By April 2020, Waymo had driven over 15 billion miles in simulation (Waymo, 2020a).
However, more than a decade after inception, despite the immense amount of data and learnings generated
from millions, and billions, of miles on public roads and in simulation, Waymo has not been able to avoid
competition and a fully autonomous vehicle remains some time away (Abuelsamid, 2018). One key technical
challenge has revolved around the long tail of scenarios a vehicle encounters on the road, as autonomous
vehicles require full coverage of edge cases (i.e., it is not acceptable for an autonomous vehicle to succeed in
99% of scenarios and fail in the other 1%, as compared to, for example, searches on Google or music
recommendations on Spotify). Learning from the tail is further complicated by limited clustered learning: in
many cases, learnings from one city do not transfer to others due to differences in traffic rules, weather, and
geographic terrain.
Thus, in autonomous driving, the limits of scaling of data value are primarily driven by the long tail of scenarios,
the coverage required across the entirety of the tail, and the limited transferability of learnings from edge case
to edge case (localized learning). Due to these factors, there is a decreasing marginal utility to data, as the
majority of data collected represents common scenarios that the software has already learned how to perceive,
predict, and plan around. On the other hand, costs associated with collecting, processing, and utilizing
additional data will generally stay flat, as the system must be tailored to deal with each edge case.
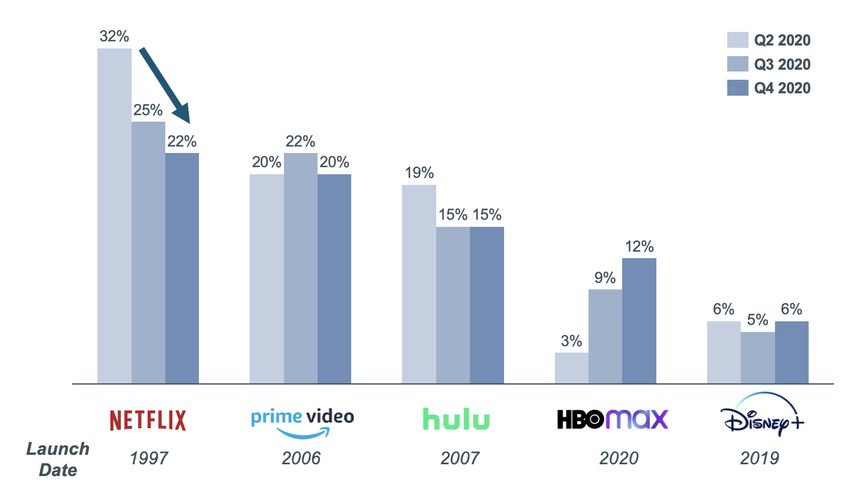
These challenges, and the amount of competition and innovation in the autonomous driving space, is reflected
in Waymo’s valuation over time. While Waymo holds a first-mover advantage and has collected more data than
nearly all of its competitors, its valuation has been falling relative to these competitors in recent years. Between
2018 and 2020, Waymo’s valuation fell from $175 billion to $30 billion. At the same time, competitors have
continued to receive external funding, and in many cases have seen their valuations rise. For example, in January
2021, GM’s Cruise raised $2 billion at a valuation of over $30 billion.
Figure 3: Funding and Valuation of Autonomous Driving Companies, 2018 – 2021
Waymo valued at $175B Waymo valued at $105B Waymo raises $2.25B Argo AI valued at over $7.5B, Pony.ai raises $100M Toyota acquires Lyft
by Morgan Stanley by Morgan Stanley at $30B valuation raising over $2.6B from VW Group at $5.3B valuation A.V. division for $550M
2018 2019 2020 2021
Cruise raises $1.15B Amazon acquires Cruise raises over DiDi Chuxing A.V. division
at $19B valuation Zoox for over $1.2B Aurora merges with Uber $2B at $30B valuation valued at over $6B
A.V. division, creating
company valued at $10B
Data are clearly crucial in developing autonomous vehicles. The long tail of scenarios, however, along
with the requirement of full coverage of the tail, means that the relative advantage that Waymo derives
from data can become smaller over time in comparison to competitors. Thus, despite Waymo’s
advantage in the scale and scope of data collected over the past decade, it is clear that this data advantage
has not locked out competitors. There has been an enormous amount of competition and innovation in
14the space, as seen by competitors such as Cruise and Argo AI. Interestingly, competition around data has
continued to become more open in nature, with firms starting to release large, high-quality datasets into
the open (e.g., Waymo Open Dataset, Argo AI Argoverse) in order to spark innovation in the research
and development of autonomous vehicles.
C. Online Advertising
Online advertising is often cited as an industry where data accumulation by incumbents has created an
insurmountable barrier to entry. This is sometimes argued to be caused by “network effects” associated
with the scale and scope of data collected (Newman, 2014; Stucke and Grunes, 2015).
However, the reality is that understanding the value of advertising data is complex. Ultimately, the value
of advertising data depends on many factors including data quality, complementarity with other existing
data, how data drive improvements in personalization, and, in turn, when increased personalization
translates into increased ad effectiveness (Arnold et al., 2018; Dobson, 2018). This value can be
significantly less than is often assumed in regulatory discussions. In one example, research demonstrated
that for a national apparel retailer, incorporating additional data such as demographics and ad exposure
data provided essentially no performance improvements, while other types of data such as purchase
history and retail-defined customer categories provided only minor improvements (Johnson, Lewis and
Reiley, 2017). In fact, in this case, reducing data volume by removing purchase data prior to a customer’s
first ad exposure increased performance substantially more than adding new data.
Furthermore, the impact of advertising data on competition is also complex. In the context of targeted
advertising, data can be thought to fall into one of two separate regimes depending on its degree of time-
dependency. The first regime consists of stable, low time-dependency data, which are used to infer
consumer characteristics that change slowly, or predictably, with time. Such characteristics include socio-
demographic factors (e.g., age, race, education) and chronic health conditions (e.g., diabetes,
hypertension). As this type of data has very stable time-dependency and can be identified across various
points in time, it is generally not unique to specific platforms. For example, demographic and user
interest data can be acquired from a variety of sources, including data providers such as comScore and
Nielsen.8 Other firms, from news publishers to smaller online stores, can also infer similar data on
consumer characteristics to guide targeted advertising (Computer and Communications Industry
Association, 2019). Due to this lack of exclusivity, possessing a large stock of low time-dependency data
typically does not provide a sustainable competitive advantage, especially as much of the data collected
are duplicative and do not provide new insight on consumer characteristics. Research has also shown
that low time-dependency data are often less valuable for targeted advertising compared to data that
reveal short-term trends in user behavior (Yan et al., 2009; He et al., 2014).
The second regime encompasses highly time-dependent data. Examples of such data include geo-
location information for targeting consumers in a particular area and customer purchase intent data.
While this type of data can be quite valuable for advertisers, it also has rapidly decaying utility, and data
that are no longer relevant can fail to deliver returns on ad spending (McKenna, 2017; Oakes, 2020). For
example, once a customer leaves a certain geographic location, data that may have enabled hyperlocal
advertisements can immediately lose most of their value. As a result, with high time-dependency data,
continuous flows of data can be significantly more valuable than a large stock of historical data, which
reduces any competitive advantage that incumbents may have due to data accumulation. In addition,
high time-dependency data may also not be exclusive. Location data is frequently accessed by many
applications on a consumer’s phone and consistently available to a wide range of advertisers
8For example, see https://www.comscore.com/Products/Activation/Audience-Targeting-Solution and
https://www.nielsen.com/us/en/solutions/capabilities/audience-segments/ for comScore and Nielsen data.
15(Almuhimedi et al., 2015). Advertisers can also acquire location data through marketplace vendors such
as Foursquare, which further lowers the exclusivity of such data.9
Finally, across both regimes, there is a limit to how much data value can scale. Advertising data faces
diminishing marginal utility, as the long tail of data generally contains information on thinner segments
of the market that attract fewer advertisers (Arnold et al., 2018). In some cases, joining together diverse
datasets, including granular consumer-level information, may not improve the performance of targeted
advertisements as the data may not be complementary (Johnson, Lewis and Reiley, 2017). This can also
be true for data collected across multiple products or services, as data generated for each product are
generally specific to that product and may hold limited complementarity with other existing data.
Based on these factors, it is difficult to conclude that the success of platforms in online advertising is
solely due to the scale and scope of data accumulated. Their success is more likely due to a confluence of
factors, including not only the value of data collected, but also innovation in product development, a
competitive pricing strategy, and extensive sales efforts.
V. Conclusion
While common regulatory perspective on the relationship between data, value, and competition tends to
focus on the volume of data accumulated by incumbents and posits the existence of data network effects,
more recent work across economics, management science, and engineering shows that there are a variety
of factors that impact the value of data and that implications for competition are much more complex and
subtle.
The framework in this paper presents four key factors – data quality, scale and scope of data, and data
uniqueness – that can influence the value that firms can derive from data. Understanding data value and
its likely impact on competition requires a careful case-by-case evaluation, as these factors depend
significantly on the domain and context. These factors also illustrate that the volume of data accumulated,
by itself, does not determine data value. Applying the framework to Netflix, Waymo, and the online
advertising industry provides compelling evidence that incumbent data advantage, while generating value
for innovation and for the consumer experience, does not necessarily lock out competitors and is not
determinative of success. As these case studies show, data serve as a catalyst for innovation that benefits
both consumers and the broader ecosystem.
9 See https://foursquare.com/products/audience/ for Foursquare’s offerings.
16VI. Appendix: Details on Case Study
A. Netflix
Since its earliest days, Netflix recognized the importance of using data to personalize the user experience.
With the pivot towards online streaming in 2007, Netflix started to leverage an increasingly diverse set of data
to personalize content for users. The company now provides personalization for over 200 million subscribers
spread across more than 190 countries, and at the core of Netflix sits a sophisticated software and data
infrastructure that collects, processes, and deploys petabytes of data daily. Netflix uses this data to train
algorithms to influence virtually every aspect of its business, including recommending content to users,
optimizing the signup process, and negotiating license agreements.
However, despite Netflix’s significant investment in data, it has faced significant competition in the video
streaming market. In recent years, multiple firms including Disney, HBO, Comcast, and Apple have entered
the market, leading to a substantial decrease in Netflix’s market share. The following discusses Netflix’s
investments in assuring data quality, increasing the scope in which data is deployed, and enhancing data
scalability to show how the firm’s investments in data have driven innovation and have benefited customers.
However, at the same time, the case study explores the limits to scaling data value, as well as how competitors
have been able to imitate Netflix’s data-driven learnings.
1) Data Quality
Netflix has invested significantly in developing infrastructure and processes to enable real-time usability of
data. In order to effectively capture and use the trillions of data events that are generated on the platform
daily, Netflix developed its “Keystone Stream Processing Platform” as the firm’s data backbone, allowing data
to be collected, processed, and aggregated in real time (Netflix Technology Blog, 2018b). Data collected
includes video viewing metadata, user interface interactions, performance data, and troubleshooting records.
Netflix also spends considerable effort in optimizing the relevance of data that it uses to train its algorithms.
For example, in 2017, Netflix shifted from a star-based rating system to a simpler “thumbs-up” model
(Roettgers, 2017). One primary reason for this shift was the recognition that star-based ratings were not
necessarily good predictors of what users were interested in watching – for example, “users would rate
documentaries with 5 stars, and silly movies with just 3 stars, but still watch silly movies more often than
those high-rated documentaries” (Roettgers, 2017). The “thumbs-up” feedback model provided a clearer link
to personalization and resulted in an over 200% increase in ratings collected (Netflix, 2017). This was also
part of a broader shift at Netflix, from relying solely on the billions of ratings it had collected in its early days
of personalization, to recognizing that certain types of data are more relevant than others (i.e., implicit user
behaviors matter more than explicit ratings).
While Netflix has spent considerable effort to increase the relevancy of the data it collects, it operates in an
industry where this relevancy also decays rapidly over time. Netflix’s catalog of videos is updated constantly
and viewership tends to decay rapidly after movies are newly released. Research from competing video
streaming service, Amazon Prime Video, confirms that users are far more likely to watch a recent release than
a highly rated classic (Hardesty, 2019). Due to this time-dependency of data, effectively capturing a real time flow
of data generated on the platform (“data flows”) is far more valuable to Netflix than a large volume of
historical data (“data stock”) that will continue to decay in value with time.
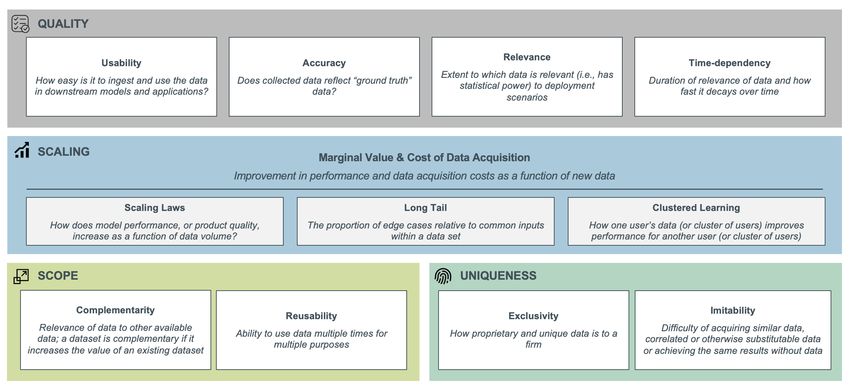
2) Scale Effects
Content recommendation is a core use case for Netflix. For recommendations, however, data faces
significantly diminishing returns. In 2014, Xavier Amatriain, Netflix Director of Algorithms Engineering,
17showed that the performance of Netflix’s in-production recommendation algorithm showed no improvement
after just 2 million training examples (Amatriain, 2014).
Figure 4: Netflix Recommendation System Scaling10
This rapid saturation in performance is, in part, due to Netflix’s long tail of content. On one hand, this
content is extremely valuable for Netflix and its viewers, and Netflix devotes significant effort to increase
customer engagement by promoting the full extent of its video catalog in recommendations (Gomez-Uribe
and Hunt, 2016). On the other hand, the cost of acquiring long tail content will likely continue to incur
significant costs for Netflix (in comparison to, for example, YouTube, where long tail content emerges
organically as it is community driven).
These challenges were further compounded by limited clustered learning across users in individual regions.
Initially, Netflix divided member countries into groups based on geographic region, language, culture, and
video availability. In 2016, Netflix announced a pivot towards a single global model leveraging over 2000
“taste micro-clusters,” which defines groups of users with shared viewing interests. This transition allowed
Netflix to offer better recommendations to users in new markets, as well as users with niche tastes:
“Another example of what our global recommendation system means for members around the world
comes from the global community of health-conscious foodies, who are very interested in learning
about food and the industry around it …
The percentage of members from each country in this community is actually relatively small. So if we
were relying just on the data from a single country (especially a new one with a smaller number of
members), our personalized recommendations would suffer as a result. By leveraging data from
across the world and countries of all sizes, our global algorithms are able to tap those insights to
make recommendations for this food conscious community that are more accurate and robust.”
(Netflix, 2016)
3) Scope
Netflix initially relied exclusively on user ratings to train its recommendation algorithms (Roettgers, 2017). By
2012, however, Netflix was using data inputs ranging from video metadata to external social data for training
its recommendation algorithm, which resulted in a significant improvement relative to relying solely on user
ratings (Netflix Technology Blog, 2012). More recently, Netflix has experimented with deep learning models
10 Excerpt from “10 Lessons Learned from Building ML Systems” (Amatriain, 2014).
18in order to make contextual recommendations by leveraging sequential context about the user (e.g., country,
device, time, content consumed) to predict what the user will engage with next based on their current context.
In particular, combining this with discrete time variables (e.g., day of week) and continuous time variables
(i.e., timestamps) resulted in a more than 40% improvement over traditional matrix factorization techniques
(Basilico, 2019).
Netflix has also continuously expanded the scope in which data drives value by reusing data across use cases.
Netflix now uses user viewing history not just to drive personalized recommendations, but also to personalize
the artwork that individual users see (Netflix Technology Blog, 2017). Other examples include utilization of
historical movie metadata to inform its content production; using factors such as viewing history, connection
speed, device preference to improve the user streaming experience; and optimizing the sign up experience
based on users’ device, location, payment methodology, and more (Netflix Technology Blog, 2018a, 2020).
4) Uniqueness
Ultimately, however, competitors have been able to imitate the data that Netflix collects and the learnings
enabled by that data. While Netflix’s data is proprietary and exclusive to Netflix, competitors such as Hulu,
Amazon Prime Video, and Comcast Peacock have been able to obtain a critical mass of content and thus
obtain data that is most valuable for its own platforms in order to power their algorithms. For example,
Disney Plus, as a platform that has a lot of repeat viewing and a mix of short and long form content, has
invested in identify characteristics that define repeat viewing behavior (e.g., story arcs, protagonists) and
taking into account the specific context of the user’s experience (Forbes Insights Team, 2020). Other
platforms have also invested significantly in developing sophisticated data pipelines and recommendation
engines – for example, Amazon Prime Video recognized the importance of time-dependency early on and
optimized their neural network training procedure to take into account data freshness (Hardesty, 2019).
19You can also read