The vital sign and haematological profile of adult dengue fever: a retrospective study
←
→
Page content transcription
If your browser does not render page correctly, please read the page content below
AIMS Medical Science, 8(1): 56–69.
                                                                          DOI: 10.3934/medsci.2021007
                                                                          Received: 10 November 2020
                                                                          Accepted: 18 February 2021
                                                                          Published: 08 March 2021
http://www.aimspress.com/medicalScience

Research article

The vital sign and haematological profile of adult dengue fever: a
retrospective study

Norhayati Mohd Zainee1, Kalaivani Chellappan1,*, Joseph Vehi2 and Petrick Periyasamy3

1
    Department of Electrical, Electronic and Systems, Faculty of Engineering and Built Environment,
    National University of Malaysia, 43600 UKM Bangi, Selangor, Malaysia
2
    Institute of Computer Science and Applications, Polytechnic IV, University of Girona, Campus
    Montilivi, 17071 Girona, Spain
3
    Infectious Disease Unit, Hospital Canselor Tuanku Muhriz, Pusat Perubatan UKM, Jalan Yaacob
    Latif, Bandar Tun Razak, 56000 Cheras, Wilayah Persekutuan Kuala Lumpur, Malaysia

* Correspondence: Email: kckalai@ukm.edu.my; Tel: 60389216600; Fax: 60389118359.

Abstract: Monitoring clinical symptoms of dengue fever based on vital signs and blood profile in each
phase of the disease is crucial for the early case detection, and the management of serious cases with
adequate care minimizes dengue mortality. To assess changes in vital signs and blood profile in acute
dengue infection, the vital signs and haematological parameters of 63 dengue patients were
retrospectively analysed between day 3 and day 8 of illness. These patients visited the emergency
department and were admitted to Canselor Tunku Muhriz Hospital, Pusat Perubatan Universiti
Kebangsaan Malaysia between Jan 2015 and 2016; classification was done according to the World
Health Organization and the Malaysian Clinical Practice Guidelines. The data were analysed using
SPSS Version 23 and visualized with MATLAB R2020a based on the severity of dengue fever and day
of illness. On day 3 of illness, there is a significant trend in heart rate of dengue patients of all categories,
with a significant difference of p = 0.030. On day 4 of illness, there is a statistical difference in the
platelet (p = 0.028) and white blood cell count (p = 0.019) of dengue female patients in the category
with warning signs and severe dengue recovery. On the other hand, there is a significant difference in
vital signs namely heart rate, body temperature and diastolic on day 5 of illness, with the p-value of
0.011, 0.019 and 0.016, respectively. On day 6 of dengue illness, there is a significant difference in the
heart rate (p = 0.015), systolic (p = 0.006) and diastolic (p = 0.027) in dengue patients of all categories.
A significant difference can only be observed in the heart rate (p = 0.011) of all patients and haematocrit
(p = 0.023) of female patients on day 7 and 8 of illness, respectively. This paper reports the trend in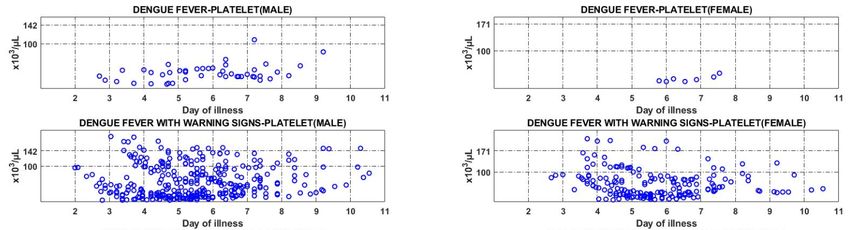
57

key signs and blood profile of dengue patients classified according to the latest WHO case description,
based on the day of illness.

Keywords: dengue; vital signs; emergency medicine; physiology; classification

1.   Introduction

      Dengue fever is an acute febrile disease caused by the dengue virus, transmitted to humans
through the bites of infected female Aedes aegypti mosquitoes [1,2]. The disease is one of the top five
reported diseases in Malaysia [3]. Ministry of Health of Malaysia reported 111,285 dengue cases, with
301 deaths, to the World Health Organization (WHO) in 2015. Malaysia iDengue community portal
reported 51,665 dengue cases, with 117 deaths in the first half of 2016 alone, from January 3rd to June
18th [4]. Infection by any of the dengue virus serotypes (DENV-1 to -4) confers a lifelong immunity
against the specific serotype of the virus, but not against the others [5,6]. To improve on triage and
case management for dengue fever, classification is made as updated by WHO in 2009 as follows:
dengue fever without warning signs (DF), dengue fever with warning signs (DFWS), and severe
dengue (SD) [7,8].
      The three dengue categories are classified into Group A, Group B and Group C for dengue case
management [9]. The classification is made based on the severity of dengue, the clinical signs and
circumstances of the patient [5,10]. Dengue patient with stable haematocrit reading, without any
warning signs, such as abdominal pain or tenderness, persistent vomiting, clinical fluid accumulation,
mucosal bleed and lethargy, are classified as Group A. Patients of this group are usually instructed to
self-monitor at home, and to refer to the hospital should any warning signs start to develop [10]. Group
B refers to patients with warning signs, who need to be monitored at the hospital [9,10], while Group
C refers to those with severe dengue, who require emergency treatment [10].
      There are three clinical phases of dengue infection following an incubation period of 4–10 days:
febrile, critical, and recovery [11]. During the febrile phase, patients progress into high-grade fever,
i.e., body temperature between 39 ℃ and 40 ℃, with facial flushing, headache, myalgia and
gastrointestinal symptoms that last for typically two to seven days [7,12]. The dynamic nature of
dengue makes the symptoms of severity observable during defervescence, which correlate with the
onset of critical phase [10]. If defervescence occurs, around day three to seven of illness, the patient
might enter the critical phase, a point which most mortality events occur [13,14]. During this phase,
increase in haematocrit (HCT), followed by a rapid decrease in platelet (PLT) counts, precedes plasma
leakage—increase in HCT above the baseline often reflects the severity of plasma leakage [15,16]. In
terms of vital signs, an increase in DBP variable and the narrowing of PP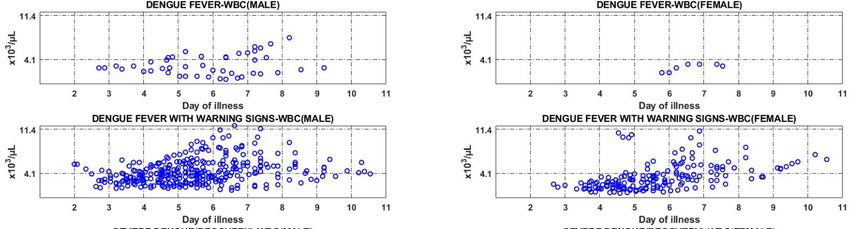
58

2.   Methods

2.1. Data collection and patient selection

      Clinical data in this study were obtained from a database of patients who were present at HCTM
Emergency Department between January 2015 and January 2016, suspected of dengue fever and
admitted to the wards for monitoring (HCTM casemix classification A90 for “dengue fever” and A91
for “severe dengue”). Only patients with the following criteria were selected: a Malaysian citizen aged
between 15 to 60 years old; confirmed with acute dengue infection through laboratory tests, either
positive for the NS1 antigen or the dengue IgM antibodies tests; and does not have premorbid
conditions such as diabetes, pregnancy, renal failure and HIV. Patient information was checked using
the emergency department observation logbook; the related information was collected from medical
records using the MRN number. Information about the variables associated with the baseline vital signs
of the patient were obtained from the patient registration form at the emergency department; data
related to the vital signs were retrospectively obtained from the patient’s dengue charts; the blood
profile was obtained from the HCTM online database. The study was approved by the Research Ethics
Committee of HCTM (UKM1.5.3.5 /244/FKAB-2015-03).

2.2. Data preparation and presentation

     Medical physicians who attended the patients classified the cases according to WHO guidelines
and the Malaysian Clinical Practice Guideline (CPG) for dengue [5,7]. To facilitate the analysis, in
addition to the DF and DFWS classifications, the severe dengue classification was further divided into
“severe dengue with recovery” and “severe dengue resulting in death”, abbreviated as SD(R) and
SD(D), respectively.
     Once the appropriate information was collected, the Microsoft Excel 2010 was used to sort the
disease information for each dengue fever classification. Kruskal-Wallis Test was used to analyse the
collected data using IBM SPSS V23 based on the non-parametric nature of the data. Graphical analysis
and presentation were performed using MATLAB version R2020a. To construct the blood profile
graphs, the day of illness was represented on the x-axis, while the minimum and maximum standard
reference values for the blood profiles were represented on the y-axis. There are three y-tick lines in
the HCT graph to indicate the minimum and maximum value, and the median baseline. The normal
range of HCT for males and females are dissimilar; the range of HCT for males is between 40.1% and
50.6%, and for females, it is between 35.1% and 44.9%. The median baseline was included as it is an
indicator of plasma leakage in dengue infection [7]; the medians for males and females are 46% and
40%, respectively, according to the Malaysian CPG for dengue [5]. For the PLT count, two y-tick lines
were assigned, whereby the top number is the actual minimum value of PLT, i.e., 142 × 103/µL for
males and 171 × 103/µL for females. The trend in PLT count may decrease below the minimum level
during dengue infection. To indicate plasma leakage [20], a second, lower value of 100 × 103/µL was
included in the graph. The y-ticks on the WBC count graph represents the minimum (4.1 × 10³/µL)
and maximum (11.4 × 10³/µL) value for both sexes.

AIMS Medical Science                                                             Volume 8, Issue 1, 56–69.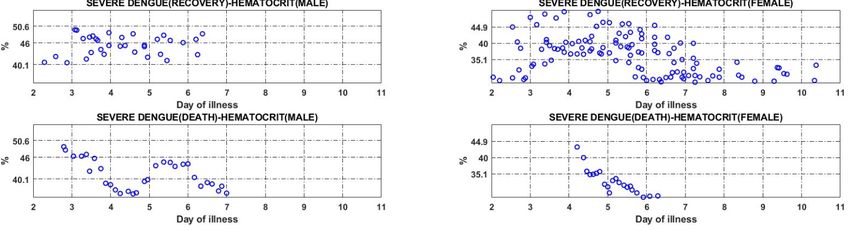
59

3.   Results

     In this study, 63 dengue patients registered at the emergency department for admission to HCTM
between Jan 2015 and Jan 2016 were selected. The spectrum of dengue fever was described by the
selected patients, which met the screening criteria. Sample characteristics and laboratory results
according to the different classifications are summarized in Table 1. Figures 1 to 3 show the trend in
the blood profile based on the identified variables according to the established classification of
dengue fever.

          Table 1. Clinical characteristics of dengue fever in patients based on the severity.
                       DF without         DF with warning      Severe dengue      Severe dengue
                       warning signs      signs (n = 44)       (recover) (n = 11) (death) (n = 2)
                       (n = 6)
Sex
  Male                          5                  28                    3                    1
  Female                        1                  16                    8                    1
Race
  Malay                         3                  29                    6                    1
  Chinese                       2                  15                    3                    1
  Indian                        1                   0                    2                    0
  Others                        0                   0                    0                    0
Serology
  NS1(+)                        0                  13                    5                    0
  IgM(+)                        4                  11                    2                    1
  IgM(+) + IgG(+)               2                  17                    4                    0
  NS1(+) + IgG(+)               0                   3                    0                    1

Note: n: number of sample; DF: dengue fever.

AIMS Medical Science                                                              Volume 8, Issue 1, 56–69.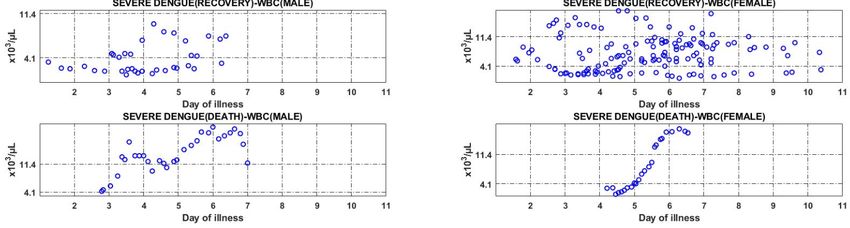
60
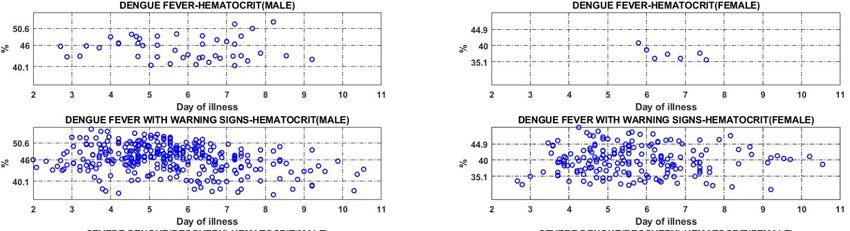
Figure 1. Trend in the level of haematocrit in dengue patients of all categories.
There are 6 patients who were classified as those with dengue fever without warning signs, of
which five are males and the remaining one is female. There is no specific trend observed in the HCT
graph of male patients—while some of the patients had high level of HCT (>46%), others’ were below
the baseline; decrease in the level of HCT below the baseline (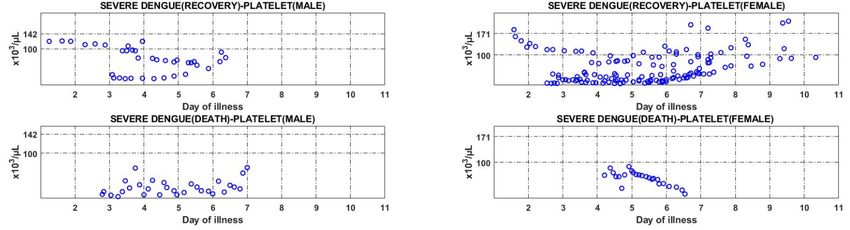
61

                 Figure 2. Trend in platelet count in dengue patients of all categories.

      The graph of platelet count in both males and females dengue patients in DF category shows a
trend that signifies a count below the minimum level (100 × 103/µL) during the infection. In patients
belong to dengue fever with warning signs category, a distinctive U-shaped trend can be observed in
the PLT count of female patients throughout the period of illness. Based on the graph, decrement in
the PLT count in most of the male patients is observed from day 2 to 6 of illness, followed by increment
from day 7 to 11; as for female patients, decreasing trend is observed on day 3 of illness, followed by
increasing trend from day 7 onwards. The graph shows that there is a decreasing trend in PLT count to
a value below 100 × 103/µL in male patients in the group with severe dengue (recovery) on day 3 of
illness, followed by increasing trend on day 5; drop in PLT count in female patients started earlier than
the male patients, followed by increment from day 6 of illness onwards. In the case of severe dengue
(death), patients of both sexes had low PLT count below the minimum value of 100 × 103/µL.

AIMS Medical Science                                                              Volume 8, Issue 1, 56–69.
62

                       Figure 3. Trend in WBC in dengue patients of all categories.

      Figure 3 shows that there is small improvement in WBC count of male patients classified as
having dengue fever without warning signs, starting on day 4 of illness; WBC count for the only female
patient in the group was below the minimum level throughout the admission. Patients of both sexes
classified as having dengue fever with warning signs displayed an improvement in WBC count, with
the value approaching the minimum reference value of 4.1 × 10³/µL, beginning from the day 3 of
illness. The WBC count in male patients with severe dengue (recovery) was lower than the minimum
reference value during admission, but increased to normal level from day 3 onwards; as for females,
there is no specific trend observed in WBC count. WBC graphs of both male and female patient with
severe dengue (death) demonstrate an increasing trend in the count to a value higher than the maximum
level, starting on day 3 and day 5 of illness for male and female patient, respectively.

3.1. Statistical analysis

      To determine the significant difference (p < 0.05) in the vital signs and blood profile of the patients
in the four categories of dengue, a Kruskal-Wallis analysis was carried out from day 3 to day 8 of
illness, considering that the critical phase often begins after 72 hours of fever, or when defervescence
occurs [17,21]. Tables 2 to 4 show the median value of the blood profile and vital signs according to
the day of illness. In general, differences in all variables associated with vital signs are statistically
significant except for pulse pressure (PP).

AIMS Medical Science                                                                 Volume 8, Issue 1, 56–69.
63
Table 2. Change in blood profile of male dengue patients based on the day of illness.
Day of illness DF DFWS SD(R) SD(D) p-value
Day 3 (n = 8)
Haematocrit (%) 44.3 45.2 40.7 48.5 0.247
Platelet (×103 µL) 24 38 112 12 0.325
WBC (×103 µL) 2.7 3.0 2.0 4.5 0.675
Day 4 (n = 22)
Haematocrit (%) 45.3 47.4 46.0 45.7 0.688
Platelet (×103 µL) 16 43 95 23 0.484
WBC (×103 µL) 3.0 3.0 2.1 13.3 0.343
Day 5 (n = 31)
Haematocrit (%) 46.5 48.0 45.2 36.9 0.139
Platelet (×103 µL) 36 50 67 19 0.796
WBC (×103 µL) 2.4 3.9 2.3 12.1 0.259
Day 6 (n = 32)
Haematocrit (%) 45.3 47.9 46.6 44.1 0.438
Platelet (×103 µL) 41 45 59 17 0.715
WBC (×103 µL) 3.0 4.1 4.5 17.5 0.235
Day 7 (n = 33)
Haematocrit (%) 46.3 46.8 47.0 38.7 0.387
Platelet (×103 µL) 39 50 76 25 0.412
WBC (×103 µL) 4.4 5.2 7.2 19.4 0.152
Day 8 (n = 21)
Haematocrit (%) 44.7 44.3 - 36.2 0.253
Platelet (×103 µL) 38 66 - 68 0.600
WBC (×103 µL) 4.9 5.4 - 11.7 0.184
Note: DF: Dengue fever; DFWS: Dengue fever with warning signs; SD(R): Severe dengue (recover);
SD(D): Severe dengue(death); WBC: White blood cells.
Table 3. Change in blood profile of female dengue patients based on the day of illness.
Day of illness DF DFWS SD(R) SD(D) p-value
Day 3 (n = 4)
Haematocrit (%) - 33.2 38.5 - 0.655
Platelet (×103 µL) - 85 31 - 0.655
WBC (×103 µL) - 2.1 4.9 - 0.180
Continued on next page
AIMS Medical Science Volume 8, Issue 1, 56–69.64
Day of illness DF DFWS SD(R) SD(D) p-value
Day 4 (n = 13)
Haematocrit (%) - 39.3 39.3 - 0.714
Platelet (×103 µL) - 90 19 - 0.028*
WBC (×103 µL) - 1.8 2.9 - 0.019*
Day 5 (n = 21)
Haematocrit (%) - 40.8 39.6 35.6 0.341
Platelet (×103 µL) - 51 28 65 0.498
WBC (×103 µL) - 2.1 4.9 2.8 0.120
Day 6 (n = 24)
Haematocrit (%) 40.8 39.9 37.9 31.2 0.365
Platelet (×103 µL) 21 29 25 59 0.888
WBC (×103 µL) 1.9 3.3 5.9 8.9 0.120
Day 7 (n = 24)
Haematocrit (%) 36.8 39.4 36.5 27.9 0.211
Platelet (×103 µL) 22 45 42 27 0.451
WBC (×103 µL) 3.0 4.1 7.7 17.1 0.100
Day 8 (n = 19)
Haematocrit (%) 36.7 39.2 32.4 - 0.023*
Platelet (×103 µL) 36 61 85 - 0.139
WBC (×103 µL) 3.2 4.9 9.3 - 0.196
Note: DF: Dengue fever; DFWS: Dengue fever with warning signs; SD(R): Severe dengue (recover);
SD(D): Severe dengue (death); WBC: White blood cells; *: significant value p < 0.05.
Table 4. Change in vital signs of dengue patients based on the day of illness.
Variable DF DFWS SD(R) SD(D) p-value
Day 3 (n = 12)
Systolic (mmHg) 117 128 115 156 0.244
Diastolic (mmHg) 62 72 64 89 0.375
Pulse pressure (mmHg) 55 54 48 79 0.255
Heart rate (bpm) 64 89 109 115 0.030*
Body temperature (℃) 37.7 38.4 37.3 37.0 0.199
Day 4 (n = 35)
Systolic (mmHg) 112 124 107 119 0.159
Diastolic (mmHg) 60 71 64 60 0.075
Pulse pressure (mmHg) 52 52 45 48 0.194
Heart rate (bpm) 55 84 92 113 0.105
Body temperature (℃) 37.3 37.9 36.9 36.5 0.116
Continued on next page
AIMS Medical Science Volume 8, Issue 1, 56–69.65
Variable DF DFWS SD(R) SD(D) p-value
Day 5 (n = 52)
Systolic (mmHg) 108 116 107 116 0.154
Diastolic (mmHg) 56 70 71 52 0.016*
Pulse pressure (mmHg) 51 49 42 63 0.071
Heart rate (bpm) 71 82 93 107 0.011*
Body temperature (℃) 37.2 38.1 37.0 35.3 0.019*
Day 6 (n = 57)
Systolic (mmHg) 109 117 103 94 0.006*
Diastolic (mmHg) 60 66 64 46 0.027*
Pulse pressure (mmHg) 51 49 43 49 0.057
Heart rate (bpm) 74 79 89 120 0.015*
Body temperature (℃) 37.5 37.1 37.2 36.1 0.084
Day 7 (n = 60)
Systolic (mmHg) 109 114 107 90 0.081
Diastolic (mmHg) 60 64 61 39 0.067
Pulse pressure (mmHg) 49 50 40 51 0.229
Heart rate (bpm) 73 76 81 118 0.011*
Body temperature (℃) 37.1 37.0 37.0 36.3 0.073
Day 8 (n = 42)
Systolic (mmHg) 112 110 111 53 0.407
Diastolic (mmHg) 62 64 63 34 0.317
Pulse pressure (mmHg) 49 50 49 19 0.404
Heart rate (bpm) 71 71 76 108 0.194
Body temperature (℃) 37.2 37.0 37.0 - 0.624
Note: DF: Dengue fever; DFWS: Dengue fever with warning signs; SD(R): Severe dengue (recover);
SD(D): Severe dengue (death); *: significant value p < 0.05.
There is a statistically significant difference in the heart rate (HR) of dengue patients of different
categories on day 3 of illness, with p-value of 0.030 and median of 64 for DF, 89 for DFWS, 109 for
SD(R) and 115 for SD (D) category. On day 4 of illness, the significant difference in PLT and WBC
counts can be observed in female patients of DFWS and SD(R) category: PLT count with p-value of
0.028 and median of 90 for DFWS and 19 for SD(R) category; and WBC count with p-value of 0.019
and median of 1.8 for DFWS and 2.9 for SD (R) category.
On day 5 of illness, there is a statistically significant difference in the HR, body temperature (BT)
and diastolic blood pressure (DBP) of dengue patients of different categories. A p-value of 0.011 was
recorded in the HR, with medians 71 (DF), 82 (DFWS), 93 (SD(R)) and 107(SD(D)). As for BT, a p-
value of 0.019 was recorded with a median of 37.2 for DF, 38.1 for DFWS, 37 for SD(R) and 35.3 for
SD (D) category. A p-value of 0.016 in DBP was generated from a median of 56 for DF, 70 for DFWS,
71 for SD(R) and 52 for SD (D) category.
AIMS Medical Science Volume 8, Issue 1, 56–69.66
There is a significant difference in the HR, systolic blood pressure (SBP) and DBP of dengue
patients of all categories on day 6 of illness. A p-value of 0.015 was recorded for HR, with a median
of 74 for DF, 79 for DFWS, 89 for SD(R) and 120 for SD(D) category. As for SBP, the p-value was
recorded as 0.006, with medians 109 (DF),117 (DFWS), 103 (SD(R)) and 94 (SD(D)). A p-value of
0.027 was recorded in DBP with medians 60 (DF), 66 (DFWS), 64 (SD(R)) and 46 (SD(D)).
On day 7 of illness, there is a significant difference in HR, with a p-value of 0.011 and median of
73 for DF, 76 for DFWS, 81 for SD(R) and 118 for SD (D) category.
Lastly, on day 8 of illness, there is a statistically significant difference in the HCT level of female
patients of DF, DFWS and SD(R) category; the p-value was recorded as 0.023 with a median of 36.7
for DF, 39.2 for DFWS and 32.4 for SD(R) category.
4. Discussion
Most dengue research on hemodynamic variable patterns have focused on age, with some
research restricted to the contrasts between severe and non-severe cases [22,23]. Analysis presented in
this paper relates the trends in vital signs and blood profile of patients with different categories of
dengue fever to the day of illness [7]. The variable, BT is used as an indicator that signifies the beginning
of critical phase, which is characterized by a sudden drop in body temperature or occurrence of
defervescence [7]. Previous research in Singapore reported a statistically significant difference in BT
of patients with DF and dengue haemorrhagic fever [23]. In this study, a significant difference in BT
(p = 0.019) has been observed on day 5 of illness in dengue patients of all categories. Female patients
selected in this study have been found to be associated with more severe dengue cases compared to
male patients, as supported by previous study [21,24,25].
Based on the analysis, there is a significant difference in SBP (p = 0.006) of patients with different
categories of dengue on day 6 of illness, which is the critical phase of the disease. Similarly, a previous
study reported a p-value of 0.001 in SBP of patients with different categories of dengue; however, the
study was conducted based on the 1997 dengue fever classification (DF, DHF and DSS) [26]. Platelet
activation can be one of the mechanisms that lead to platelet dysfunction and increased capillary
permeability in dengue patients during the critical phase [27]. As for the blood profile, plasma leakage
can be caused by haemoconcentration or increment in the level of haematocrit. Increase in the level of
HCT is in parallel with the decrease in the PLT count of patients with SD(R) and SD(D), as shown in
Figures 1 and 2 [28]. The trend observed in this study is in accordance with the WHO guidelines,
which state that increase in HCT occurs simultaneously with decrease in platelet count [29].
Hypovolemic shock can result in organ impairment and severe haemorrhage.
A shock occurs when significant volume of plasma is lost through leakage, causing HCT to
decrease, the WBC count to increase, and the BT to become subnormal [7], as observed in patients
with SD(D). Tachycardia is also a sign of compensated shock in severe dengue [5]. Results from
analysis on the vital signs and blood profile of patients classified as SD(D) demonstrate that the HCT
level in the patients of this category is lower than the minimum value, while the WBC count is high
(>11.4 × 10³ µL) with subnormal BT recorded (i.e., the lowest BT recorded for male patient is 35.2 ℃,
and for female patient, 36.2 ℃). According to statistical analysis, a clear trend can be observed in the
HR of patients with all categories of dengue, as observed during the critical phase of the disease on
day 3, 5, 6 and 7 [17,21]. This discussion focuses on clearly visible trends and compare the results to
the previously published findings. The fact that the patients could be at any stage of their illnesses, and
AIMS Medical Science Volume 8, Issue 1, 56–69.67
the possibility of untimely admission or release of patients present a challenge in determining the trend
in the variables investigated in this study. During the course of the disease progression, the illness may
develop differently in individual patient depending on their immune response toward the virus and
treatment procedures.
5. Conclusion
This study has found that HR is an essential indicator that varies in patients with different
categories of dengue in most of the days throughout the disease progression. It has also been found
that the daily trend of HCT is similar in dengue patients of all categories. In addition, a clear trend in
PLT and WBC count can be observed in patients with DF, DFWS and SD(R), whereby the WBC count
increases prior to the increase in PLT count. Finally, a significant difference in HCT, PLT, and WBC
has been observed only in female dengue patients.
Acknowledgements
This work was supported by the Fundamental Research Grant Scheme
[FRGS/1/2016/TK04/UKM/02/01].
Conflict of interest
All authors declare no conflicts of interest in this paper.
Reference
1. Wang WH, Urbina AN, Chang MR, et al. (2020) Dengue hemorrhagic fever—a systemic literature
review of current perspectives on pathogenesis, prevention and control. J Microbiol Immunol
Infect 53: 963–978.
2. Halstead S (2019) Recent advances in understanding dengue. F1000Research 8: 1–12.
3. Liew SM, Khoo EM, Ho BK, et al. (2016) Dengue in Malaysia : factors associated with dengue
mortality from a national registry. PLoS One 11: e0157631.
4. Kementerian Kesihatan Malaysia (KKM), Agensi Remote Sensing Malaysia (ARSM),
Kementerian Sains Teknologi dan Inovasi (MOSTI) (2021) iDengue untuk Komuniti. Available
from: https://idengue.mysa.gov.my/
5. Clinical Practice Guidelines Management, Dengue Infection Adults (2015) CPG Management of
Dengue Infection In Adults (Third Edition) 2015. Available from:
http://www.acadmed.org.my/view_file.cfm?fileid=756
6. Nascimento EJM, Huleatt JW, Cordeiro MT, et al. (2018) Development of antibody biomarkers
of long term and recent dengue virus infections. J Virol Methods 257: 62–68.
7. World Health Organization (2009) Dengue: guidelines for diagnosis, treatment, prevention, and
control.
8. Guzman MG, Harris E (2015) Dengue. Lancet 385: 453–465.
AIMS Medical Science Volume 8, Issue 1, 56–69.68
9. Choudhury J, Shastri DD (2014) Diagnosis and management of dengue in children:
recommendations and IAP ID chapter plan of action. Pediatr Infect Dis 6: 54–62.
10. World Health Organization (2012) Handbook for clinical management of dengue.
11. Kuo HJ, Lee IK, Liu JW (2018) Analyses of clinical and laboratory characteristics of dengue
adults at their hospital presentations based on the World Health Organization clinical-phase
framework: emphasizing risk of severe dengue in the elderly. J Microbiol Immunol Infect 51: 740–
748.
12. Thomas L, Moravie V, Besnier F, et al. (2012) Clinical presentation of dengue among patients
admitted to the adult emergency department of a tertiary care hospital in Martinique: implications
for triage, management, and reporting. Ann Emerg Med 59: 42–50.
13. Suwarto S, Nainggolan L, Sinto R, et al. (2016) Dengue score: a proposed diagnostic predictor
for pleural effusion and/or ascites in adults with dengue infection. BMC Infect Dis 16: 1–7.
14. Mansour AI, Abu-naser SS (2019) Knowledge based system for the diagnosis of dengue disease.
Int J Acad Heal Med Res 3: 12–19.
15. Jayathilaka D, Gomes L, Jeewandara C, et al. (2018) Role of NS1 antibodies in the pathogenesis
of acute secondary dengue infection. Nat Commun 9: 1–15.
16. Cui L, Pang J, Lee YH, et al. (2018) Serum metabolome changes in adult patients with severe
dengue in the critical and recovery phases of dengue infection. PLoS Negl Trop Dis 12: e0006217.
17. Lum LCS, Ng CJ, Khoo EM (2014) Managing dengue fever in primary care: a practical approach.
Malaysian Fam Physician 9: 2–10.
18. Yacoub S, Wills B (2015) Dengue: an update for clinicians working in non-endemic areas. Clin
Med J R Coll Physicians London 15: 82–85.
19. Muller DA, Depelsenaire ACI, Young PR (2017) Clinical and laboratory diagnosis of dengue virus
infection. J Infect Dis 215: S89–S95.
20. WHO (2013) Dengue clinical management: facilitator’s training manual. Available from:
https://iris.wpro.who.int/handle/10665.1/7841
21. Yacoub S, Wills B (2014) Predicting outcome from dengue. BMC Med 12: 147.
22. Alfie J, Waisman GD, Galarza CR, et al. (1999) Contribution of stroke volume to the change in
pulse pressure pattern with age. Hypertension 34: 808–812.
23. Lee VJ, Lye DC, Sun Y, et al. (2009) Decision tree algorithm in deciding hospitalization for adult
patients with dengue haemorrhagic fever in Singapore. Trop Med Int Heal 14: 1154–1159.
24. Huy NT, Van Giang T, Thuy DHD, et al. (2013) Factors associated with dengue shock syndrome:
a systematic review and meta-analysis. PLoS Negl Trop Dis 7: e2412.
25. Anders KL, Nguyet NM, Chau NVV, et al. (2011) Epidemiological factors associated with dengue
shock syndrome and mortality in hospitalized dengue patients in Ho Chi Minh City, Vietnam. Am
J Trop Med Hyg 84: 127–134.
26. Pongpan S, Wisitwong A, Tawichasri C, et al. (2013) Development of dengue infection severity
score. ISRN Pediatr 2013: 845876.
27. Hottz ED, Lopes JF, Freitas C, et al. (2013) Platelets mediate increased endothelium permeability
in dengue through NLRP3-inflammasome activation. Blood 122: 3405–3414.
AIMS Medical Science Volume 8, Issue 1, 56–69.69
28. Srikiatkhachorn A (2017) HHS Public Access. Thromb Haemost 102: 1042–1049.
29. World Health Organization (2015) Dengue situation update 482 update on the dengue situation in
the western pacific region. 2014: 5.
© 2021 the Author(s), licensee AIMS Press. This is an open access
article distributed under the terms of the Creative Commons
Attribution License (http://creativecommons.org/licenses/by/4.0)
AIMS Medical Science Volume 8, Issue 1, 56–69.You can also read