THE WORLD UNCERTAINTY INDEX - ASSA San Diego-January 2020 Hites Ahir (IMF), Nick Bloom (Stanford University) and Davide Furceri (IMF)
←
→
Page content transcription
If your browser does not render page correctly, please read the page content below
THE WORLD UNCERTAINTY INDEX
Hites Ahir (IMF), Nick Bloom (Stanford University) and Davide Furceri (IMF)
 ASSA San Diego—January 2020
Outline Motivation and contribution Construction of the WUI Reliability checks Stylized facts New evidence on the effect of uncertainty Next steps 2
Motivation and contribution Why an other measure? Existing measures available mostly for advanced economies… ...and often not comparable across countries. What we do? We construct a new index of uncertainty—the World Uncertainty Index (WUI)—for 143 individual countries on a quarterly basis from 1952 onwards using standardized and cross- country consistent sources: the Economist Intelligence Unit (EIU) country reports. 3
Construction of the WUI-The EIU Reports

 4
Construction of the WUI-The EIU Reports Focus The country report typically covers politics, economic policy, the domestic economy, foreign and trade payments events, and on their overall impact on the country risk. In short, these reports examine and discuss the main economic, financial, and political trends in a country. Process In the writing the report step, field experts prepare a draft and send it to country experts based at headquarters. In the editing step, country experts at headquarters integrate the draft with their own inputs, and make sure the structure of the report is consistent and standardized. They also check that the report is consistent with the EIU’s global and regional views. In the second check step, a senior staff at headquarters does a thorough check of the draft. In the sub-editing step, sub-editors do a check to make sure that the report is well drafted, consistent, accurate, and do fact checking. In the production step, the report is checked to make sure that the report is properly coded 5 and styled adequately.
Construction of the WUI We count the number of times uncertainty is mentioned in the EIU country reports. Specifically, for each country and quarter, we search through the EIU country reports for the words “uncertain”, “uncertainty”, and “uncertainties”. To make the WUI comparable across countries, we scale the raw counts by the total number of words in each report. (note: no systematic difference in the number of words across countries and over time). 6
Construction of the WUI Pros Comparability of the WUI across countries: The index is based on a single source that has specific topic coverage—economic and political developments. The reports follow a standardized process and structure which helps to mitigate concerns about the accuracy, ideological bias and consistency of the WUI. Cons We only have one EIU report per country per quarter, so a far smaller body of text than the EPU index, so the sampling noise is likely to be substantial higher. We are reliant on the accuracy of the EIU reports, which to our knowledge are extremely high quality, but it still raises potential concerns over reliance on one underlying source. 7
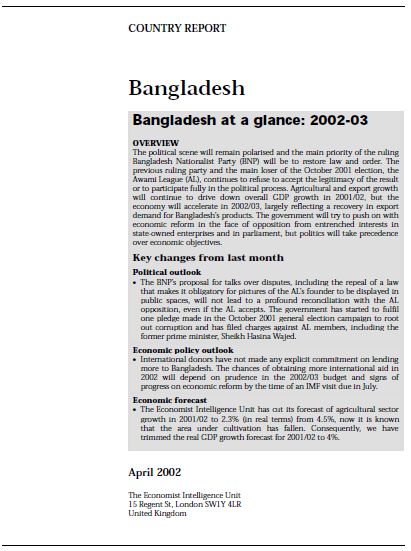
Reliable? WUI vs EPU

 300 WUI (EPU countries only) 300 United Kingdom United States
 EPU Index (right axis) 1200 WUI 700 600 WUI 250
 250 correlation: 0.705 250 EPU (right axis) EPU (right axis)
 1000 600 500
 correlation: 0.719 correlation: 0.533 200
 200 200 500
 800 400
 400 150
 150 150
 600 300
 300 100
 100 100 400 200
 200
 50 50 50
 200 100 100

 0 0 0 0 0 0
 1996q1 2003q2 2010q3 2017q4 1996q1 2003q2 2010q3 2017q4 1996q1 2003q2 2010q3 2017q4

Note: The World Uncertainty Index (WUI) is computed by counting the frequency of uncertain (or the variant) in EIU country reports. The WUI is then normalized by total number of words,
 rescaled by multiplying by 1,000. Here is also rescaled by the global average of 1996Q1 to 2010Q4 such that 1996Q1-2010Q4=100. A higher number means higher uncertainty and vice versa.
For the other countries covered by the EPU the median correlation is about 0.4.
EPU more global in nature, WUI more country-specific (Chile a remarkable example).
 8
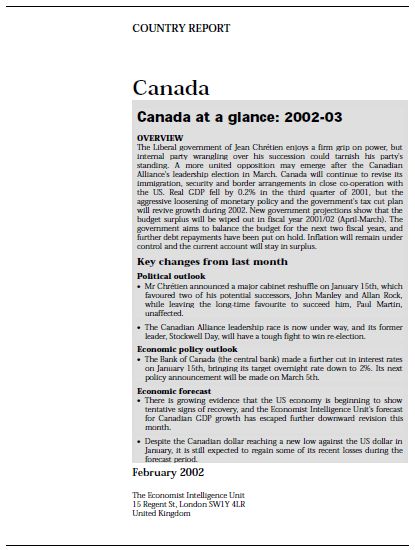
Reliable? Level of WUI vs. Level of volatility

 -3.0 -2.5
 Stock market return volatility correlation: 0.430 correlation: 0.531
 -3.5 -3.0 RUS

 Bond yield volatility
 TUR
 PHL
 RUS UKR
 BRA
 -4.0 CHN ROUPOL
 HUN -3.5
 FININDPAK KOR ARG KOR
 GRC THAVEN
 VNM JPN MEX
 PHL MY S
 EGY DEU
 NLDSWE ISR PER
 CZE COLECU
 SGPNOR ESP
 FRA
 -4.5 MY
 IRLITA
 S ZAF -4.0 JPN
 USA
 PRT THA MEX
 CHE
 SAU
 AUT CAN
 NER
 BEL DNKGBR
 AUS SGP HUN
 KWT KEN ISR COL
 NZL USA
 CHE ZAF
 -5.0 CHLIRN
 MAR -4.5 AUS
 PAK POL
 DEU
 CAN GBR
 SWE
 FIN NLDIRL FRA
 ESP CZE
 EGY
 BEL NZL
 AUT NOR DNK
 ITA
 TUN
 -5.5 -5.0
 0.0 0.1 0.2 0.3 0.4 0.0 0.1 0.2 0.3 0.4

 WUI WUI

Note: The World Uncertainty Index (WUI) is computed by counting the frequency of uncertain (or the variant) in EIU country reports.
The WUI is then normalized by total number of words and rescaled by multiplying by 1,000. The WUI is then normalized by total number of words, rescaled by multiplying by 1,000.
A higher number means higher uncertainty and vice versa.

 9
Reliable? Level of WUI vs. Level of risk

 250 90
 correlation: 0.325 correlation: 0.314
 ECU 80 ECU
 200 NGA NGA

 Political Risk (EIU)
 VNM
 PAK
 AZE VEN UKR 70 PAK
 KAZ
 LKA IDN AZE IDN
 IRN RUS IRN VEN UKR
 ARG
 All Risk (EIU)

 VNM RUS
 PHL LKA
 DZA
 TUR COL
 60 DZA KAZ
 EGY
 ROU PER PHL
 ARG
 PER
 150 CHN BGR THA CHN SAU
 EGY THA
 SAU BRA 50 TUR COL
 IND SVKHUN
 MY SPOLMEX ROU BRA
 MEX
 ISR
 ZAF
 CZE BGR
 IND MY S
 KOR 40 POLISR KOR
 100 GRC SVK
 HKG HKG ZAFHUN
 CZE
 CHL NZL
 TWN
 AUS PRT ITA
 ESP
 30 TWN
 JPN GRC ITA
 SGP
 BEL CHL
 IRL 20 AUS PRT
 BEL JPN
 ESP
 50 NLD
 AUT DEU USA SGP
 CAN FRA GBR NZL
 FIN NOR
 CHEDNKSWE AUTNLD
 IRL
 DEUFRAUSA
 10 FIN
 CHE
 CAN
 NOR SWE
 DNK
 GBR

 0 0
 0.0 0.1 0.2 0.3 0.4 0.0 0.1 0.2 0.3 0.4
 WUI WUI

Note: The World Uncertainty Index (WUI) is computed by counting the frequency of uncertain (or the variant) in EIU country reports.
The WUI is then normalized by total number of words and rescaled by multiplying by 1,000. The WUI is then normalized by total number of words, rescaled by multiplying by 1,000.
A higher number means higher uncertainty and vice versa.

 10
Reliable? WUI vs. EPU & Volatility—panel framework

Dependent Variable WUI
 (I) (II) (III) (IV) (V) (VI) (VII) (VIII) (IX)
EPU 123.843*** 129.064*** 59.941***
 (2.96) (4.60) (3.52)
Stock Vol 0.353*** 0.131** 0.128**
 (3.30) (2.08) (2.19)
Growth -0.025*** -0.017*** -0.007*
 (-4.41) (-3.58) (-1.90)

Country FE No Yes Yes No Yes Yes No Yes Yes
Year FE No No Yes No No Yes No No Yes
N 1558 1558 1558 3766 3766 3766 4768 4768 4768
R2 (within R2) 0.10 0.10 0.42 0.02 0.00 0.38 0.01 0.01 0.29
Note: The World Uncertainty Index (WUI) is computed by counting the frequency of uncertain (or the variant) in EIU country reports.
The WUI is then normalized by total number of words and rescaled by multiplying by 1,000. The WUI is then normalized by total number of words, rescaled by multiplying by 1,000.
A higher number means higher uncertainty and vice versa.
*,**,*** denote statically significance at 10, 5, and 1 percent respectively. T-statics in columns (I), (IV) and (VII) based on clustered standard errors.
T-statics in the remaining columns based on Driscoll-Kraay standard errors. R2 reported for columns (I), (IV) and (VII); otherwise within R2 reported.
 11
Reliable? WUI & Elections

 t-2 t-1 t t+1 t+2
 All elections -0.002 0.022*** 0.044*** 0.047*** 0.023**
 (-0.29) (2.63) (4.64) (4.78) (2.90)

 Exogenous -0.003 0.036** 0.074*** 0.053*** 0.015
 (-0.19) (2.44) (4.21) (3.54) (1.17)

Note: The World Uncertainty Index (WUI) is computed by counting the frequency of uncertain (or the variant) in EIU country reports.
The WUI is then normalized by total number of words and rescaled by multiplying by 1,000. The WUI is then normalized by total number of words, rescaled by multiplying by 1,000.
A higher number means higher uncertainty and vice versa.
t denotes time (quarter) of election. Dates for elections from Alesina et al. (2019). Sample: 377 election in 72 “democratic” countries, among which 166 are exogenous.
 *,**,*** denote statically significance at 10, 5, and 1 percent respectively. T-statics in columns (I), (IV) and (VII) based on clustered standard errors.
T-statics in the remaining columns based on Driscoll-Kraay standard errors.
 12
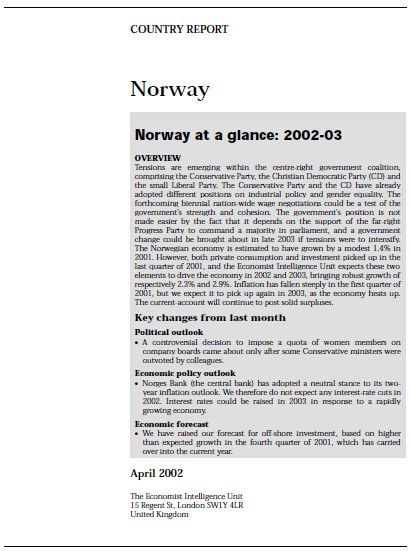
Stylized fact 1-Global uncertainty at historical high
 Global WUI-GDP weighted average
 US fis cal cliff and s overeign uncertainty
 300
 debt cris is in Europe concerning Brexit
 Iraq war
 Pos s ible and and U.S. trade
 US outbreak policy
 m ilitary of SARS s overeign
 250 action in debt crisis
 US Iraq in Europe Brexit
 reces s ion ongoing
 and 9/11 turm oil in
 global
 financial s overeign
 200 m arkets credit ris k
 global in Europe
 econom ic
 s lowdown financial
 credit
 150 crunch

 100

 US political uncertainty
 50 FED
 pres idential in Europe related to
 tightening
 elections , and the threat of Catalan
 World Uncertainty Index and political
 afterm ath of s eces sion from
 ris k in Greece
 Brexit Spain
 1996Q1-2010Q4 average and Ukraine
 0
 1996q1 2001q4 2007q3 2013q2 2019q1

Note: The World Uncertainty Index (WUI) is computed by counting the frequency of uncertain (or the variant) in EIU country reports.
The WUI is then normalized by total number of words and multiplying by 1,000. The WUI is then normalized by rescaling it using the average of 1996Q1 to 2010Q4 such that 1996Q1-2010Q4=100.
A higher number means higher uncertainty and vice versa.
 13
Stylized fact 2-Uncertainty higher in developing economies
 WUI by income groups
 0.18

 Third
 0.16 quartile

 Interquartile range
 0.14

 0.12 Mean

 0.10

 0.08
 First
 quartile
 0.06

 0.04
 Low-income economies Emerging economies Advanced economies

 Note: The World Uncertainty Index (WUI) is computed by counting the frequency of uncertain (or the variant) in EIU country reports.
 The WUI is then normalized by total number of words and rescaled by multiplying by 1,000.
 A higher number means higher uncertainty and vice versa.
 14
Stylized fact 3- inverted U-shape between uncertainty and democracy
 WUI and democracy
 0.35 0.40

 0.30 ZMB 0.35
 NGA ZAF
 LBN ARG
 KEN ECUTUR COL
 0.30 GBR
 0.25 GNB NIC
 WUI

 WUI
 HTI VEN KOR
 GIN IDN LSO BRA
 NPLRUS
 MWI PER
 CIV
 0.25 UKR BOL
 0.20 UZB THA
 ZWE CAFCOD CZE HUN
 ETH
 TUN MDG FRA POL
 KHM
 BFA KGZ 0.20
 GHA MEX GTM BGR ITA
 LBY TGO ISR PRY MDA DNK
 ESP
 NOR
 SWE
 CHE
 0.15 OMN TCD
 SDN UGATZA BDI BEN
 SLV
 USA
 IRL
 PRT
 URY
 TKM EGY SLE PHL BWA PAN JPN
 DEU
 ARE MYSSEN 0.15 NAM SVN
 MNG
 KWT
 KAZ
 MMR
 CMR NER
 BGDLKA ROU TWN CAN
 NLD
 GRC
 NZL
 AUT
 CRI
 RWA PAK LBR HRV HND LVA JAM AUS
 0.10 SAU VNM JOR
 IRN DZA MOZ ALB SVK
 AZE AGO
 SGP 0.10 MLI IND LTU
 COG TJK YEM
 CHNMAR GAB DOM
 BLR
 ERI
 PNG BEL CHL FIN
 0.05 QAT
 MRT ARM 0.05
 LAO
 GMB

 0.00 0.00
 -10.0 -5.0 0.0 5.0 6.0 7.0 8.0 9.0 10.0

 Democracy Index Democracy Index

 Note: The World Uncertainty Index (WUI) is computed by counting the frequency of uncertain (or the variant) in EIU country reports.
 The WUI is then normalized by total number of words and rescaled by multiplying by 1,000.
 A higher number means higher uncertainty and vice versa.

 15
Stylized fact 4-Uncertainty spikes more synchronized in advanced
 economies
 Synchronization Correlation Variance Explained
 by 1st Factor—PCA

 All countries -0.167 0.071 0.150

 Advanced economies -0.146 0.121 0.221

 Emerging and low-income -0.185 0.011 0.144
 economies

 European -0.134 0.224 0.283

 Note: synchronization between country i and j at time t defined as: , , = − , − , , where U denotes the WUI.

 16
Stylized fact 4-with higher trade and financial linkages
 (I)a (II)a (III) (IV) (V) (IV)
 Trade linkages 0.113** 0.741** 0.738** 0.746**
 (2.37) (2.47) (2.49) (2.52)

 Financial linkages 0.131** 0.314** 0.313** 0.317**
 (2.32) (1.95) (2.01) (2.06)

 Output synchronization 0.011***
 (3.10)

 Country-pair FE No No Yes Yes Yes Yes
 Time FE Yes Yes Yes Yes Yes Yes

 N 15,393 15,393 15,393 15,393 15,393 15,393

Note: synchronization between country i and j at time t defined as: , , = − , − , , where U denotes the WUI.
Estimates are based on the following equation: , , = , + + 1 , , + 1 , , + , , + , , where , denotes trade linkages—defined as bilateral trade between country i and j,
normalized by the sum of total trade of country i and j; , denotes financial linkages—defined as bilateral assets and liabilities between country i and j, normalized by the sum of total assets and
 liabilities of country i and j. , denotes output synchronization—defined as minus the absolute value GDP growth difference between country i and j, normalized by the sum of GDP growth of
country i and j. **,*** denote significance at 5 and 1 percent, respectively. Country-pair and time fixed effects included but not reported.
 a dummy for common language and past or present colonial relationship included. 17
Approaches Effect of uncertainty shocks on output quarterly data (smaller sample) VAR approach IV-SVAR using exogenous elections as instruments Heterogeneity across countries larger effects in countries with weaker institutions annual data (entire sample) looking both at output and investment local projection role of institutions Heterogeneity across sectorslarger effects in sectors that are more financially constrained annual data for 22 industries looking both at output and investment 18 role of financial constraints
Ongoing work and next steps Extend time coverage back to 1952 Trade uncertainty (new measure and analysis) Other categories (monetary, fiscal, political, external vs. domestic..) 19
Additional Slides

 20
Effect of uncertainty on economic activity-quarterly
 GDP response to WUI innovations

 0

 -.005

 -.01

 -.015

 -.02

 0 5 10 15
 quarters
 90% CI Cumulative Orthogonalized IRF

Note: VAR fit to quarterly data for a panel of 46 countries from 1996q1 to 2018q2. Impulse responses of GDP to a one-standard deviation increase in the WUI—equal to the change in average value
in the index from 2014 to 2016—based on a Cholesky decomposition with the following order: the log of average stock return, the WUI and GDP growth.
The specification includes four lags of all variables. Country and time fixed effects are included.

 21
Effect of uncertainty on economic activity-quarterly
 GDP response to WUI innovations—robustness checks
 0

 -0.005

 -0.01

 -0.015

 -0.02
 0 5 10 15
 Baseline 8 lags WUI last Controlling for stock market volatility Before GFC

Note: VAR fit to quarterly data for a panel of 46 countries from 1996q1 to 2018q2. Impulse responses of GDP to a one-standard deviation increase in the WUI—equal to the change in average value
in the index from 2014 to 2016—based on a Cholesky decomposition with the following order: the log of average stock return, the WUI and GDP growth.
The specification includes four lags of all variables. Country and time fixed effects are included.

 22
Effect of uncertainty on economic activity-quarterly
 GDP response to WUI innovations—IV exogenous elections
 0.005

 0
 1 2 3 4 5 6 7 8 9 10 11 12 13 14 15 16

 -0.005

 -0.01

 -0.015

 -0.02

 -0.025

Note: VAR fit to quarterly data for a panel of 42 countries from 1996q1 to 2018q2. Impulse responses of GDP to a one-standard deviation increase in WUI—equal to the change in average value
 in the index from 2014 to 2016—using as instrument exogenous elections and based on a Cholesky decomposition with the following order: exogenous elections, the log of average stock return,
the WUI and GDP growth. The specification includes four lags of all variables. Country and time fixed effects are included. SVAR-IV approach of Plagborg-Moller and Wolf (2019).
First stage: , = 0.183 + 0.098
 (6.47)
t-statistics in parenthesis.
 23
Effect of uncertainty on economic activity-annual
 GDP response to WUI innovations Investment response to WUI innovations

 0.002 0.01

 0 0

 -0.01
 -0.002
 -0.02
 -0.004
 -0.03
 -0.006
 -0.04
 -0.008
 -0.05

 -0.01 -0.06

 -0.012 -0.07
 0 1 2 3 4 0 1 2 3 4

Note: Response estimated using the local projection method (Jorda 2005) : , + − , −1 = + + , + , + ,
where y is the log of output (investment); are country-fixed effects; are time-fixed effects; X is a set of controls including lags of the growth rate of output and of the WUI index.
Estimates based on annual data for a panel of 143 countries from 1996 to 2017. Solid line denoted the impulse responses of GDP to a one-standard deviation increase in the WUI—equal to the
change in average value in the index from 2014 to 2016. Dotted lines denote 90 percent confidence bands.

 24
Effect of uncertainty on investment-role of institutions
 Below-median rule of law Above-median rule of law

 0.02 0.02

 0 0

 -0.02 -0.02

 -0.04 -0.04

 -0.06 -0.06

 -0.08 -0.08

 -0.1 -0.1

 -0.12 -0.12
 0 1 2 3 4 0 1 2 3 4
Note: Response estimated using the local projection method (Jorda 2005) : , + − , −1 = + + , + ℎ (1 − ) , + , + ,
where y is the log of output (investment); are country-fixed effects; are time-fixed effects; X is a set of controls including lags of the growth rate of output and of the WUI index.
Estimates based on annual data for a panel of 143 countries from 1996 to 2017. Solid line denoted the impulse responses of GDP to a one-standard deviation increase in the WUI—equal to the
change in average value in the index from 2014 to 2016. Dotted lines denote 90 percent confidence bands. Rue of law based on WDI.
Results robust for different measures of institutional quality, to different thresholds, controlling for the level of development, unsegmenting rule of law with European settle mortality rates.
 25
Effect of uncertainty on investment-role of institutions
 Below-median rule of law Above-median rule of law

 0.02 0.02

 0 0

 -0.02 -0.02

 -0.04 -0.04

 -0.06 -0.06

 -0.08 -0.08

 -0.1 -0.1

 -0.12 -0.12
 0 1 2 3 4 0 1 2 3 4
Note: Response estimated using the local projection method (Jorda 2005) : , + − , −1 = + + , + ℎ (1 − ) , + , + ,
where y is the log of output (investment); are country-fixed effects; are time-fixed effects; X is a set of controls including lags of the growth rate of output and of the WUI index.
Estimates based on annual data for a panel of 143 countries from 1996 to 2017. Solid line denoted the impulse responses of GDP to a one-standard deviation increase in the WUI—equal to the
change in average value in the index from 2014 to 2016. Dotted lines denote 90 percent confidence bands. Rue of law based on WDI.
Results robust for different measures of institutional quality, to different thresholds, controlling for the level of development, unsegmenting rule of law with European settle mortality rates.
 26
Effect of uncertainty on economic activity-
 sectoral data and role of financial constraints
 Differential output response Differential productivity response

 1 1

 0.5
 0.5
 0
 -1 0 1 2 3 0
 -0.5 -1 0 1 2 3
 -1 -0.5

 -1.5 -1
 -2
 -1.5
 -2.5
 -2
 -3

 -3.5 -2.5

 -4 -3
Note: Response estimated using the following specification: ∆ = + + + ∑3 =0 , − +
where y is the log of sectoral output; are sector-country fixed effects; are country-time fixed effects; are sector-time fixed effects; EFD is the Rajan and Zingales’s (1998) measure of
the degree of dependence on external finance in each industry—measured as the median across all U.S. firms, in each industry, of the ratio of total capital expenditures minus the current cash flow
 to total capital expenditures. Estimates based on annual data for a panel of 22 industries, 56 countries from 1995 to 2017 (the size of the estimation sample is 25,618 observations).
Solid line denotes the differential output effect to a one-standard deviation increase in the WUI—equal to the change in average value in the index from 2014 to 2016—of an industry with
 high external financial dependence (at the 75th percentile distribution of the indicator) compared to an industry with low external financial dependence (at the 25th percentile distribution of
the indicator). Dotted lines denote 90 percent confidence bands.
 27
0.00
 0.02
 0.04
 0.06
 0.08
 0.10
 0.12
 0.14
 0.16
 0.18
 0.20

 Q1-1952
 Q4-1953
 Q3-1955

 of 1960
 Q2-1957

 recession
 Q1-1959
 Q4-1960
 Q3-1962
 Q2-1964
 Vietnam War

 Q1-1966
 Q4-1967
 Q3-1969
 Q2-1971
 Q1-1973
 Q4-1974
 Q3-1976
 policy

 Q2-1978
 proposal
 President

 Q1-1980
 Carter's tax

 Q4-1981
 Q3-1983
 Black

 Q2-1985
 Monday

 Q1-1987
 United States

 Q4-1988
 Q3-1990
 Q2-1992
 Q1-1994
 Time coverage

 Q4-1995
 Credit crunch

 9/11

 Q3-1997
 Gulf War II

 Q2-1999
 Q1-2001
 Q4-2002
 Q3-2004
 Q2-2006
 Q1-2008
 Fiscal clif f

 Trump
 President

 Q4-2009
 election of

 political
 gridlock

 Q3-2011
 Q2-2013
 Q1-2015
 w ar

 Q4-2016
 Trade

 Q3-2018
28
Time coverage
 Argentina Brazil
0.35 0.60
 Uncertain political environment w here political
 uncertainty related alliances are changing rapidly, and uncertainty over uncertainty
 w ho will w in the 2011 presidential election risk that related
 to mistrust policy
0.30 betw een President upcoming
 political tightening on elections
 Levingstom and uncertainty related top of drought 0.50
 his commanders uncertainty related to to the dismissal of uncertainty,
 poor economic could tip
 in chief expresident Juan economy minister-- Argentina
 Peron and military Domingo Cavallo prospects, high Deteriorating
0.25 President Lanussee unemployment, fiscal and into a deeper, uncertainty related
 and w hether longer
 and upcoming President Carlos financial financing 0.40 upcoming elections
 constraints and conditions and recession. political and uncertainty related and president, Michel
 elections Menem is still in a
 crisis in Brazil rising political economic privatisation under Temer, under
 uncertainty related to position to uncertainty
0.20 uncertainty related an uncertainty and President Itamar pressure to resign for
 political turmoil command Franco uncertainty
 heighten the Army coup by the possible bribery
 betw een the armed risk of a new return of ex- related
 forces and the uncertainty 0.30 General Lott
 sovereign President Jânio unfavorable
 Peronists related to a uncertainty related uncertainty
 default da Silva external
0.15 recession The resignation of related
 Quadros environment
 Miss Zelia upcoming
 uncertainty related to elections
 Cardoso de Mello,
 the election of 0.20 the formerly all-
0.10 President Carlos pow erful economy
 Menem
 minister and the
 the phasing dow n
 of the price freeze
0.05 0.10

0.00 0.00
 Q1-1952
 Q4-1953
 Q3-1955
 Q2-1957
 Q1-1959
 Q4-1960
 Q3-1962
 Q2-1964
 Q1-1966
 Q4-1967
 Q3-1969
 Q2-1971
 Q1-1973
 Q4-1974
 Q3-1976
 Q2-1978
 Q1-1980
 Q4-1981
 Q3-1983
 Q2-1985
 Q1-1987
 Q4-1988
 Q3-1990
 Q2-1992
 Q1-1994
 Q4-1995
 Q3-1997
 Q2-1999
 Q1-2001
 Q4-2002
 Q3-2004
 Q2-2006
 Q1-2008
 Q4-2009
 Q3-2011
 Q2-2013
 Q1-2015
 Q4-2016
 Q3-2018
 29
Time coverage

 Greece Spain
 0.25 uncertainty related to a
0.20 uncertainty related to
 uncertainty uncertainty referendum and
 uncertainty country's euro zone
 related to the related to the unilateral declaration of
 related to membership
 economy and coup by General independence in Catalonia
0.18 Phaidon Gizikis
 inconclusive
 politics elections uncertainty related to
 uncertainty related to speculation about the
0.16 the outcome of the 0.20 political future of the political
 uncertainty unceratinty
 elections--Andreas unceratinty related to prime minister, José Luis
 related to
 Papandreou economic General Francisco Rodríguez Zapatero related to the
 the recent elections
0.14 uncertainty and political unceratinty Franco's illness and
 economy
 related to uncertainty uncertainty related to the violence from
 unceratinty unceratinty
 the related to related to economy extremist groups
 related to related to
0.12 economy the sovereign- 0.15 upcoming the economy
 economy debt elections
 sustainability
0.10 and bank
 solvency and
 Grexit
0.08 0.10

0.06

0.04
 0.05

0.02

0.00
 0.00
 Q1-1952
 Q4-1953
 Q3-1955
 Q2-1957
 Q1-1959
 Q4-1960
 Q3-1962
 Q2-1964
 Q1-1966
 Q4-1967
 Q3-1969
 Q2-1971
 Q1-1973
 Q4-1974
 Q3-1976
 Q2-1978
 Q1-1980
 Q4-1981
 Q3-1983
 Q2-1985
 Q1-1987
 Q4-1988
 Q3-1990
 Q2-1992
 Q1-1994
 Q4-1995
 Q3-1997
 Q2-1999
 Q1-2001
 Q4-2002
 Q3-2004
 Q2-2006
 Q1-2008
 Q4-2009
 Q3-2011
 Q2-2013
 Q1-2015
 Q4-2016
 Q3-2018
 30
Time coverage
 China United Kingdom
 0.45
0.20
 uncertainty implications of
 Uncertainty over how 0.40 the Brexit
0.18 related to future leadership uncertainty
 the cultural forthcoming elections and referendum
 transitions w ill be handled related to the verdict.
 revolution general a potential referendum on
 economic 1964 general
0.16 0.35 sharp fall in elections the UK's membership of
 and political the EU.
 stock
 uncertainty
 uncertainty related exchange
0.14 to the transition to prices
 general 0.30
 economic a younger uncertainty about
 general generation of opposition to
0.12 uncertainty economic the outcome of
 political leaders join the EEC
 uncertainty 0.25 Brexit
 (European negotiations
 Economic
0.10 Community).
 0.20
0.08
 Great
 Recession
 0.15
0.06

0.04 0.10

0.02 0.05

0.00 0.00
 Q1-1952
 Q4-1953
 Q3-1955
 Q2-1957
 Q1-1959
 Q4-1960
 Q3-1962
 Q2-1964
 Q1-1966
 Q4-1967
 Q3-1969
 Q2-1971
 Q1-1973
 Q4-1974
 Q3-1976
 Q2-1978
 Q1-1980
 Q4-1981
 Q3-1983
 Q2-1985
 Q1-1987
 Q4-1988
 Q3-1990
 Q2-1992
 Q1-1994
 Q4-1995
 Q3-1997
 Q2-1999
 Q1-2001
 Q4-2002
 Q3-2004
 Q2-2006
 Q1-2008
 Q4-2009
 Q3-2011
 Q2-2013
 Q1-2015
 Q4-2016
 Q3-2018

 Q1-1952
 Q4-1953
 Q3-1955
 Q2-1957
 Q1-1959
 Q4-1960
 Q3-1962
 Q2-1964
 Q1-1966
 Q4-1967
 Q3-1969
 Q2-1971
 Q1-1973
 Q4-1974
 Q3-1976
 Q2-1978
 Q1-1980
 Q4-1981
 Q3-1983
 Q2-1985
 Q1-1987
 Q4-1988
 Q3-1990
 Q2-1992
 Q1-1994
 Q4-1995
 Q3-1997
 Q2-1999
 Q1-2001
 Q4-2002
 Q3-2004
 Q2-2006
 Q1-2008
 Q4-2009
 Q3-2011
 Q2-2013
 Q1-2015
 Q4-2016
 Q3-2018
 31
0.00
 0.05
 0.10
 0.15
 0.20
 0.25
 0.30
 0.35
 1952q1

 1955q4

 1959q3

 1963q2

 1967q1

 1970q4

 1974q3

 1978q2

 1982q1

 1985q4

 1989q3

 1993q2
 World Uncertainty Index:

 1997q1
 (1952q1 to 2019Q3, simple average)

 2000q4

 2004q3

 2008q2

 2012q1

 2015q4

 2019q3
 0.00
 0.05
 0.10
 0.15
 0.20
 0.25
 0.30
 0.35

 1952q1

 1955q4

 1959q3

 1963q2
 Time coverage

 1967q1

 1970q4

 1974q3

 1978q2

 1982q1

 1985q4

 1989q3

 1993q2
 World Uncertainty Index:

 1997q1

 2000q4
 (1952Q1 to 2019Q3, GDP weighted average)

 2004q3

 2008q2

 2012q1

 2015q4

 2019q3
32
Trade uncertainty (WTU)

Note: The font in blue indicates the tariff measure taken, and the font in black indicates the narrative of
the World Trade Uncertainty index. A higher number means higher trade uncertainty and vice versa. The
source for the data on key dates in the US-China trade negotiations comes from Bown and Kolb (2019). 33
Trade uncertainty (WTU)

 34
0.00
 0.02
 0.04
 0.06
 0.08
 0.10
 0.12
 0.14
 0.16
 0.18
 0.20

 Q1-1996
 Q4-1996
 Q3-1997
 Q2-1998
 Q1-1999
 Q4-1999
 correlation: 0.7

 Q3-2000
 Q2-2001
 Q1-2002
 Q4-2002
 Q3-2003
 Q2-2004
 Q1-2005
 Q4-2005
 WUI

 Q3-2006
 Q2-2007
 Q1-2008
 Q4-2008
 Q3-2009
 Q2-2010
 Q1-2011
 FED (right axis)

 Q4-2011
 Q3-2012
 Q2-2013
 Monetary policy uncertainty

 Q1-2014
 Q4-2014
 Q3-2015
 40
 90
 140
 190
 240

35
THE WORLD UNCERTAINTY INDEX
Hites Ahir (IMF), Nick Bloom (Stanford University) and Davide Furceri (IMF)
 ASSA San Diego—January 2020
You can also read