Thermoregulation of plant systems as a factor of production processes
←
→
Page content transcription
If your browser does not render page correctly, please read the page content below
E3S Web of Conferences 285, 02013 (2021) https://doi.org/10.1051/e3sconf/202128502013
ABR 2021

 Thermoregulation of plant systems as a factor of
 production processes
 Alexander Grishin, Andrey Grishin, Inna Knyazeva *, and Vladimir Grishin
 Federal Scientific Agroengineering Center VIM,109428, Russia

 Abstract. Thermoregulation in plant systems is one of the main functions
 of transpiration, which plays the role of the upper terminal mover of the
 water current. It creates a continuous flow of water from the root system to
 the leaves and other vegetative organs of the plant, linking them into a single
 whole. This flow transports dissolved mineral and partially organic
 nutrients. The study of thermoregulation on plants of the strawberry garden
 variety Asia was conducted in 2019–2020 in the department of Closed
 Artificial Agroecosystems for Plant Growing at the Federal Scientific
 Agroengineering Center VIM, Moscow. The object of the study was
 thermoregulation processes occurring in plant systems. The subject of the
 study was the culture of garden strawberry Fragaria×ananassa (Weston.)
 Duchesne of the ‘Asia’ variety. As a source of light energy (LE) we used a
 thirty-six-watt bispectral lamp, consisting of 12 three-watt LEDs of red (660
 nm) and blue (450 nm) colors at a ratio of 10:2, providing constant
 illumination of the culture. The study results allowed for a digital control of
 the efficiency of production processes in plant systems, due to the
 implementation of a step-by-step control algorithm in digital devices. The
 algorithm makes it possible to establish the maximum temperature
 difference between the leaf surface and the air.

 1 Introduction
 Thermoregulation in plant systems is one of the main functions of transpiration, which plays
 the role of the upper terminal mover of the water current. It creates a continuous flow of water
 from the root system to the leaves and other vegetative organs of the plant, linking them into
 a single whole. This flow transports dissolved mineral and partially organic nutrients [1].
 Transpiration is a complex biological phenomenon associated with the operation of stomata.
 These pores facilitate evaporation creating a gradient of water flow through the plant [2-5].
 As a result, this phenomenon is the most important means of protecting leaves from
 overheating, which is very important for the life of the plant organism, and primarily for the
 processes of photosynthesis. Evaporation of water, like any other liquid, from the surface
 occurs due to the kinetic energy and constant motion of particles. A number of authors [6–8]

 *
 Corresponding author: knyazewa.inna@yandex.ru

© The Authors, published by EDP Sciences. This is an open access article distributed under the terms of the Creative Commons
Attribution License 4.0 (http://creativecommons.org/licenses/by/4.0/).
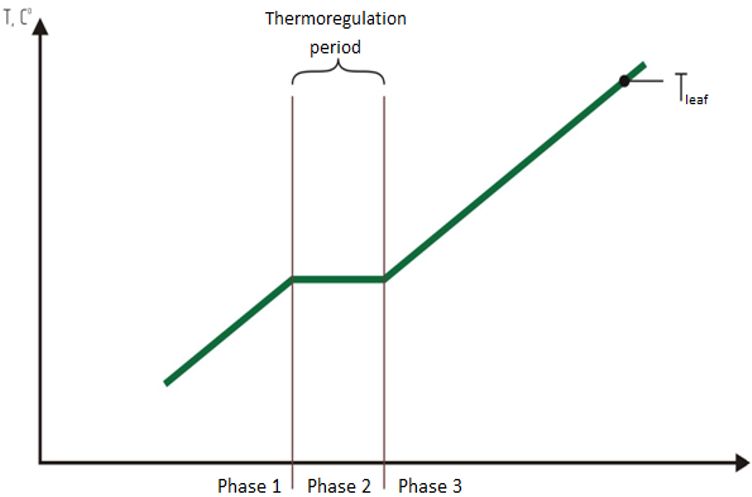
E3S Web of Conferences 285, 02013 (2021) https://doi.org/10.1051/e3sconf/202128502013
ABR 2021

 considered the process of thermoregulation from the standpoint of thermodynamics as four
 successive stages:
 Stage 1. Heating the thermal component of light energy (LE) coming from the light
 source, and the evaporation of water by the stomata of the leaf – El: Ev = Es – Ee, where Ev
 is the amount of heat transferred from water to the vapour-gas medium of air; Ee is the heat
 of evaporation;
 Stage 2. Cooling of plants until tv=tl, (where tv is the temperature of the vapour-gas
 medium; tl is the temperature of the leaf stomata) equality is established, heat transfer to the
 vapour-gas medium will stop (Ep = 0) and all the heat supplied from the stomata to the
 interface will be spent on evaporation, that is, El = Ee;.
 Stage 3. In the case of the earlier specified equality the pressure at the interface remains
 higher than in air, subsequently, evaporative cooling does not stop and tv becomes lower than
 tl and tair.
 Stage 4. As a result of a decrease in ts, the equality tv=tl is achieved and the heat flow
 from the liquid stops whereas the heat flow from the gaseous medium Еair becomes equal to
 Ee.
 Subsequently, liquid is evaporated at a constant temperature, which is based on stationary
 evaporation in an open nonlinear dynamic thermoregulatory cooling system. The stationarity
 of a random process is characterized by the constancy of the expectation and variance. In
 other words, the temperature of the leaf plate is stabilized, that is, thermoregulation plays the
 role of a self-organizing process of evaporative cooling (SPEC), proceeding as evaporation
 [9, 12, 13]. In this case, as can be seen from the description of the stages, there is an energy
 exchange between the external environment, which has a source of the thermal component
 of LE, and the plant system (Fig. 1) [10].

 Fig. 1. Leaf temperature with increasing air temperature (phase 1 – ambient temperature is below
 optimal; phase 2 – ambient temperature is higher than optimal; stomatal apparatus is functioning and
 the plant starts the cooling process (thermoregulation); phase 3 – ambient temperature is higher than
 optimal; the plant is not able to start the cooling process due to the limiting opening of the stomata

 2
E3S Web of Conferences 285, 02013 (2021) https://doi.org/10.1051/e3sconf/202128502013
ABR 2021

 Thermodynamic processes also have another, bioenergetic content, since they are based
 on synergistic relationships that link the energetics of photosynthesis with the energetics of
 evaporative cooling, which ensures the optimum temperature of photosynthesis, thereby
 regulating mineral nutrition in general, due to the flow of nutrients through the plant. These
 two bioenergetic processes determine the productivity of plant systems [11, 15].
 The effectiveness of mineral nutrition depends on the amount of nutrients entering the
 plant system, which, in turn, depends on the intensity or consumption of the nutrient solution
 through the plant. The consumption is determined according to the SPEC [11]. The amount
 of cooling water in plants for a certain period of time is determined by the expression:
 ( − )
 =

 where Ml is the total mass of leaves; Сl is the specific heat of the mass of leaves; rw is the
 specific heat of water evaporation; tl is the leaf temperature of the plant; to is the temperature
 optimum of photosynthesis.
 The physical meaning of the expression is that the thermal component of the LE energy,
 which depends on the difference between the temperature of the heated leaf and stabilization
 temperature, cools the leaf due to the SPEC. The intensity of the mineral nutrition
 consumption through the plant has a maximum value at the end of phase 2, since the air
 temperature continues to rise, while the period of stabilization of the leaf temperature
 (thermoregulation) is completed and the leaf surface heats simultaneously with the air while
 the maximum difference between them is preserved. The maximum flow rate at the end of
 phase 2 corresponds with a maximum photosynthesis rate, since to was reached [5, 13].
 Thus, the process of thermoregulation, which links the energetics of photosynthesis and
 the energetics of evaporative cooling, contributes to the control of nutrient consumption
 through plant tissues [14].
 The purpose of the study was to experimentally confirm the role of thermoregulation as
 a factor of production processes in a plant organism.

 2 Materials and methods
 The process of thermoregulation on plants of the Asia strawberry garden variety was studied
 in 2019–2020 in the department of Closed Artificial Agroecosystems for Plant Growing at
 the Federal Scientific Agroengineering Center VIM, Moscow. The object of the study was
 thermoregulation processes occurring in plant systems. The subject of the study was the
 garden strawberry culture Fragaria×ananassa (Weston.) Duchesne of the Asia variety.
 Strawberry plants were grown in a container with a soil substrate and an automatic
 moisture maintenance system. The container with the substrate had a film coating to exclude
 evaporation from the substrate surface.
 As a source of light energy (LE) we used a thirty-six-watt bispectral lamp, consisting of
 12 three-watt LEDs of red (660 nm) and blue (450 nm) colors at a ratio of 10:2, providing
 constant illumination of the culture.
 Despite the constancy of illumination and stabilization of the temperature of the leaf plate
 due to thermoregulatory evaporation, heating had random deviations due to errors in the
 parameters of the external environment (air movement, plant growth, and its approach to the
 light source) [5–7]. These deviations were checked for randomness from the expectation
 using the statistical method of successive differences.

 3
E3S Web of Conferences 285, 02013 (2021) https://doi.org/10.1051/e3sconf/202128502013
ABR 2021

 The leaf temperature was measured using a KELVIN IKS 4-20/5 non-contact
 thermometer; the measurement error was 0.5°C.
 The characteristics of the processes were measured thrice using an automatic recorder
 within 19 hours. The obtained experimental data were processed by the methods of
 mathematical statistics using Microsoft Office Excel 2016 and STADIA 8.0.

 3 Results and discussion
 The purpose of the experiment presented in Table 1 and Figure 2 was to study
 thermoregulation processes. The results of the experiment show that a period of
 thermoregulation lies within the time interval of 5–10 hours. We also registered some random
 deviations. This was confirmed by the calculation for randomness τ f > τ t , which corresponded
 to the statistical calculations of random deviations of the T lef sample. In the interval of 5–10
 minutes the leaf temperature remained stable at 22.4°C.
 Table 1 Average experimental values and statistical calculation of testing the hypothesis about the
 randomness of deviations in the sample of the leaf temperature stabilization period from the
 expectation

 Time, T air , T leaf ,
 o o
 hour C C Ta - Tl
 1 21.09 20.15 0.94
 2 21,7 21.11 0.59
 3 21.93 21.44 0.49
 4 21.98 21.77 0.21 x n (T l ) a = x n -x n -1 Σа2
 5 22.34 22.03 0.31 22.03 0.26 0.0676
 6 23.08 22.29 0.79 22.29 0.14 0.0196
 7 23.16 22.43 0.73 22.43 0.14 0.0196
 8 23.21 22.57 0.64 22.57 -0.04 0.0016
 9 23.34 22.53 0.81 22.53 0.04 0.0016
 10 23.39 22.57 0.82 22.57 0
 11 23.42 23.01 0.41 Mean 22.40333 Σа2 0.0424
 Mean
 square
 deviation,
 12 23.42 22.9 0.52 σ 0.211912 C2 = Σа2/2(n-1) 0.01696
 13 23.44 23.06 0.38 Disp, σ2 0.044907 τ f = C2/σ2 0.377672
 τ t = 1-2.33/
 14 23.91 23.47 0.44 √ + 1 0.119343
 15 24.52 24.09 0.43
 16 24.52 23.87 0.65
 17 24.54 24.03 0.51
 18 24.6 24.04 0.56
 19 25.62 25.07 0.55

 We also note that the 10 o’clock mark corresponds to the end of phase 2 and has the
 maximum value of the temperature difference Tw – Tl. According to the above formula, the
 amount of cooling water, due to the temperature difference, will correspond to the maximum
 intensity of the consumption of mineral nutrition.

 4
E3S Web of Conferences 285, 02013 (2021) https://doi.org/10.1051/e3sconf/202128502013
ABR 2021

 Graphs of air and leaf temperatures in an experiment on the study of
 thermoregulation of the Asia strawberry garden variety in the interval of 5–10
 minutes, which is the period of stabilization of the leaf temperature at a level of
 22.4°C
 26
 25
 Temperature, °C

 24
 23
 22
 21
 20
 0 5 10 15 20
 Time, hour

 Fig. 2. Temperature of ambient air and leaf of plants of the ‘Asia’ variety

 The study results make it possible to solve the issue of digital control of the efficiency of
 production processes in plant systems, due to the implementation of a step-by-step control
 algorithm in digital devices. Algorithm allows for the determination of the maximum
 temperature difference between the surface of the leaf and the air. When searching for the
 maximum temperature difference we compared current and maximum temperatures. If the
 current temperature difference is greater than the maximum, i.e. ∆Tcurrent> ∆Tmax, then the
 maximum value of the temperature difference has not yet been reached and the value of the
 current difference is assigned to it. If the temperature difference stops growing, i.e. ∆Тcurrent
 ≤ ∆Тmax, it is considered that a transition from phase 2 to phase 3 was found and the ambient
 temperature at a given time is optimal for the highest moisture consumption by the plant. In
 this case, the ambient temperature is set equal to the current ambient temperature (Tset =
 Tcurrent). As a result, the temperature search mode is disabled and the set Tset is maintained.

 4 Conclusions
 1. Thermodynamic processes are characterized by a bioenergetic content, since they are
 based on synergistic relationships that link the energetics of photosynthesis with the
 energetics of evaporative cooling, which ensures the optimum temperature of photosynthesis,
 thereby regulating mineral nutrition in general, due to the flow of nutrients through the plant.
 These two bioenergetic processes determine the productivity of plant systems.
 2. Thermoregulation by means of SPEC stabilizes the leaf temperature at the level of the
 maximum values of photosynthesis during a certain period of time.
 3. The maximum temperature difference between the air and the leaf leads to the maximum
 consumption of nutrients through plant tissues.
 4. The study results make it possible to solve the issue of digital control of the efficiency of
 production processes in plant systems, due to the implementation of a step-by-step control
 algorithm in digital devices.

 5
E3S Web of Conferences 285, 02013 (2021) https://doi.org/10.1051/e3sconf/202128502013
ABR 2021

 References
 1. S.T. Michaletz, M.D. Weiser, J. Zhou, M. Kaspari, B.R. Helliker, B.J., Enquist Plant
 Thermoregulation: Energetics, Trait-Environment Interactions, and Carbon
 Economics, Trends in Ecology & Evolution, 12(30), pp. 715-724 (2015)
 doi.org/10.1016/j.tree.2015.09.006
 2. A. Barekova, V. Barek, M. Kovacova, B.-K. Novotna, Climate conditions impact on
 the sap flow into plants and their dendrometric changes, Journal of ecological
 engineering, 21(6), pp. 224-228 (2020) doi: 10.12911 / 22998993/124077.
 3. A.Z. Venturin, C.M. Guimaraes, E. Fernandes de Sousa, J.A.M. Filho, R.P. Weverton,
 et al., Using a crop water stress index based on a sap flow method to estimate water
 status in conilon coffee plants, Agricultural water management, 241(106343), (2020)
 doi: 10.1016 / j.agwat.2020.106343.
 4. Y. Andreev, T. Makeeva, E. Pukhova, V. Sevryugin, G. Sherstnev, Technical means of
 digital information processing systems Moscow, Ivan Fedorov Moscow State
 University of Printing Arts, 74 p (2015).
 5. X. Kai, G. Liang, Y. Hong, A naturally optimized mass transfer process: The stomatal
 transpiration of plant leaves, Journal of Plant Physiology, 234 (235), p 138–144 (2019).
 6. A.P. Grishin Energy-information technologies of irrigation, Technologies in
 agriculture, 2, p. 22-25 (2010).
 7. A.A. Grishin, A.P. Grishin, Plant transpiration as a dissipative process with a temporal
 fractal structure, Nainovite scientific comprehension, Materials of 10th international
 scientific conference, 27, p. 44-51 (2014).
 8. A.P. Grishin, Energy flows of the transpiration process in plants. Intelligent machine
 technologies and equipment for the implementation of the state program for the
 development of agriculture, Collection of scientific reports of the International
 Scientific and Technical Conference, p. 210-214 (2015)
 9. V. Mudrik, I. Knyazeva, A. Kosobrukhov, T. Pigulevskaya, Changes in the
 photosynthetic characteristics of Plantago major plants caused by soil drought stress,
 Plant Growth Regulation, 40(1), p. 1-9 (2003).
 10. V. Mudrik, P. Stoyanov, B.N. Ivanov, Evaluation of maize productivity considering
 solar energy use limitation by environmental factors, Photosynthesis Research, 66, p.
 177 (2000).
 11. H. Hermann, Synergetics, 405 p. (1980)
 12. V. Karasev, M. Karaseva, D. Mukhortov, Diagnostics of the physiological state of
 coniferous trees by bioelectric and temperature indicators, Lesovedenie, 2, pp. 162-
 174. (2020) doi: 10.31857 / S0024114820010088.
 13. I. Sventitsky, Energy saving in the agro-industrial complex and energy extremity of
 self-organization, VIESH, 466 p. (2007).
 14. K. Kensuke, Y. Daisuke, K. Kota, K. Masaharu, Spatiotemporal variability of leaf
 photosynthesis and its linkage with microclimates across an environment-controlled
 greenhouse, Biosystems Engineering, 195 (2020). p. 97–115
 15. G. Nikolaou, D. Neocleous, E. Kitta, N. Katsoulas, Estimation of Aerodynamic and
 Canopy Resistances in a Mediterranean Greenhouse Based on Instantaneous Leaf
 Temperature Measurements. Agronomy 2020, 10(12) (1985)
 doi.org/10.3390/agronomy10121985

 6
You can also read