Tourism Sector Performance 2013 - 17 Feb 2014 - Singapore Tourism Board
←
→
Page content transcription
If your browser does not render page correctly, please read the page content below
Tourism Sector Performance 2013
                                                                                                     17 Feb 2014

These slides are property of STB and shall not be reproduced and/or redistributed without permission from STB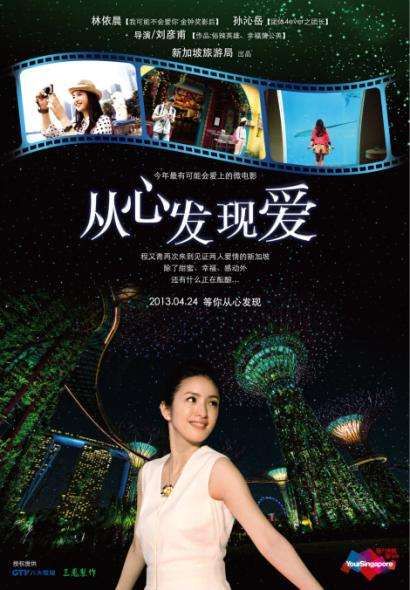
Presentation Outline
       Singapore’s Tourism Sector Performance 2013

1   Tourism Sector Performance

2   Performance of Core Industries

3   Other Highlights of 2013

    These slides are property of STB and shall not be reproduced and/or redistributed without permission from STB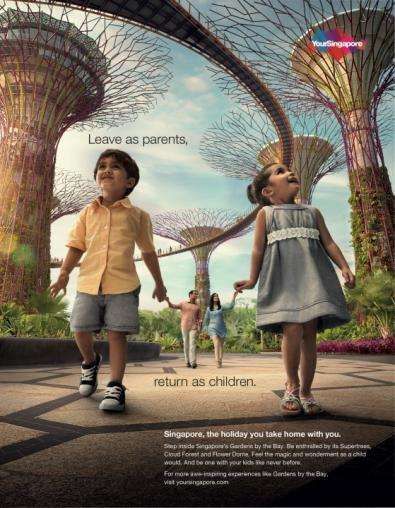
Presentation Outline
       Singapore’s Tourism Sector Performance 2013

1   Tourism Sector Performance

2   Performance of Core Industries

3   Other Highlights of 2013

    These slides are property of STB and shall not be reproduced and/or redistributed without permission from STB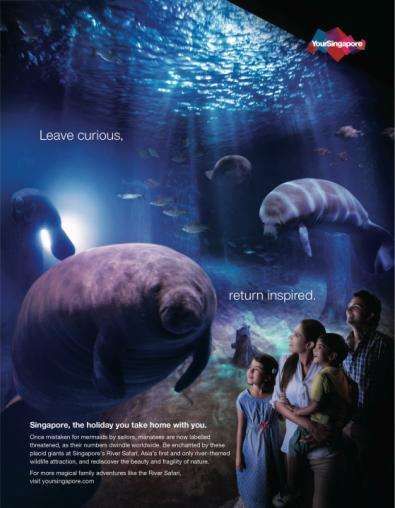
2013 Forecast: Recap

         Tourism Receipts                International Visitor Arrivals

S$23.5-24.5 14.8-15.5
              Billion                                   Million
        (1.6%-6% vs 2012)                         (2.1%-7.2% vs 2012)

Source: STB

                        © 2013 Singapore Tourism Board            4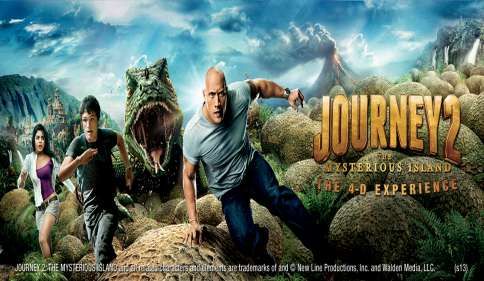
2013* Tourism Receipts
                                                              TR within the
S$23.5 billion
                                                               forecasted
                                     1.6%
                                                                 range                                   23.1       23.5
                                                                                                  22.3

                                                                                           18.9
  Tourism Receipts (S$ billion)

                                                              14.8      15.5

                                                       12.4                       12.6
                                                10.9
                                         9.8
                                  6.9

                                  2003   2004   2005   2006   2007      2008      2009     2010   2011   2012 2013*
* preliminary estimates
Source: STB                                               © 2013 Singapore Tourism Board                        5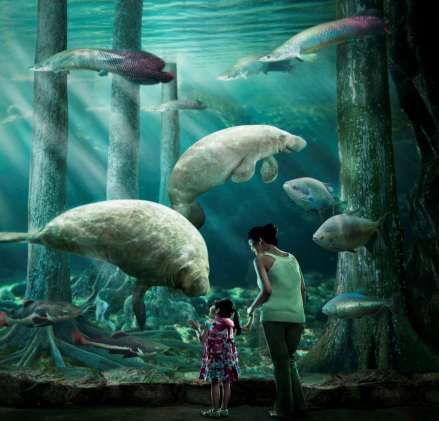
2013 Tourism Receipts:
                                                                 By Major Items
                    Growth
                  across most
                      TR                                                                                                            2013 % Change % Share
                                                                                                                                       vs 2012
                  components                                                              5.8
                                                     5.8               6.0
                                                                                                                                             -3%       25%
                                                                                                          Other TR
                                                                                                          Components
                                              5.4
                                                                       5.2                5.5             Sightseeing,
Tourism Receipts by Major Components

                                                                                                                                             5%        23%
                                                       5.4                                                Entertaiment &
                                                                                                          Gaming
                                              4.0                      2.2                2.3
                                       4.7           2.2                                                  Food &                             2%        10%
                                              1.9                                                         Beverage
              (S$ billion)

                                       1.5           4.4               5.0                5.3
                                              3.6                                                         Accommodation                      4%        22%
                                       2.8

                                       3.4    4.0    4.5               4.6                4.6             Shopping
                                                                                                                                             1%        20%

                                       2009   2010   2011             2012             2013*
 Expenditure is estimated from Overseas Visitor Survey.
 Other TR components include expenditure on airfares, port taxes, local transportation, business, medical, education and transit visitors.
 * Source:
   preliminary
           STBestimates                                           © 2013 Singapore Tourism Board                                                   6
 Source: STB
2013 Tourism Receipts:
                                                                 By Major Items
                    Growth                                         Includes airfare,
                  across most                                   education and medical
                      TR                                         expenditure amongst                                                2013 % Change % Share
                                                                                                                                       vs 2012
                  components                                            others
                                                                         5.8
                                                     5.8           6.0
                                                                                                                                             -3%       25%
                                                                                                          Other TR
                                                                                                          Components
                                              5.4
                                                                       5.2    5.5
                                                   Relatively          strong                             Sightseeing,
Tourism Receipts by Major Components

                                                                                                                                             5%        23%
                                                       5.4                                                Entertaiment &
                                              4.0 growth from    both2.3                                  Gaming
                                       4.7                    2.2                                         Food &
                                                      2.2                                                                                    2%        10%
                                              1.9   components    in                                      Beverage
              (S$ billion)

                                       1.5      comparison
                                                      4.4     to 20125.3
                                                              5.0
                                                                                                          Accommodation                      4%        22%
                                              3.6
                                       2.8

                                       3.4    4.0    4.5               4.6                4.6             Shopping
                                                                                                                                             1%        20%

                                       2009   2010   2011             2012             2013*
 Expenditure is estimated from Overseas Visitor Survey.
 Other TR components include expenditure on airfares, port taxes, local transportation, business, medical, education and transit visitors.
 * Source:
   preliminary
           STBestimates                                           © 2013 Singapore Tourism Board                                                   7
 Source: STB
2013 Tourism Receipts*
                                              Purpose of Visit
Leisure TR (YTD 3Q):                                      BTMICE TR                             Decline in BTMICE
                   10%                                    (YTD 3Q):                             TR due to cutback
                                                                      6%                        on travel budgets

   Leisure TR                                                          BTMICE TR
  (in billions)
                           Leisure TR                                  (in billions)
                                                                                               BTMICE TR
    9                                                                      7
                                               7.77
    8                                7.38                                  6                           5.61   5.74
                                                                                 5.39           5.38
    7       6.23                                        6.29
                            5.98                                           5
    6               5.32                                       +10%                     4.21                         4.10     -6%
    5                                                                      4
    4                                                                      3
    3
                                                                           2
    2
    1                                                                      1

    0                                                                      0
            2008    2009    2010     2011      2012     YTD Q3                   2008   2009    2010   2011   2012   YTD Q3
                                                         2013                                                         2013
* This figure excludes Sightseeing, Entertainment and Gaming expenditure
                                                                                                                8
Source: STB                                      © 2013 Singapore Tourism Board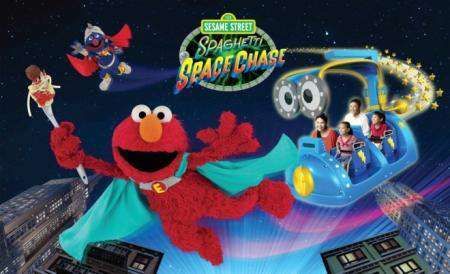
YTD 3Q 2013 Tourism Receipts:
               By Top 10 Markets (excl. Sightseeing, Entertainment & Gaming)
    S$14 billion Tourism Receipts in Jan-Sep 2013 (+2% vs Jan-Sep 2012)
                   Tourism Receipts by Major Components, Top 10 Markets, January to September 2013

    % Change                                                                                                                                             2013 TR*
     vs 2012                               Shopping           Accommodation              Food & Beverage             Other TR Components                  (S$ mil)

        2%                  Overall               26%                            29%                        13%                    33%                    13,582

       26%               P R China                             46%                                    21%             9%                 24%                 2,383

        -3%              Indonesia                      32%                        20%                8%                      40%                            2,253

        9%                    India             18%                          37%                             15%                     30%                     916

        3%                Australia         15%                      29%                       14%                           42%                             812

        -5%                  Japan         11%                       38%                             12%                       40%                           679

        -5%               Malaysia                     29%                         24%                 10%                      37%                          650

       -10%            Philippines               22%                                42%                              15%                    21%              523

        3%                Thailand                25%                                    41%                           15%                  19%              468

        -8%                    USA         9%                        41%                                   19%                       31%                     465

       17%                Vietnam                21%                         31%                      10%                      38%                           464

                                      0%         10%         20%      30%        40%           50%         60%     70%        80%           90%   100%
Expenditure is estimated from Overseas Visitor Survey.
Other TR components include expenditure on airfares, port taxes, local transportation, business, medical, education and transit visitors.
*Sightseeing , entertainment & gaming (SEG) has been excluded in the country analysis due to commercial sensitivity of information.

                                                               © 2013 Singapore Tourism Board                                                            9
YTD 3Q 2013 Tourism Receipts:
               By Top 10 Markets (excl. Sightseeing, Entertainment & Gaming)
    S$14 billion Tourism Receipts in Jan-Sep 2013 (+2% vs Jan-Sep 2012)
                   Tourism Receipts by Major Components, Top 10 Markets, January to September 2013

    % Change                                                                                                                                             2013 TR*
     vs 2012                               Shopping           Accommodation              Food & Beverage             Other TR Components                  (S$ mil)

        2%                  Overall
                                                 Increase
                                                   26%      in Shopping
                                                                   29%                                      13%                    33%                    13,582

       26%               P R China                     expenditure
                                                          46%                                         21%             9%                 24%                  2,383

        -3%              Indonesia                      32%                        20%                8%                      40%                             2,253

        9%                    India           Strong growth due
                                                18%           37% to                                         15%                     30%                      916

        3%                Australia           business travel
                                            15%          29% spend                             14%                           42%                              812

        -5%                  Japan         11%                       38%                             12%                       40%                            679

        -5%               Malaysia                     29%                         24%                 10%                      37%                           650

       -10%            Philippines               22%                                42%                              15%                    21%               523

        3%                Thailand                25%                                    41%                           15%                  19%               468

        -8%                    USA         9%                        41%                                   19%                       31%                      465

       17%                Vietnam                21%                         31%                      10%                      38%                            464

                                      0%         10%         20%      30%        40%           50%         60%     70%        80%           90%   100%
Expenditure is estimated from Overseas Visitor Survey.
Other TR components include expenditure on airfares, port taxes, local transportation, business, medical, education and transit visitors.
*Sightseeing , entertainment & gaming (SEG) has been excluded in the country analysis due to commercial sensitivity of information.

                                                               © 2013 Singapore Tourism Board                                                            10
YTD 3Q 2013 Tourism Receipts:
By Top 10 Markets (excl. Sightseeing, Entertainment & Gaming)
S$14 billion Tourism Receipts in Jan-Sep 2013 (+2% vs Jan-Sep 2012)
Tourism Receipts by Major Components, Top 10 Markets, January to September 2013
% Change 2013 TR*
vs 2012 Shopping Accommodation Food & Beverage Other TR Components (S$ mil)
2% Overall 26% 29% 13% 33% 13,582
26% P R China 46% 21% 9% 24% 2,383
-3% Indonesia Decrease
32% in expenditure
20% in8% 40% 2,253
9% India 18%
Other TR Components
37% 15% 30% 916
3% Australia 15% 29% 14% 42% 812
-5% Japan 11% 38% 12% 40% 679
-5% Malaysia 29% 24% 10% 37% 650
-10% Philippines Decrease
22% in F&B expenditure
42% 15% 21% 523
3% Thailand 25% 41% 15% 19% 468
-8% USA 9% 41% 19% 31% 465
Decrease in Accommodation
17% Vietnam 21% 31% 10% 38% 464
expenditure
0% 10% 20% 30% 40% 50% 60% 70% 80% 90% 100%
Expenditure is estimated from Overseas Visitor Survey.
Other TR components include expenditure on airfares, port taxes, local transportation, business, medical, education and transit visitors.
*Sightseeing , entertainment & gaming (SEG) has been excluded in the country analysis due to commercial sensitivity of information.
© 2013 Singapore Tourism Board 112013 International Visitor Arrivals
Singapore remains
15.5 million attractive as a
7.2% destination
15.5
14.5
13.2
International Visitor Arrivals (million)
11.6
9.8 10.3 10.1 9.7
8.9
8.3
6.1
2003 2004 2005 2006 2007 2008 2009 2010 2011 2012 2013
*Preliminary estimates for full year 2013 as Nov – Dec 13 VA is based on ICA topline figures 12
Source: STB © 2013 Singapore Tourism Board2013 International Visitor Arrivals
Purpose of Visit
Leisure IVA (YTD 3Q): BTMICE IVA Strong growth in
12% (YTD 3Q): both Leisure and
6% BTMICE arrivals
Leisure IVA BTMICE IVA
(in millions)
Leisure IVA (in millions)
BTMICE IVA
9 4
8.11
8 7.45 3.5 3.23 3.36
6.73 3.14
7 2.91
6.11 3
2.59 2.64
6 5.42 5.35 +12%
2.5 +6%
5
2
4
1.5
3
2 1
1 0.5
0 0
2008 2009 2010 2011 2012 YTD Q3 2008 2009 2010 2011 2012 YTD Q3
2013 2013
13
Source: STB © 2013 Singapore Tourism BoardYTD 3Q 2013 International Visitor Arrivals:
Top 15 Markets
11.8 million Visitor Arrivals in Jan-Sep 2013 (+10% vs Jan-Sep 2012)
(YTD 3Q)
% Change vs 2012
9% Indonesia 2,279
26% P R China 1,902
4% Malaysia 910
10% Australia 842
5% India 703 77% of IVA from Asia
12% Japan 619
4% Philippines 506
17% Hong Kong SAR 417 Growth seen across all
5% USA 372 markets except Germany
4% Thailand 360
3% South Korea 355
5% UK 346 No change in Top 15
Vietnam 295 markets ranking, except
3%
Taiwan 285
for Hong Kong and USA
29%
-2% Germany 186
© 2013 Singapore Tourism Board 14
Source: STBYTD 3Q 2013 International Visitor Arrivals:
Top 15 Markets
11.8 million Visitor Arrivals in Jan-Sep 2013 (+10% vs Jan-Sep 2012)
(YTD 3Q)
% Change vs 2012
9% Indonesia 2,279
26% P R China 1,902
4% Malaysia 910
10% Australia 842
5% India 703 Growth from P R China,
12% Japan 619 Taiwan and Hong Kong
4% Philippines 506 boosted by increase in air
capacity + higher twinning
17% Hong Kong SAR 417
traffic with Malaysia
5% USA 372
4% Thailand 360
3% South Korea 355
5% UK 346
3% Vietnam 295
29% Taiwan 285
-2% Germany 186
© 2013 Singapore Tourism Board 15
Source: STBYTD 3Q 2013 International Visitor Arrivals:
Top 15 Markets
11.8 million Visitor Arrivals in Jan-Sep 2013 (+10% vs Jan-Sep 2012)
(YTD 3Q)
% Change vs 2012
9% Indonesia 2,279
26% P R China 1,902
4% Malaysia 910
10% Australia 842
5% India 703
12% Japan 619
Growth from Japan due to:
4% Philippines 506 i) Diversion of travel from
17% Hong Kong SAR 417 some markets
5% USA 372 ii) Continued interest in SG
4% Thailand 360 due to new & refreshed
3% South Korea 355 offerings
5% UK 346
3% Vietnam 295
29% Taiwan 285
-2% Germany 186
© 2013 Singapore Tourism Board 16
Source: STBYTD 3Q 2013 International Visitor Arrivals:
Top 15 Markets
11.8 million Visitor Arrivals in Jan-Sep 2013 (+10% vs Jan-Sep 2012)
(YTD 3Q)
% Change vs 2012
9% Indonesia 2,279
26% P R China 1,902
4% Malaysia 910
10% Australia 842
5% India 703
12% Japan 619
4% Philippines 506
17% Hong Kong SAR 417
5% USA 372
4% Thailand 360
3% South Korea 355
5% UK 346 Decrease in air capacity
3% Vietnam 295
29% Taiwan 285
-2% Germany 186
© 2013 Singapore Tourism Board 17
Source: STB2013 Tourism Performance:
Key Highlights
Singapore remains
attractive as a
Spending grew across
destination: +7.2% in
most TR components
international visitor
arrivals.
Growth in BTMICE
arrivals offset cutback
in business travel
spendingSpecific Market Trends: Australia
4th largest market Marketing campaign (launched
(Jan – Sept 2013) in Mar 2012) has gained good
IVA: 842,000 (+10%) traction
TR: S$0.8 billion (+3%) Leisure IVA: +20%
Australians look for immersive experiences to gain a better understanding of
the people, culture and heritage
e.g. Little India, Chinatown
Digital resources are used, significantly more than other markets, to search,
plan and book holidaysAustralia Marketing Campaign:
“Get Lost and Find the Real Singapore”
• Challenge Australians’ perception of Singapore and deepen discovery of the real
Singapore
These slides are property of STB and shall not be reproduced and/or redistributed without permission from STBAustralia Marketing Campaign:
“Get Lost and Find the Real Singapore”
• Challenge Australians’ perception of Singapore and deepen discovery of the real
Singapore
Spike in search interest
and 3x increase in
traffic to campaign site
97% of survey
respondents indicated
improved perceptions
Travel agent partner of Singapore
saw an increase in
Singapore sales during
and after the campaign
These slides are property of STB and shall not be reproduced and/or redistributed without permission from STBSpecific Market Trends: India
YTD 3Q IVA: 703,000 (+5%)
YTD 3Q TR: S$0.9 billion (+9%)
Strong outbound business
travel from India to Singapore,
registering +17% in 2013
Sustained interest from
Indian leisure travellers
despite depreciation of the
rupee
STB with travel trade also reaching out to Tier 2 cities,
where catchment for middle class is larger and visitors are
starting to see travel as a status symbol.India Marketing Campaign:
“Singapore – The Holiday You Take Home With You”
• Highlighting the concentration of world-class experiences that visitors can enjoy
with their loved ones in Singapore
These slides are property of STB and shall not be reproduced and/or redistributed without permission from STBIndia Marketing Campaign:
“Singapore – The Holiday You Take Home With You”
• Highlighting the concentration of world-class experiences that visitors can enjoy
with their loved ones in Singapore
+88% in visits to
campaign site
47% increase in
number of Facebook
fans
Travel agent partners (169,095 fans to-date)
saw a healthy increase
in sales of tour
packages to Singapore
These slides are property of STB and shall not be reproduced and/or redistributed without permission from STBPresentation Outline
Singapore’s Tourism Sector Performance 2013
1 Tourism Sector Performance
2 Performance of Core Industries
3 Other Highlights of 2013
These slides are property of STB and shall not be reproduced and/or redistributed without permission from STBPerformance of Core Tourism Industries
Hotels Travel Services Attractions
Youth Olympic Games
Cruise BTMICE
These slides are property of STB and shall not be reproduced and/or redistributed without permission from STBHotels
Hotel industry performance held
steady despite increased supply –
Gazetted Hotel Revenue: S$2.9
billion (3.9% increase)
Hotel Rendezvous
Good traction on industry’s
productivity improvement and
capability upgrading effortsHotels
PARKROYAL on Pickering
Hotel Rendezvous
Hotel Clover Kampong Glam
Greater diversity and
individualisation of styles, meeting
needs of the discerning travellers
Singapore Marriott HotelHotels
Hotels across different tiers
continue to win
Pan Pacific
Singapore international awards
Holiday Inn
Wanderlust
Singapore
Hotel
AtriumHotels
Gazetted Hotel Average Average
Revenue Occupancy Room RevPAR
$2.9 billion Rate Rate $223
3.9% 86% $258
100 AOR (LHS) 400
ARR (RHS)
RevPAR (RHS)
350
85 87 85 86 87 86p
80 84 81
81 300
74 76
262 258p
ARR & RevPAR
67 245 247 250
60 218
AOR
202
(S$)
189 226 223p 200
164 199 214
40 137 186
176 150
126 116 122
140 143
100
115
20 94 98
78 50
0 0
2002 2003 2004 2005 2006 2007 2008 2009 2010 2011 2012 2013
Source: STB
Source: Monthly Hotel Returns as at 26 Jan©
2014
2013 Singapore Tourism Board 30
P: preliminaryHotels
2011 2012 2013 Hotel openings in 2013:
Holiday Inn Express Orchard
No. of Hotels* 304 338 373 The Westin Singapore
Ramada and Days Hotels at
No. of Hotel* 49,719 51,622 54,962 Zhongshan Park
rooms The Amoy
Nett Increase in 2,407 1,903 3,340 Upcoming Hotels:
room stock Sofitel So
Traders Orchardgateway
YOY % increase 5.1% 3.8% 6.5% One Farrer Hotel & Spa
in room stock
Source: STB
Number of licensed rooms as at 31 December 2013
*includes hostels with more than 4 rooms
Ramada and Days Hotel Singapore The Amoy
The Westin Singapore At Zhongshan Park
Holiday Inn Express
OrchardHotels
2011 2012 2013
No. of Hotels* 304 338 373
Pipeline of
No. of Hotel* 49,719 51,622 54,962 hotels in 2014:
rooms Approximately
Nett Increase in 2,407 1,903 3,340 3,000 rooms
room stock
YOY % increase 5.1% 3.8% 6.5%
in room stock
Source: STB
Number of licensed rooms as at 31 December 2013
*includes hostels with more than 4 rooms
Ramada and Days Hotel Singapore The Amoy
The Westin Singapore At Zhongshan Park
Holiday Inn Express
OrchardHotel Capability Development
Increased efforts to improve hotel productivity and talent supply
Leverage technology
• Hospitality Technology Education, jointly organized by
SHA-IDA-STB
• Call for Collaboration (CFC) for hotel self-service check-in
solutions
Upgrade manpower capabilities
• Job Flexibility Scheme (JFS)
• Allowed the hotels more flexibility in the deployment
of staff to different job areas when needed
• Received feedback from employees that wages have
increased, and new skills were acquired
• Success of pilot scheme with hotel industry led to the
expansion of JFS to other sectors, including F&B and
retail
Develop Tourism Careers
• First-ever Future Leaders 2013 engagement session
between educational institutions & industry
• Positive feedback received on how the session helped
correct misperceptions about career progression
opportunities and remuneration in the industryHotel Productivity Case Studies Holiday Inn Singapore Atrium What: RFID linen management system How: Substituted the manpower-intensive practice of manually sorting and counting linen with automated processes Impact: • 50% decrease in time and manpower requirements (from 120 to 60 mins) • Greater accuracy in linen inventory management • Cost-savings went into upward wage adjustment for employees Marina Mandarin Singapore What: OneGuest Mobile Solution for F&B How: Allowing guests to browse menu and place orders on iPads Impact: • Service time decrease by 33% allowing hotel to employ one staff less per shift. • Staff can refocus their attention to better engage guests Ramada & Days Hotels Singapore at Zhongshan Park What: ME LEAP! multi-skilling program How: Developed new positions called Masters of Experience (“ME”) where employees are trained to be multi-skilled in various facets of hotel operations Impact: • As of end Feb 2014, of the 34 MEs hired, 14 have been promoted to ME Executives and other positions • Increased productivity within and across departments and hotels through multi-skilling and cross- deployment • Promoted 40% of ME Associates within and across the Hotels’ departments, expanding the hotel’s talent pool • Enhanced the Ramada and Days Hotel brand in Singapore, driving brand awareness among hospitality professionals and target students • Managed turnover due to strong employee engagement and through open communication
Performance of Core Tourism Industries

  Hotels                                 Travel Services                                             Attractions

                                                                     Youth Olympic Games

                           Cruise                                               BTMICE

These slides are property of STB and shall not be reproduced and/or redistributed without permission from STBTravel Agents
Licensed Travel Agents (TAs), 2007
No. of TAs in 2013: Total no. of TAs
1400 – 2013
1154 (as at 31 Dec 2013) 1200
975
1046
1103
1154
1000 931
No of ceased TAs: 101 800
788
873
600
400
200
0
2007 2008 2009 2010 2011 2012 2013
Initiatives undertaken with the TA industry:
Launched Travel Agent Manpower Study (Dec 2013) – To better
understand issues faced by the industry and to develop initiatives to
address these issues
Adoption of innovation and to increase productivity: Call-for-
Collaboration jointly organised by STB and IDA
Regular engagement sessions with industry to discuss industry trends and
developments
Source: STBTravel Agents
Investment in technology to increase productivity and enhance customers’
experience
Asiatravel.com: Demonstrating innovation & new business
models
Asiatravel.com launched “TACentre.com” – a B2B booking
platform which allows smaller TAs instant access and
confirmation to Asiatravel.com’s extensive inventory.
Recorded 50% increase in revenue since its launch, with a
growth forecast of 130% within the next 3 years.
Dynasty Travel: Investing in technology for a seamless
experience
Launch of iDynasty mobile app for customers to obtain
information on-the-go
Collaboration with AXS enables customers to make
payments at their convenience
Both initiatives have contributed to a 15% YOY growth in
revenue
These slides are property of STB and shall not be reproduced and/or redistributed without permission from STBTravel Agents
Professional skills recognition through the NATAS Accreditation Scheme
The NATAS Accreditation Scheme was
launched in Mar 2013 to:
Increase productivity by equipping
employees with the right service mind-
sets, skills and knowledge
Attract and retain talent by giving
recognition through professional
certification
Improve industry’s professionalism &
profitability through upgrading of human
resource capabilities
To date, 196 individuals have participated
with another 56 currently undergoing
accreditation assessment
These slides are property of STB and shall not be reproduced and/or redistributed without permission from STBTourist Guides
2,360 licensed 139 97%
tourist guides new Singaporeans and
as of end 2013 licensees PRs
No. of Licensed Tourist Guides (TGs), 2007 – 2013
2400 2360
2336
2300 2315
2200
2145
2193
2100 2148
2000 2023
1900
1800
2007 2008 2009 2010 2011 2012 2013
Source: STB These slides are property of STB and shall not be reproduced and/or redistributed without permission from STBTourist Guides
Continued efforts in raising
Travelthe professionalism
Agents Industry of tourist guides
Development
STB Act and Tourist Guide Regulations Review
- Raising professionalism of tourist guides and quality of
tourist guiding
- Public consultation: positive feedback received on
proposed amendments
- 1st Reading: 20th January
- 2nd Reading:17th February
Source: STB These slides are property of STB and shall not be reproduced and/or redistributed without permission from STBTourist Guides
Continued efforts in raising
Travelthe professionalism
Agents Industry of tourist guides
Development
Raise professionalism of TGs
- New Professional Development Courses (PDC) titles on new tourism products
and skill-based training
- Working with WDA on the review of the WSQ Tour and Travel Competency
Roadmap
Continued enforcement checks
- Regular enforcement checks conducted
- Industry affirmed that enforcement efforts were felt on the ground. Travel
agents also more cautious to not engage unlicensed tourist guides.
Source: STB These slides are property of STB and shall not be reproduced and/or redistributed without permission from STBPerformance of Core Tourism Industries
Hotels Travel Services Attractions
Youth Olympic Games
Cruise BTMICE
These slides are property of STB and shall not be reproduced and/or redistributed without permission from STBAttractions
Most visited attractions (in alphabetical order)
Gated Attractions
• MBS Skypark Cultural and lifestyle
• Night Safari/Singapore Zoo
• Sentosa precincts continue to enjoy
• Singapore Flyer/ Flight Experience healthy patronage by
• Universal Studios Singapore visitors
Universal Studios Skypark Sentosa Singapore Zoo
Merlion Park Chinatown Orchard Road Marina Bay
Source: STB Overseas Visitor Survey, Q1 – Q3 2013 These slides are property of STB and shall not be reproduced and/or redistributed without permission from STBAttractions
Soft opening of the River Safari in River Safari has further entrenched
April 2013, followed by the launch the Mandai area as a top nature and
of the Amazon River Quest Boat family attraction, complementing our
Ride in December 2013 current range of leisure offerings
Giant Panda Forest
Amazon Flooded Forest Amazon River Quest
Images credited to Wildlife Reserves SingaporeAttractions
Introduction of new offerings at existing Attractions
Shark Encounter SEA TREK Adventure Open Ocean Dive
Launch of Marine Life Encounters at Marine Life Park, Resorts World Sentosa (RWS)
Launch of Journey 2: The Mysterious Island at Launch of Sesame Street Spaghetti Space Chase Ride
Sentosa 4D AdventureLand at Universal Studios Singapore
Images credited to Resorts World Sentosa, JOURNEY 2: THE MYSTERIOUS ISLAND and all related characters and elements are trademarks of and © New Line Productions,
Inc. and Walden Media, LLC, and Sesame Street © 2013 Sesame Workshop. All Rights Reserved. Universal Studios Singapore ® & © Universal Studios. All Rights Reserved.Attractions
Introduction of new offerings at existing Attractions
The Sentosa 4D AdventureLand
underwent its first-ever rejuvenation
since 2006 and now includes the new
ride Journey 2: The Mysterious Island at
Sentosa 4D AdventureLand.
The rebrand has helped Sentosa 4D
AdventureLand develop a stronger
brand identity across its various rides.
Launch of Journey 2: The Mysterious Island at
Sentosa 4D AdventureLand
Images credited to Resorts World Sentosa, JOURNEY 2: THE MYSTERIOUS ISLAND and all related characters and elements are trademarks of and © New Line Productions,
Inc. and Walden Media, LLC, and Sesame Street © 2013 Sesame Workshop. All Rights Reserved. Universal Studios Singapore ® & © Universal Studios. All Rights Reserved.Attractions
Introduction of new offerings at existing Attractions
Shark Encounter SEA TREK Adventure Open Ocean Dive
Launch of Marine Life Encounters at Marine Life Park, Resorts World Sentosa (RWS)
The Marine Life Park at RWS, consisting
of the S.E.A. Aquarium and Adventure
Cove Waterpark, welcomed more than
3 million visitors in 2013
RWS has won the Best Integrated
Resort at the TTG Travel Awards 2013
for the third consecutive year
Launch of Sesame Street Spaghetti Space Chase Ride
at Universal Studios Singapore
Images credited to Resorts World Sentosa, JOURNEY 2: THE MYSTERIOUS ISLAND and all related characters and elements are trademarks of and © New Line Productions,
Inc. and Walden Media, LLC, and Sesame Street © 2013 Sesame Workshop. All Rights Reserved. Universal Studios Singapore ® & © Universal Studios. All Rights Reserved.Capability Development for Attractions
Attractions Experience Development Series (AEDS)
Enhance capabilities. Craft compelling stories.
Deliver memorable experiences.
Develop a dynamic, sustainable business model.
1Experience Creation
“Telling & Delivering the Story”
2 Business
Sustainability
5 seminars 4 Masterclasses
Over 9 months
“The Business Model”
(Jul’13 - Mar’14)
457participants to date
Jointly organized byCapability Development for Attractions
Attractions Experience Development Series (AEDS)
Enhance capabilities. Craft compelling stories.
Deliver memorable experiences.
Develop a dynamic, sustainable business model.
1Experience Creation
“Telling & Delivering the Story”
2
Local attractions are taking
Business steps to redesign
Sustainability experiences and develop
“The Business Model”
stronger storytelling
components
Jointly organized byPerformance of Core Tourism Industries
Hotels Travel Services Attractions
Youth Olympic Games
Cruise BTMICE
These slides are property of STB and shall not be reproduced and/or redistributed without permission from STBCruise
Throughput crosses 1 million mark
Cruise passenger throughput grew 13% from 2012
390 1.03mil
ship calls were made cruise passenger throughput
1,139
943 1,014 942
1,030
857 920 913
635 624
1,018 926
787 717 640
392 454 394 332
334 390
2004 2005 2006 2007 2008 2009 2010 2011 2012 2013
No. of ship calls Cruise throughput (‘000)
Source: Singapore Cruise Centre; SATS-CreuersCruise
Celebrity Solstice
MARINA BAY CRUISE CENTRE SINGAPORE (MBCCS)
The 12 ships that made
maiden calls in 2012
continue to return to
Singapore for deployment
Maiden voyages to
SINGAPORE CRUISE CENTRE (SCC) Singapore in 2013
continue to remain
healthy
52Cruise
Celebrity Solstice
Mariner of the Seas, 3114pax
Sea Princess, 1950pax
Maiden voyages with large
capacity:
• Costa Atlantica Costa Atlantica, 2,680pax
• Sea Princess
• Mariner of the Seas
Columbus II, 824pax
Europa II, 516pax Le Soleal, 264pax
Sea Dream II, 110pax
Caledonian Sky,
114pax
53Cruise
Greater presence of cruise companies
Regional HQ of world’s top 3 cruise New/ more deployments in Asia &
companies (with 75% of market share) Singapore
situated in Singapore
3 May 2013, Straits Times Maiden Call (2015/16):
“the establishment of our
regional office in
Singapore underscores
Carnival Corporations &
plc’s significant step Multiple-deployments:
towards developing Asia’s
markets” – Pier Foschi
9 October 2013, Celebrity Press Room
(2015/16) (2013/14) (2013/14)
Celebrity Century Costa Victoria Diamond Princess
“…will be based out of Singapore, and will Celebrity Millennium Costa Atlantica Sapphire Princess
oversee the brand's commercial, marketing,
trade support and sales in the region.”
- More vibrant & diverse cruise
- Increased operating functions in
landscape
Singapore
- Source markets expandedCruise
Industry growing in tandem with potential
Partnered regional Launched Passenger
Local trade stepping up
governments to showcase Experience Committee
Southeast Asia
Consisting of key industry
Business models evolving to
players to address issues
10-day inaugural FAM grow cruise business
related to cruise passenger
12 executives, 8 cruise lines
experience
Collaborated with 3 NTOs Sembawang shipyard –
(Malaysia, Thailand, Frequent conversations secured Princess Cruises as
Indonesia) on designing ideal long-term partner
experiences Chan Brothers & CTC
Refreshed itineraries Increased transport Travels – set up dedicated
Deepened local trade’s connectivity near cruise departments
understanding of cruise terminals Citystate Travel – acquired
lines’ needs Enhanced terminal ACE Cruise Holidays for
operations e.g. signage cruise expansion into Asia
placementsPerformance of Core Tourism Industries
Hotels Travel Services Attractions
Youth Olympic Games
Cruise BTMICE
These slides are property of STB and shall not be reproduced and/or redistributed without permission from STBBTMICE
Continued efforts to entrench Singapore’s positioning as a leading MICE hub
Winning International Accolades
Vibrant & Impactful Business Events Calendar
Catalysing Partnerships
Setting New Benchmark On SustainabilityBTMICE
International Accolades
MICE
International Congress and Convention Association (ICCA) Global Rankings 2012
Top Convention City in Asia for the 11th consecutive year
Only Asian city in the Top Ten Convention Cities in the World
Union of International Associations (UIA) Global Rankings 2012
Top International Meeting Country for the 2nd consecutive year
Top International Meeting City for the 6th consecutive year
UFI, The Global Association of the Exhibition Industry, The Trade Fair Industry Report 9th edition
Highest Revenue net square meter sold in Asia Pacific in 2012
Business
TTG Travel Awards 2013
Best BT MICE City
Business Traveller Asia-Pacific Travel Awards 2013
Best Business City in Southeast Asia
World Travel Awards 2013
Asia's Leading Meetings & Conference DestinationBTMICE
Vibrant & Impactful Business Events Calendar: Trade Conferences & Exhibitions
Inaugural Significant & Strategic
FIRST IN ASIA
Travel
Design
Media &
Digital Content
Urban
Solutions /
Transport
LifestyleBTMICE
Vibrant & Impactful Business Events Calendar: Trade Conferences & Exhibitions
Inaugural Significant & Strategic
FIRST IN ASIA
TravelRave: More
than 10,800
Travel attendees
ITB Asia: Attracted
Design over 9,000 attendees, ATLS: Launch of
7% YOY growth in EDP in Q1 2014 Increase in
visitorship visitorship
Media &
Digital Content
SITCE: Over 1,500
Urban conference delegates
Solutions / and 3,000 trade Increase in foreign
Transport visitors exhibiting
companies
LifestyleBTMICE
Vibrant & Impactful Business Events Calendar: World Congresses, Meetings And Incentives
Singapore remains strong as a centre for thought-leadership
events, hosting 12 World Congresses and several key
meetings in 2013. Some key events hosted include:
• World Library and Information Congress IFLA 2013
• CFA Institute Annual Conference 2013
• Regional World Health Summit Asia 2013
• Amway Japan Leadership Achievement Seminar 2013
We continue to build a robust pipeline by securing 204
association conventions (11 of which are world congresses),
meetings and incentives* in 2013. Some key events secured
include:
• Global Department Store Summit 2014
• Herbalife Asia Extravaganza 2014
• Executive MBA Annual Conference 2015
• Interdisciplinary World Congress on Low Back
& Pelvic Pain 2016
* Refers to events supported/ facilitated by STB. Does not include trade conferences and exhibitions.BTMICE
Catalysing Partnerships
Partnerships With Local Industry Partnerships With International Associations
Launched INSPIRE (In Singapore
Incentive & Rewards) to attract PROFESSIONAL CONVENTION MANAGEMENT
the India incentive segment to ASSOCIATION (PCMA)
enjoy the wide range of unique Partnered with the PCMA to leverage their expertise in
customised incentive convention management, for the local meetings
experiences in Singapore. industry to learn international standards and
best practices.
UNION OF INTERNATIONAL ASSOCIATIONS (UIA)
Hosted the inaugural UIA Associations RoundTable
Asia 2013 during TravelRave, to strengthen
Launched SMAP, the industry’s first
capabilities of the association sector in the region.
MICE partnership with SIA and CAG
offering one-stop support and
incentives for meeting planners and
MICE visitors e.g. preferential rates
for airfares and cargo on SIA and
Changi shopping vouchersBTMICE
Setting New Benchmark On Sustainability
Launched a set of
Sustainability Guidelines in
Nov 2013
To encourage local MICE
players to meet global
sustainability requirements
so as to strengthen their
business value propositionPresentation Outline
Singapore’s Tourism Sector Performance 2013
1 Tourism Sector Performance
2 Performance of Core Industries
3 Other Highlights of 2013
These slides are property of STB and shall not be reproduced and/or redistributed without permission from STBDifferentiated Marketing Campaigns – China “从心发
现 New Discoveries”
• Provide Chinese visitors with the
personalisable, in-depth experiences
they are looking for
These slides are property of STB and shall not be reproduced and/or redistributed without permission from STBDifferentiated Marketing Campaigns – China
“从心发现” (New Discoveries)
• Provide Chinese visitors with the
personalisable, in-depth experiences
they are looking for
2.1 million views of the
microfilm since August
2013
RMB 20 million worth
of media coverage
25,000 new fans
acquired on STB Sina
Weibo
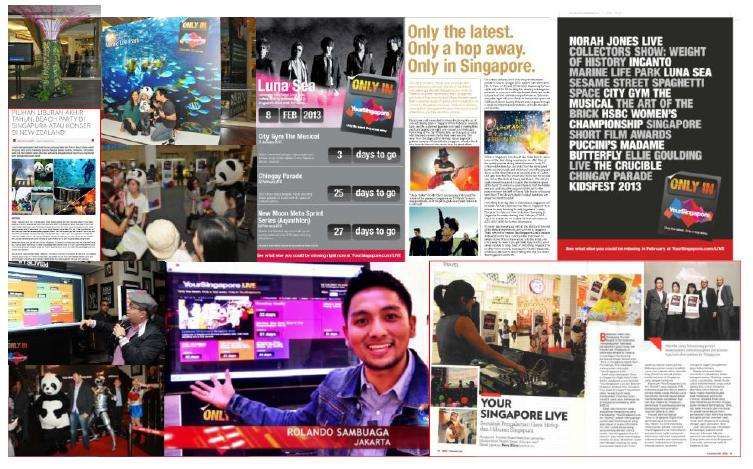
These slides are property of STB and shall not be reproduced and/or redistributed without permission from STBDifferentiated Marketing Campaigns – Malaysia &
Indonesia “Only in Singapore, Right Now!”
Highlighting
Singapore’s myriad of
experiences beyond
what Malaysians and
Indonesians already
know
These slides are property of STB and shall not be reproduced and/or redistributed without permission from STBDifferentiated Marketing Campaigns – Malaysia &
Indonesia “Only in Singapore, Right Now!”
Highlighting
Singapore’s myriad of
Increase in overall experiences beyond
engagement with what Malaysians and
campaign portal Indonesians already
know
124% increase in Malaysia: +73% in
number of Indonesian number of stories
Facebook fans generated leading to
(169,760 fans to-date) +66% in IMV
These slides are property of STB and shall not be reproduced and/or redistributed without permission from STBFormula One Singapore Grand Prix
Grand Prix Season Singapore (GPSS)
• A season of high impact and innovative lifestyle
concepts in Singapore’s key precincts prior to
and around the F1 Singapore Grand Prix
• Significant growth to over 50 promotions and
events from Arts, Entertainment, Retail and
Dining
• Established platform to encourage innovation
and for businesses to test-bed lifestyle concepts
F1 Community Activities
• Concerted efforts to increase community
engagement activities such as school visits,
“Behind the Scenes” tours, movie screenings,
and the first-ever Pit Lane Walk Experience
• Generated positive media coverage of
programmes and reached out to >30,000
people
These slides are property of STB and shall not be reproduced and/or redistributed without permission from STBKickstart Fund
Incentivising untested yet innovative lifestyle events and concepts
Singapore Art Book Fair:
Collaboration between creative consultancy
HJGHER and independent bookstore and
publisher BooksActually
Only art book fair in Southeast Asia
specialising in art and design literature
Ticketed fringe events such as artist talks,
film screenings and book launches, to attract
visitors beyond the arts community
Saw over 5,600 visitors, and received
positive feedback from its attendees
Slated to return for a second edition in the
later part of 2014
These slides are property of STB and shall not be reproduced and/or redistributed without permission from STBLocal Engagement Initiative
Instilling pride in and engendering conversations about Singapore as a leisure
destination
#sgshiok
A social media driven initiative to trigger and
stimulate conversation amongst the local
community
Introduced hashtagged version of Shiok
destination video
Local Engagement Activities
Say Something Shiok Blogger Event at
Singapore Food Trail
Say Something Shiok Mobile at East Coast
Park & Orchard Road
F1 Pit Lane Walk Experience
These slides are property of STB and shall not be reproduced and/or redistributed without permission from STBTourism 2013 Roundup: In Summary
On the journey towards Quality Tourism
New Record
Tourism Performance Local enterprises
stepping up innovation
TR: $23.5b (+1.6%) and productivity
IVA: 15.5m (+7.2%)
Greater local
engagement and
participationTourism 2014: Looking Ahead
Considerations
Asia-Pacific Economic
outbound travel uncertainties
projected to grow prevail in some
(UNWTO) markets
LCC phenomenon
Spend may
to continue +
moderate, BT in
intensifying inter-
particular
airline competitionThank You
Q&A
You can also read