Transport Strategy Transport East - Unlocking International Gateways
←
→
Page content transcription
If your browser does not render page correctly, please read the page content below
Transport East
Transport Strategy
Unlocking International Gateways
November 2021
Unlocking International Gateways
Transport Strategy Evidence Base

Transport Strategy Evidence Base

                                   1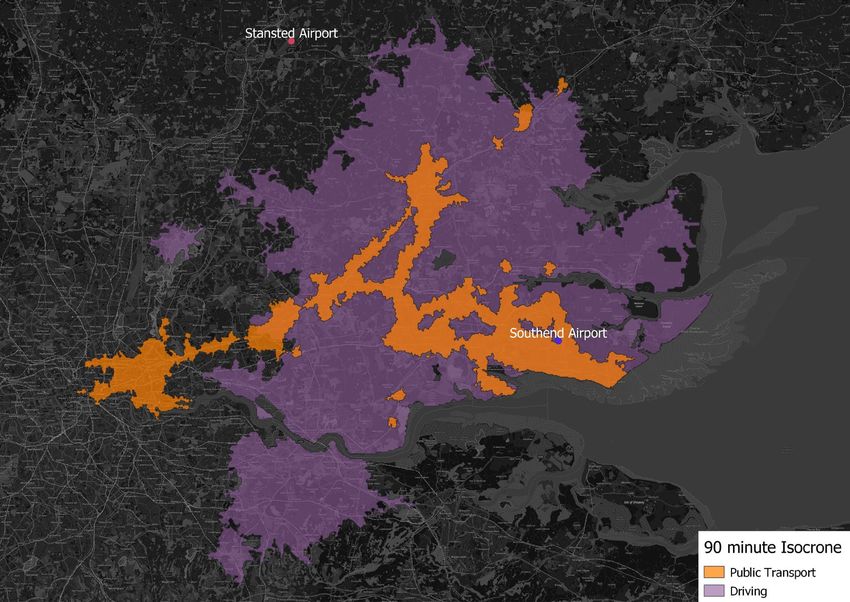
Unlocking International Gateways
Contents

Contents
Executive Summary ........................................................................................................................................ 4
1        Introduction ......................................................................................................................................... 11
         1.1      Introduction to the Transport Strategy ........................................................................................ 11
         1.2      Introduction to the Deep Dives .................................................................................................... 11
         1.3      Wider Outcomes ......................................................................................................................... 12
         1.4      Content of the Technical Note .................................................................................................... 12
2        What is the significance of international gateways? ....................................................................... 13
         2.1      National Significance of International Gateways ........................................................................ 13
                  2.1.1 Ports.................................................................................................................................. 14
                  2.1.2 Airports.............................................................................................................................. 14
         2.2      Regional Significance of International Gateways ....................................................................... 16
                  2.2.1 Ports.................................................................................................................................. 17
                  2.2.2 Airports.............................................................................................................................. 18
3        Ports ..................................................................................................................................................... 22
         3.1      Gateway Summary...................................................................................................................... 22
                  3.1.1 London Ports .................................................................................................................... 22
                  3.1.2 Felixstowe ......................................................................................................................... 27
                  3.1.3 Harwich ............................................................................................................................. 30
                  3.1.4 Ipswich .............................................................................................................................. 31
                  3.1.5 King’s Lynn ....................................................................................................................... 31
                  3.1.6 Lowestoft........................................................................................................................... 31
                  3.1.7 Great Yarmouth ................................................................................................................ 32
                  3.1.8 Mistley ............................................................................................................................... 32
                  3.1.9 Brightlingsea ..................................................................................................................... 33
                  3.1.10 Wallasey/Baltic Wharf ....................................................................................................... 33
         3.2      Key Challenges and Opportunities Summary ............................................................................. 33
                  3.2.1 Impact of COVID-19 & Brexit ............................................................................................ 33
                  3.2.2 Free Port Update .............................................................................................................. 34
                  3.2.3 Opportunities & constraints............................................................................................... 37
         3.3      Regional Port Volumes ............................................................................................................... 38
                  3.3.1     Categories of international freight ..................................................................................... 38
                  3.3.2     LO-LO Freight ................................................................................................................... 39
                  3.3.3     Ro-Ro Freight ................................................................................................................... 44
                  3.3.4     Bulk Freight ....................................................................................................................... 47
                  3.3.5     Future growth of freight..................................................................................................... 51
                  3.3.6     Opportunities & constraints............................................................................................... 53
         3.4      Passenger movement ................................................................................................................. 54
         3.5      Access to Ports ........................................................................................................................... 55
                  3.5.1 Road access ..................................................................................................................... 55
                  3.5.2 Rail access........................................................................................................................ 59

                                                                                                                                                                  2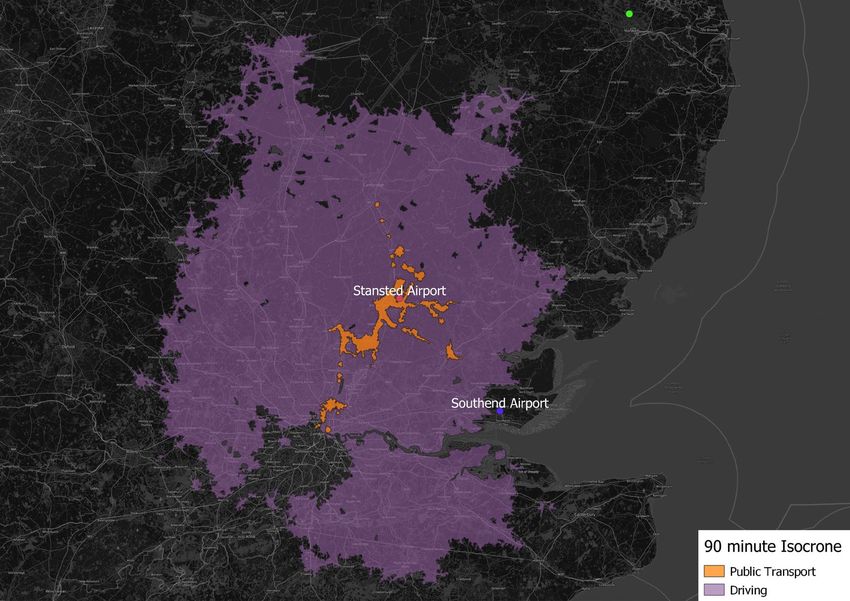
Unlocking International Gateways
Contents

               3.5.3 Water access .................................................................................................................... 64
4     Airports................................................................................................................................................. 66
      4.1      Gateway Summary...................................................................................................................... 66
               4.1.1     London Stansted Airport ................................................................................................... 66
               4.1.2     London Southend Airport .................................................................................................. 66
               4.1.3     Norwich Airport ................................................................................................................. 67
               4.1.4     Airport challenges ............................................................................................................. 67
      4.2      Air freight context ........................................................................................................................ 69
               4.2.1 Challenges to Air Freight .................................................................................................. 70
      4.3      Passenger movements ............................................................................................................... 71
               4.3.1     London Stansted Airport passengers ............................................................................... 71
               4.3.2     Norwich Airport passengers.............................................................................................. 72
               4.3.3     London Southend Airport passengers .............................................................................. 73
               4.3.4     Challenges to passenger movement ................................................................................ 74
      4.4      Surface Access to Airports .......................................................................................................... 74
               4.4.1 Access to London Stansted Airport .................................................................................. 74
               4.4.2 Access to Norwich Airport................................................................................................. 78
               4.4.3 Access to London Southend Airport ................................................................................. 80
5     Engaging with our Partners ............................................................................................................... 83
      5.1      One to One Engagement ............................................................................................................ 83
               5.1.1 Questions driving discussion ............................................................................................ 83
               5.1.2 Airport discussions ............................................................................................................ 83
               5.1.3 Ports and Logistics discussions ........................................................................................ 84
      5.2      Ports Roundtable Session .......................................................................................................... 85
               5.2.1 Workshop detail ................................................................................................................ 86
               5.2.2 Key feedback themes per topic question .......................................................................... 86
6     Summary/Concluding comments ...................................................................................................... 89
      6.1      Ports ............................................................................................................................................ 89
      6.2      Airports ........................................................................................................................................ 89
      6.3      Access to gateways .................................................................................................................... 90
      6.4      General Challenges & Opportunities .......................................................................................... 91
      6.5      What does this mean for Transport East’s Strategy? ................................................................. 92

                                                                                                                                                               3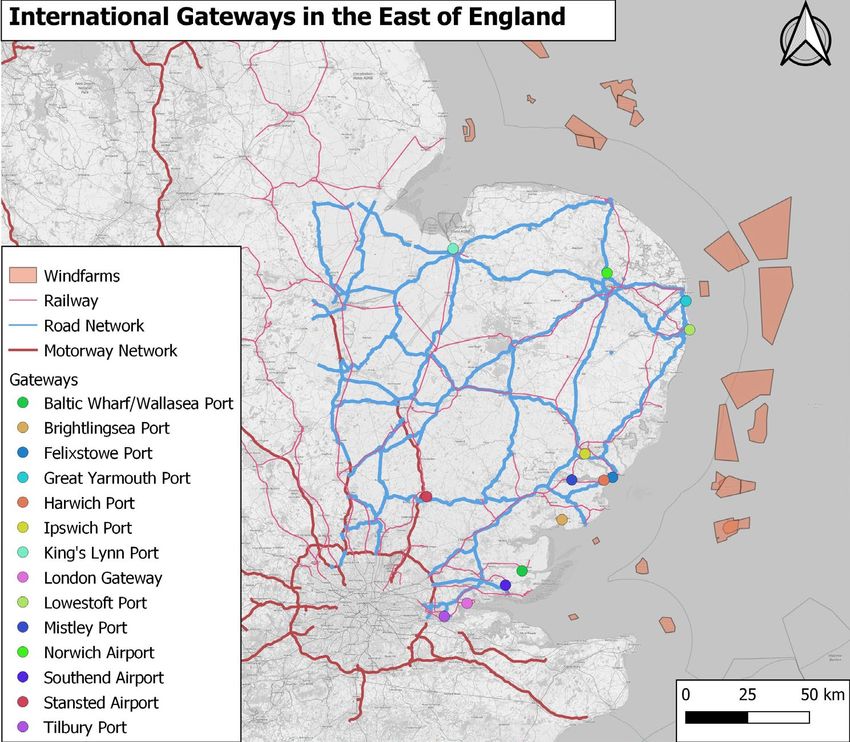
Unlocking International Gateways
Executive Summary

Executive Summary
Transport East has a vision for a thriving economy for the East, with fast, reliable, and resilient transport
infrastructure driving forward a future of inclusive and sustainable growth for decades to come. Over the next
30 years Transport East wants to transform the region’s transport connections to help drive long term economic
growth. A Transport Strategy for the region will be developed to take the region to 2050. This Deep Dive topic
will address an understanding of the key elements of international gateways, focusing specifically upon the
economic significance of global gateways in the region, their current function, vision for expansion and
challenges for the future. A review of each gateway was undertaken to understand their function, output,
connectivity and input to the national and regional economy. Evidence and data gathering focused on
gathering detail based upon port statistics, air freight and passenger statistics, as well as anecdotal evidence
on port connectivity, opportunities and challenges.
In developing this evidence base, engagement with each airport (London Stansted, London Southend and
Norwich Airports) as well as the ports and representatives at a Ports Roundtable session or one-to-one
meetings held in February 2021 have been undertaken to obtain views on what ‘unlocking’ means to each
gateway. Information gained through these sessions has informed this report.
National significance of gateways
Nationally international gateways are of huge significance, responsible for the handling of all goods crossing
borders, 95% of which are via ports and 1% via the air. They are also integral to the facilitation of tourism,
transferring passengers into and out of the country, boosting the economy.
The UK port sector is one of the largest in Europe, handling 98% of the UK trade tonnage in 2018, connecting
people and markets, and a key driver in attracting inward investment. Ports support in excess of 101,000 jobs
and in 2015 directly contributed £7.6 billion in GVA to the economy (i.e. GVA directly attributed to ports).
Felixstowe alone carried £44.5 billion of imports in 2014, 20% of the UK total.
For airports, nationally, air freight carried £181 billion of imports and exports in 2017, and air freight services
directly contributed £7.2 billion to the economy (i.e. air freight services whether in airports or elsewhere).
Passengers travelling through airports bought £19.6 billion in benefits to the UK economy, with aviation sector
directly contributing £22 billion according to Oxford Economics in 2014, supporting 353,000 jobs directly.
Regional significance of gateways
The East of England is a key region for international trade, with ports located close to the main shipping lanes,
access to the largest concentration of offshore wind farms globally as well as access to offshore oil and gas,
as well as long-standing connections with London and the Midlands.
There are three international airports, five major ports, six regional ports and up to nine wharves across the
region, with strong trading links with the EU. The exports generated by these trading links particularly in Norfolk
and Suffolk are higher than average compared with the average for other regions. Despite this the region has
lower than average export value per job based upon smaller business headcount and lower value exports
dominated by agri-products.
The region has the largest share of employment in shipping in the England, directly supporting 6,300 jobs in
2015, with operations contributing £540 million in GVA. The East of England in 2018 had the third largest
number of exporters of goods and services, exporting the third highest value of services compared to all other
regions in the England, generated by professional services, finance and information communication. Import
value is generated by travel and professional services across the region.
Airports drive tourism, increasing the connectivity and attractiveness of the region. They also employ in excess
of 20,000 people directly, with a value added per worker of £56,000. Air freight handled through the airports
in the region contributes £8.1billion to the region, particularly supporting pharmaceuticals,
computer/electronics and transport equipment sectors.

                                                                                                                4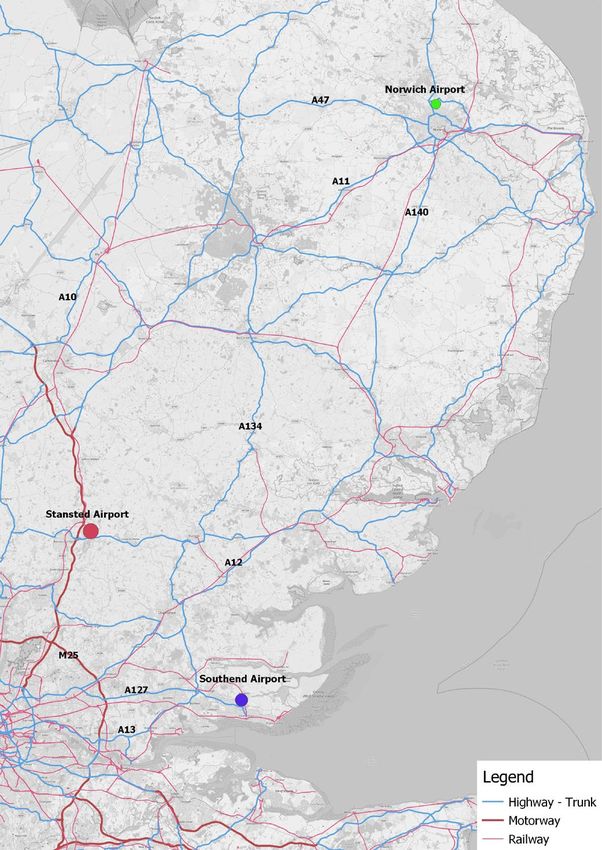
Unlocking International Gateways
Executive Summary
Port gateway reviews
There are twelve ports in the Transport East region, five of which are classed as major ports by the Department
for Transport. The tonnage handled at each of these major ports in 2019 is shown in the following table (in
millions of tonnes).
Table ES 1: major port freight tonnage in 2019 (in millions of tonnes)
Port Container freight Roll-on Roll-off freight Dry Bulk freight Liquid Bulk freight
(LoLo) (RoRo)
London Ports* 14.93 7.3 15.1 14.6
Felixstowe 21.74 3.58
Harwich 0.1 3.66 0.06 0.3
Ipswich 2.0 0.1
* It should be noted that for this analysis London ports of London Gateway, Tilbury, Purfleet and Dartford & Dagenham are
combined These ports combined are ranked as 17th in the EUs top 20 ports handling containers in 2018 and processes
an estimated 18% of the total tonnage handled at England’s ports.
The Port of London was Britain’s busiest port during pandemic handling 47.4m tonnes in 2020.
Each port has been reviewed for its operational capability, current freight handling and visions for growth:
London Gateway is the most globally connected port in the UK with connections to 66 countries and 130
ports globally. The port is the fastest growing deep-sea container port in the UK. It has a dedicated 775m
long rail terminal handling over 40 trains per week. The adjacent logistics park is a 9.25 million square foot
site ready for the development of warehouses and distribution facilities. It is currently over 30% contracted
with construction underway for customers like DHL.
London Gateway currently has three berths and is considering a fourth berth as a result of increasing
volumes. This would mean the port having a capacity of over 2 million TEU and in long term once fully built
over 3.5 million TEU.
Tilbury is the largest multipurpose port in the South East of England and the UK’s fastest growing port. It
acts as a national export hub with high-value industrial clusters in its vicinity. It is the only UK port with
facilities for deep-sea, European and short-sea shipping, with lifting capacity for various sectors. There is
an onsite rail terminal with three rail heads offering connections directly with London. The port handles
passenger movements with a dedicated cruise terminal, the closest to London utilised the River Thames
for passenger ferry and freight barging. Tilbury2 satellite port has recently been completed with a dedicated
aggregate depot, accommodation of RoRo freight, and access to the rail terminal.
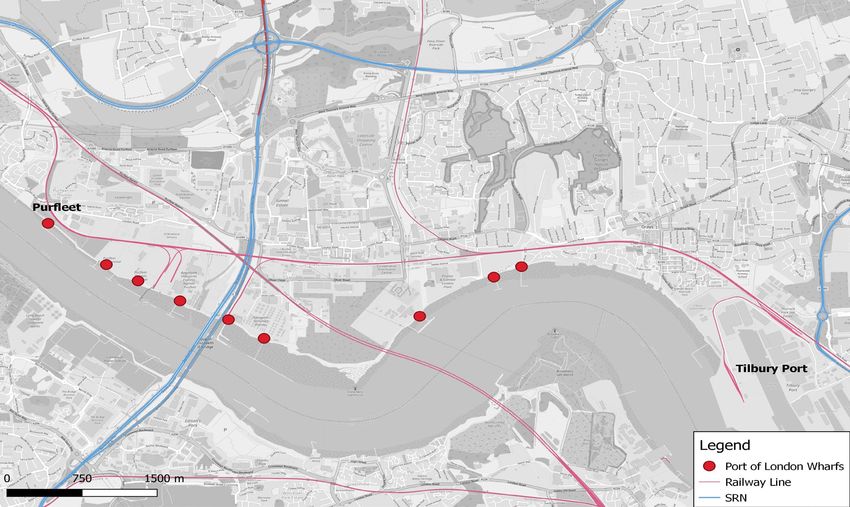
The Port of London Wharves in Thurrock between Purfleet and Tilbury handle a diverse array of cargoes,
supporting logistics and manufacturing. Containerised cargo is processed at Purfleet, with many other
wharves facilitating the delivery of aggregates and petroleum. Purfleet freight terminal is the closest RoRo
port to London handling lorry trailers, containers and automotive and commercial vehicles. There are four
railway sidings at the port connecting with the line to Tilbury.
Felixstowe is the largest and busiest container port in the UK, one of the largest in Europe (9th in top 20)
and ranked 32nd globally based upon cargo throughput. Felixstowe also includes an important ferry RoRo
operation. The port has benefitted from various expansion projects, developing the port to 9 deep-sea
berths. The port has advantage over other UK container terminals given vessels do not need to deviate far
from the main global and European shipping lanes to access the port. Felixstowe has the country’s largest
intermodal rail freight terminal, with 28% of UK container freight transported by rail, with future growth
intending to increase freight trains from the port. The port has an associated logistics park with direct access
to the port and the A14 strategic road route.
Harwich handles freight and passenger movements with the focus being the ferry service to the Hook of
Holland, split approximately 50/50 between accompanied and unaccompanied trailers, making it one of the
UK’s most important ferry terminals. The port has four berths with operational land and parking for in excess
of 1,000 trailers. The port has acted as the construction base for Gunfleet Sands, Great Gabbard and
5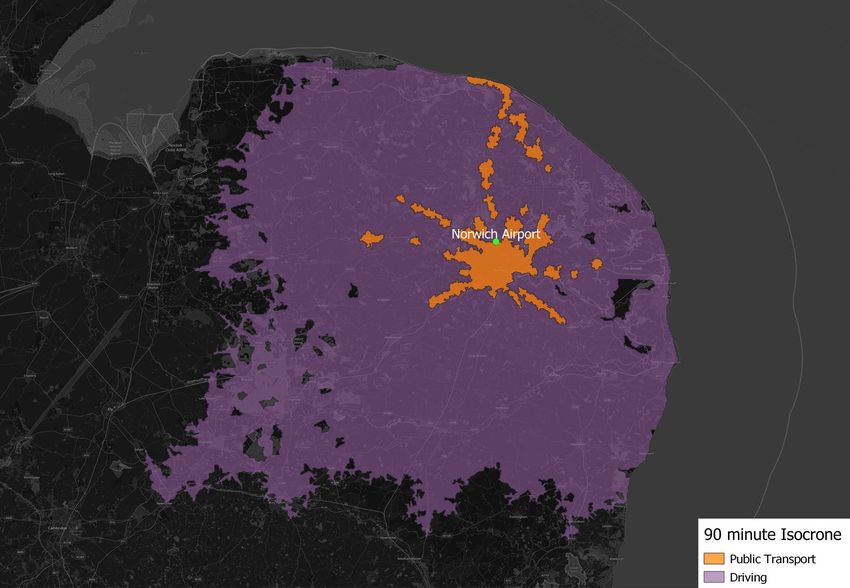
Unlocking International Gateways
Executive Summary
London Array offshore wind projects and has supported the mobilisation and demobilisation operations for
offshore oil and gas in the Southern North Sea. The port has unveiled plans to increase the depth of
Harwich Harbour, to accommodate larger freight and passenger vessels, with an intention to develop an
international freight terminal to accommodate future growth.
Ipswich is also an important regional Port in supporting the agriculture, construction, food sector and
industrial minerals. Expansion focuses on warehousing, storage and increasing the range of value added
services as well as support to NSIP projects such as for the Sizewell C proposal and helping to achieve
the government target of delivering 40GW of installed offshore wind capacity by 2030.
King’s Lynn is the preferred Norfolk port for forest products, Agri bulk, manufacturing and recyclable
sectors, with one dedicated and one agribulk common user silo complex. Future investment includes the
purchase of a further crane and additional equipment to optimise and further increase capacity.
Lowestoft has close links with the offshore energy sector, having the capability and skill to handle a wide
range of cargo. The port also handles dry bulk goods with storage and warehousing space. The port has a
masterplan to 2050 including development of quay space, new storage and infrastructure, and development
of facilities to support the renewables sector.
Great Yarmouth handles dry bulk cargo and automotive products, as well as serving the offshore energy
industry. The port has the shortest North Sea crossing between Great Britain and continental Europe. Land
is available for future expansion or the development of integrated port logistics/ storage.
Mistley port handles dry bulk goods, specialising in coastal and short sea shipping supporting the brewing,
farming and construction sectors. It has off-dock storage and silo storage. There are three hectares of land
to the east of the quay safeguarded for port expansion.
Brightlingsea is a mixed leisure and commercial port handling dry bulk grain, Agri bulk and livestock. It is
also well placed to support the development of the Gunfleet Sands wind farm.
Baltic Wharf port processes general cargo, forest and steel products, processing only inwards freight. The
port has storage facility and a dedicated timber treatment plant.
The nature of international freight
Freight is broken down by type based upon how it is transported, including lift-on-lift-off cargo (LoLo) (broadly
containerised goods), roll-on-roll-off cargo (RoRo) (accompanied and unaccompanied HGV freight), and bulk
goods. Collectively across all the major ports in the region, most cargo types are handled, showcasing the
range of skills and operations in the East of England.
Trade generally is forecast to continue to grow and so the continued expansion of capacity is essential, as
well as an opportunity to grow integrated port-side logistics. This will increase capability at the ports, increase
capacity and drive inwards investment to the region. Freeports tie into this with the potential to expand storage
and manufacturing, with a greater emphasis on port-side logistics. The East of England region is the only part
of the UK to have secured two of the eight Freeports awarded by HMG: Freeport East and Thames Freeport.
RoRo traffic through the region’s ports is mainly unaccompanied trailers (where the trailer is pulled on to the
ferry by a tug unit which then stays at the port). There is a clear trend nationally of growing market share of
unaccompanied RoRo with a fall in share of accompanied RoRo on the Dover Strait / Channel Tunnel. An
example of this is offshore wind materials which are often transported by RoRo and processed at regional
ports, as a result regional ports are potentially well placed for any prospect of future expansion of this important
and growing sector for the region and the UK.
Liquid bulk goods are dominated by petroleum products through terminals on the Thames Estuary.
Dry bulk is dominated by aggregates, steel, agricultural goods and forestry products. Inland transportation of
these goods is generally over shorter distances than container and RoRo, having a significant impact providing
materials for local and regional economies.
Each port handling dry bulk goods has a different focus in the region, with Tilbury having a dedicated aggregate
terminal, and handling 16% of the UKs forestry products, Mistley supporting the brewing industry with barley,
King’s Lynn the preferred Norfolk port for forestry products & Agri bulk, Lowestoft handling grain and cement,
and Brightlingsea handling Agri bulk and livestock.
The regional ports complement the larger ports, with the ability to handle smaller vessels that are less
economically viable for larger ports, they have fewer overheads allowing for competitive pricing. They are also
well located to serve their end users such as the agriculture sector or construction industry.
6
Unlocking International Gateways
Executive Summary

Across all dry bulk ports in the region, there is a strong reliance upon trade with the European Union, opening
them up to trade vulnerability. This vulnerability is also driven by a forecast short-term decline in dry bulk goods
to 2022. Dry bulk goods are also vulnerable to economic fluctuations, with strong links with major construction
and government investment.
Port passenger movements
Cruises operate from Tilbury and Harwich, with direct water ferry services transferring passengers/tourists to
the city. There is the opportunity to leverage waterways for passenger movements around the region to boost
tourism and reduce vehicle miles/hours.
Harwich port has the only international passenger ferry in the region, with a daily direct connection to the Hook
of Holland. This route is in the top five of international short sea routes in the UK. Domestic foot ferry services
for leisure and access to ports operate at Felixstowe/Harwich and Brightlingsea.
Access to ports
The reliability of the road network is essential for ports and freight movements, with most of the freight being
transported by road.
For major ports access to the strategic road network with the need to connect with key goods and
manufacturing hubs across the country. On the other hand, regional ports are more reliant upon the local road
network, with freight moving shorter distances.
One of the greatest constraints for freight on the road network is congestion, affecting journey time reliability
and route resiliency, with most routes having no viable alternative for HGVs during periods of serious
congestion such as road closures. This has a knock-on effect on the local road network which is often not
suitable for large volumes of diverted HGVs
Rail transport of freight plays a particularly important role for longer distance transport, particularly of
containers. For construction materials rail freight often operates over shorter distances, for example from
London wharves to terminals in Central London.
London Gateway, Tilbury, Purfleet, Felixstowe, and Ipswich ports have rail terminals, Harwich has a rail freight
terminal which is not currently operational.
Rail has the potential to remove HGVs from the road network, making it a serious option for accommodating
growth and supporting the national decarbonisation initiatives. Despite this most rail routes from ports in the
region are at or nearing capacity. There have been some improvements along these lines to increase capacity
in recent years, although additional improvements and electrification of these are much needed to improve
capacity and efficiency, most particularly from Felixstowe, and London Gateway.
Coastal shipping (i.e. movement between UK mainland ports) and inland waterways are viable, saving lorry
miles, but underused in the UK. The River Thames dominates inland waterway freight movements in the UK,
which is utilised by the ports of Tilbury, Purfleet and the Port of London Wharves.
Felixstowe and London Gateway have already established coastal shipping routes to the Tyne and Scotland.
Inland waterways movement of freight is likely to increase, with viable opportunities in the region, due to the
increasingly attractive environmental benefits and reduced restriction from congestion on the roads.
Airport gateway reviews
London Stansted Airport is the fastest growing airport in the UK and one of the top five growing in the European
Union. The airport has established expansion plans, including a new terminal building and cargo facilities.
London Southend Airport has been ranked London’s best airport every year since 2013, with established links
with Europe.
Norwich Airport has direct links with international airport hubs in Europe, drawing from a local catchment area,
using the airport as an alternative to accessing larger hub airports in the UK, and furthermore serves the North
Sea energy industry.

                                                                                                                 7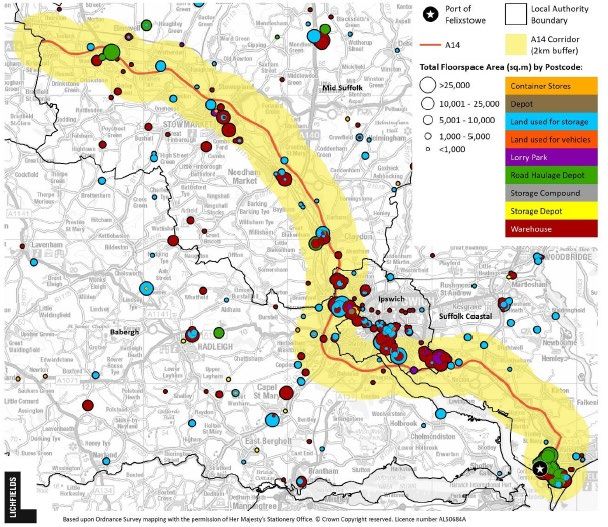
Unlocking International Gateways
Executive Summary

All these airports have been negatively affected due to the COVID-19 pandemic and mass grounding of
aircraft. This has likely had a short-term effect on expansion plans with uncertainty over timing of projected
growth estimates.
Air freight context
Despite the region handing over £8bn of air freight and with potential to expand (subject to the right conditions)
London Heathrow dominates air freight in the UK due to the vast array of destinations served by ‘belly hold’
services (i.e. on passenger services).
Regional airports still play an important role, particularly for transport of packages and mail by operators such
as DPD and UPS. The benefits of uncongested airspace and surrounding developable land make the region’s
airports potentially attractive.
London Stansted and Norwich airports both handle air freight, with London Stansted the third largest airport
in the UK for air freight tonnage handled, making it a significant component in the airports’ business operations.
Southend Airport does not handle freight, except small volumes from passenger aircraft belly hold, but does
have future capability.
Air freight generally handles expensive cargoes and is vulnerable to price fluctuations particularly with fuel
costs. There are expected changes in customs procedures and agreements to air services post-Brexit, leaving
the South East vulnerable to air freight reallocation to other regions of the UK.
Airport passenger movements
Passenger movement is the predominant focus for all airports in the East of England. All these airports are
experiencing growth year on year, with ambitions to continue growing into the future.
Each of these airports have a dominance of low-cost airlines, with a focus on short-haul services. The highest
proportion of passenger trips at all airports are to Western European – EU countries. Although, with the
dominance of EU destinations these airports could be left vulnerable post- Brexit, if there are changes in
passenger behaviours and destination choice. This could also be induced by the COVID-19 pandemic.
Stansted Airport would be well placed to capitalise on this change in passenger behaviours with the expansion
of long-haul operations, due to 50% of all UK searches for flight destinations in China, USA, Japan and India
originating within the Stansted catchment area. It is likely that this catchment would overlap with Southend
also offering expansion opportunities.
London Stansted and Southend airports both draw from a broadly London centric catchment, with London
Southend drawing a greater proportion of passengers from the East of England compared with Stansted and
Norwich Airports, drawing from its local catchment, and are often used as an international access or transit
hubs to larger international airport hubs in Western Europe, to access the rest of the world. This is as an
alternative to travelling to one of the UKs larger hub airports, offering more efficient journey time. Norwich
Airport also benefits from serving offshore oil rigs, although potentially vulnerable to oil decline. There are
opportunities to serve wind farm operations and access to hub connection which provides access to over 500
world wide destinations as well as a number of European leisure destinations
Access to airports
Catchment area for London Southend and Stansted Airports are predominantly from London and South East,
whilst Norwich Airport has a more local catchment within 60 minutes’ drive. Connectivity is reliant upon rail
line coverage and access to the strategic road network.
There are significant highway network pinch points and weaknesses identified for accesses to all airports.
While there are some schemes in development or complete these will need reviewing due to the projected
increasing passenger numbers. The rail network is broadly London centric, with limited coverage from airports
across the East region, connectivity east-west almost non-existent and limited heading north.
With this in mind, there is a need to improve the reliability and connectivity across the region, to support airport
demand, but also drive tourism within the region rather than passengers heading straight into London.
There is also an issue with staff accessibility for early morning shifts with no access to public transport during
the early hours and limited public transport connectivity within the locality of the airport throughout the day.

                                                                                                                 8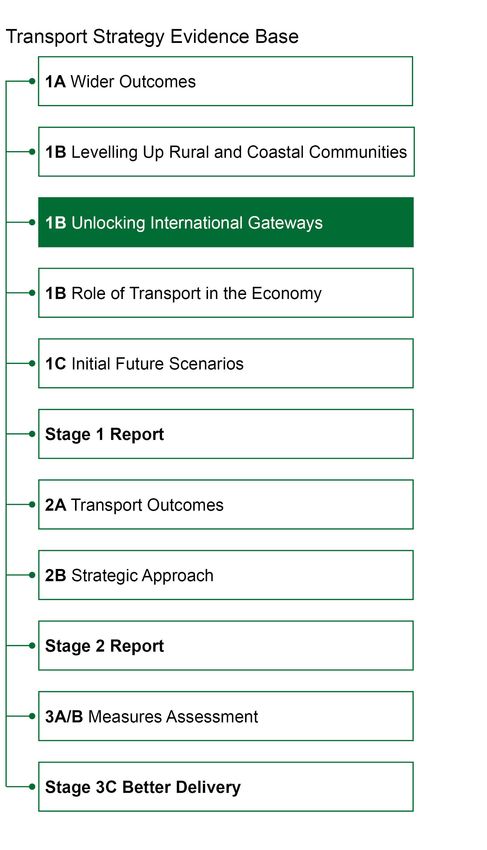
Unlocking International Gateways
Executive Summary
This connectivity needs to be improved to take pressure off the road network and drive the
decarbonisation agenda.
Opportunities and challenges for international gateways
Brexit will have a fundamental impact on how freight moves through international gateways, most notably
through more stringent customs checks. There are more complex interactions with supply chain and storage
which show fragility to any changes in freight movements.
This increases the importance of having resilient road routes and adequate rail freight capacity, as well as
providing an opportunity to develop logistics services closer to the ports.
Accompanied RoRo freight affected by border checks, long wait times, missed ferry slots and unreliability
of deliveries – potentially making unaccompanied freight less attractive in the UK
- Combined effects with COVID-19 and additional testing and isolation (as seen in Dover in 2020)
- Need for investment in facilities and HGV parking to provide for driver wellbeing
Uncertainty in the funding for major projects post-Brexit inducing vulnerability for dry bulk goods.
Passenger movements likely to be broadly unaffected following Brexit withdrawal deal in 2020 allowing
broadly visa free tourism between the UK and EU.
The COVID-19 pandemic has posed one of the most significant challenges to freight and passenger
movements in recent history with unknown long-term effects:
Dramatic decline in airport passenger movements with mass aircraft grounding, international border
closures and cruise cancellations
Backlog of container cargoes disrupting major shipping routes resulting in larger volumes, lack of storage
or container shortages
- Large volumes acting as a stress test for future growth.
The national decarbonisation agenda is a key consideration for ports and airports, with a progression towards
NetZero. Shipping has lower emissions than air freight, although the supply chain is reliant upon HGV road
movements. Strong emphasis needs to be put upon decarbonising the supply chain, with ports and airports in
the region leading the way.
Integrated port logistics could reduce vehicle road miles
Increase percentage of freight moved by rail could reduce road miles
Reducing the number of surface access movements made by road & decarbonise airport operations to
reduce the volume of emissions
Leveraging aircraft technology and utilising future fuels to reduce emissions.
Ensuring that ports are prepared to receive and possibly refuel battery or hydrogen powered HGVs
Recommendations to be taken forward to the next stage of Transport Strategy development
Increase rail capacity across the region, specifically for links between Felixstowe and the Midlands, and
London Gateway/Tilbury through London to the Midlands, to support forecast modal shift from road to rail
and future port growth.
Set standards for journey time, resilience, and diversionary routes for road and rail serving ports on a
corridor basis. Monitor achievement of these standards and plan investments and mitigations on the Major
Road Network, Strategic Road Network and Rail Network.
Improve capacity for rail services from Stansted to London and identify and support options to improve
connectivity by rail to airports from across the region;
Improve the availability of high-quality parking for trucks along port access routes.
Continued discussion with National Rail for the electrification of the rail line between Felixstowe and Ely
junction and the short connection to London Gateway.
Explore options for increased coastal shipping and use of the Thames to remove pressures on road and
rail caused by freight
Explore the improvement in inter-regional passenger connectivity of public transport to airports for example
East/West Rail provision. It is also important to ensure existing routes are strengthened for example the
9Unlocking International Gateways
Executive Summary
West Anglia Main Line improvements for example four track provision between Broxbourne and Tottenham
Hale enabling the extension of Crossrail 2 (if developed) to Stansted.
Support opportunities to develop land around ports for logistics, particularly for sites which are served
by rail.
Consider how ports are likely to grow in line with projections, the associated logistics, manufacturing
infrastructure and how this will impact upon the transport network.
Explore mode shift opportunities for both freight and passenger movements, reducing car/HGV reliance, in
line with national NetZero targets.
Continue to build on sustainable surface access improvements for Stansted
Explore opportunities with airport operators to decarbonise not only surface access to airports but also the
air side operations of the airports such as service vehicles. For example, London Stansted has a target to
achieve net zero carbon by no later than 2038 with a transition to a fleet of ultra-low emission vehicles by
2030.
With respect to airport travel planning and sustainable surface access the airports in the region all have
sustainable travel plans of note is London Stansted which has a current Airport Travel Plan1 with several
targets as follows:
- increase the number of companies signed up to the ATP to 90% by 2015;
- undertake employee travel surveys in 2015, 2017 and 2019;
- grow car sharing by 10% a year over the next 5 years; and
- increase the awareness to over 90% of Airport Travelcard and Car Share Schemes over the
- next 5 years.
It is important to continue for Local Authorities and Transport East at a high level to monitor the performance
of these travel plans and to build on and enhance the opportunities for sustainable mode access
1 https:/ / www.stanstedairport.com/ about-us/ development-plan/
10Unlocking International Gateways
Introduction
1 Introduction
1.1 Introduction to the Transport Strategy
Transport East has a vision of a thriving economy for the East, with fast, reliable and resilient transport
infrastructure driving forward a future of inclusive and sustainable growth for decades to come. Over the next
30 years Transport East wants to transform the region’s transport connections to help drive long term
economic growth.
The Transport East region is formed of three counties (Norfolk, Suffolk and Essex) and two unitary authorities
(Southend-on-Sea and Thurrock). Norfolk Suffolk and Essex have two tiers of local governance and each
county is divided into several districts and boroughs. Essex has the largest number of districts (12), followed
by Norfolk (7) and Suffolk (5). Southend-on-Sea and Thurrock are unitary authorities with single tiers of local
governance responsible for all local government functions within their administrative areas.
The development of the Transport Strategy to 2050 will comprise the following elements:
Stage 1 – understanding the role of transport and the potential for change
Stage 2 – developing an evidence driven strategic approach
Stage 3 – define a package of strategic measures and better ways to deliver
This will ultimately be accumulated into a single Transport Strategy for the Transport East Region to 2050.
1.2 Introduction to the Deep Dives
Transport East produced an evidence base in 2019 2 , and published the Transport East Decarbonisation
Report in November 2020 3 . There is a need to strengthen and complete this evidence base, to align with new
and emerging policies and the post COVID-19 context. Investors in the region (e.g. government, private sector)
will need to understand why future proposals will deliver the region’s unique outcomes, and to do this there is
a need to put forward a compelling case to seek the necessary funds to deliver the outcomes.
Transport East has highlighted three specific topics where more detail or deep dives (both generally and
specifically) are required. These are:
Our understanding of the role of transport in ‘levelling up’, particularly in re-energising our coast and
supporting rural communities
The role and opportunities for the transport system to support future economic growth, including COVID-19
recovery and longer-term economic goals
Unlocking the potential of our international gateways to support the national economy (including the shift
of freight from road to rail and other opportunities).
Each deep dive review sets out an evidenced baseline, identifying the opportunities and challenges, and the
case for transport investment. These not only review the Transport East area, but also neighbouring areas in
which policies, strategies or projects will impact on our area. These technical notes are supplemented with
short infographic summary collateral material, for use on Transport East’s website and in any future
presentations.
This Deep Dive topic will address the third topic of unlocking the potential of international gateways. The review
will explore the economic significance of the global gateways in the region, their current function, vision for
expansion, and challenges or opportunities for future growth.
This study used a two-tier approach to review gateway function, output, connectivity and input to the
regional/national economy:
2
WSP (20 19 ). Transport East – Regional Evidence Base. Available at: https:/ / www.transporteast.org.uk/ wp-content/ uploads/ Transport-East-
Regional-Evidence-Base-3 .pdf [accessed 2 February 20 21 ]
3 Transport East, 2 02 0 . Decarbonisation Evidence Base and Strategic Recommendations Report. Available at:
https:/ / www.transporteast.org.uk/ wp-content/ uploads/ Transport-East-Decarbonisation-Evidence-Base-and-Strategic-Recommendations-
Report_WEB.pdf [accessed 2 February 2 02 1 ]
11Unlocking International Gateways
Introduction
1 Evidence and Data Gathering: Focused on gathering detail based on port statistics, air freight and
passenger statistics, as well as anecdotal evidence on port connectivity, key corridors and impact of
Brexit/COVID-19.
2 Industry & Stakeholder Engagement: Detailed interviews with ports and airports, to understand industry’s
views on port, airport freight and passenger connectivity.
1.3 Wider Outcomes
As part of the development of its Transport Strategy, Transport East set out a series of wider outcomes that it
was looking to achieve through the delivery of its Transport Strategy. These wider outcomes will be used to
inform the ‘WHY’ of the transport strategy and aid in the testing of future transport scenarios. They will be used
to set clear agreed outcomes supporting the planning and implementation of a successful transport strategy.
The wider outcomes were derived through the collation of existing economic, social and environmental goals
and outcomes that partners have already set out in Local Plans, Local Industrial Strategies and other
documents. This exercise produced key words, phrases and challenges which enabled the creation of word
clouds to provide a visual representation of distilled themes. These initial themes were discussed with key
stakeholders through workshops. The following wider outcomes were agreed upon through an iterative
process where emerging outcomes were shared, reviewed and updated.
The shortlisted themes were then moulded into a clear and actionable list of intended outcomes for the
Transport Strategy:
Addressing the causes and impacts of climatic change (decarbonisation, net zero, zero emissions,
flooding, coastal erosion).
Protecting and enhancing the built and natural environment – ensuring the region retains and enhances
its varied and important landscape, heritage and biodiversity features.
Promoting and supporting a productive and diverse economy - highlighting the sub region’s role as a
place to work, do business and transport goods efficiently to drive up regional productivity contribute to the
wider UK economy (urban, rural and coastal centres, London, and International gateways).
Supporting the energy sector, in particular, offshore wind, renewables, nuclear, alternative fuels and
electrification.
Focussing on locally important growth areas (rural, urban, and coastal) ensuring they grow sustainably
and provide high quality, distinctive places to live, work and visit (heritage, culture, place, tourism, resilient
high streets).
Supporting skills retention and inclusion across the region with accessibility to education, training and
employment opportunities e.g. through ‘travel to learn’ facilities.
Promoting active, healthy and safe lifestyles (improved air quality, active travel and healthier populations).
Seeing digital connectivity as a key enabler supporting all outcomes.
More information regarding the methodology and evidence behind the wider outcomes can be found in the
Module 1a Wider Outcomes technical note.
1.4 Content of the Technical Note
The remainder of this Technical Note discusses the following sections in turn:
Section 2 – What is the significance of international gateways: focusing on the national and regional
contribution of ports and airports.
Section 3 – Ports: a breakdown of each port in the region, their function, operating capability, growth
potential and constraints, supported by a breakdown of freight and passenger movements. Accessibility of
ports in the region is explored, reviewing opportunities and constraints for road, rail and water movement.
Section 4 – Airports: a breakdown of each airport in the region, their function, operating capability, growth
potential and constraints, supported by a breakdown of passenger and freight movements. Accessibility of
airports in the region is explored, reviewing opportunities and constraints for road, rail and water movement.
Section 5 - Engaging with our Partners
Section 6 - Summary & Concluding comments and what does this mean for the Transport Strategy?
12Unlocking International Gateways
What is the significance of international gateways?
2 What is the significance of international gateways?
2.1 National Significance of International Gateways
International gateways have a huge national significance, with the UK relying upon them to handle all goods
which cross borders - 95% of annual tonnage handled by ports and 1% by air (40% of UK imports and exports
by value 4 ). With this reliance upon goods imports and exports, the connection of international gateways to the
rest of the UK is essential to ensure fast, reliable and seamless distribution of goods. As well as having an
importance for international trade, the Gateways also facilitate the tourism industry and business travel,
transporting passengers into and out of the country.
The UK freight industry has been identified as ‘one of the most efficient in the world, providing seamless
transportation of goods into, out of and across the country’ 5 . This in part is reflected in the value that the
industry contributes to the UK economy.
HM Revenue and Customs (2019) 6 stated that overall, in 2019 the overall value of UK trade in goods exports
and imports increased by 2.4% and 3.3% respectively compared to the previous year. Data from the DfT
showed that in 2019 the total value of goods exported from the UK amounted to £254.7 billion (73% from
England). Compared with the previous year there had been a decrease in the annual export value for all
regions of England, with the exception of the East of England, East Midlands, London and North East. 7
Figure 2.1: Value of goods exported by region of the UK, 2019 (% change on 2018)
4 https://logistics.org.uk/air
5 Better Delivery: The challenge for freight
6 HM Revenue and customs 2019
7 UK Trade in Numbers Pocketbook February 2021(publishing.service.gov.uk)
13Unlocking International Gateways
What is the significance of international gateways?
2.1.1 Ports
The UK port sector is one of the largest in Europe, handing 60 million international sea passenger journeys
and 500 million tonnes of freight 8 .. Major ports handled 98% of the total freight tonnage into the UK in 2018 9 ,
being key in connecting people and markets, and attracting inward investment and keeping the UK globally
competitive.
International freight tonnage has remained relatively stable across the past couple of decades, with an
exception in 2008 where tonnage dipped 10 . Since 2009 there has been a reduction in the volume of bulk
products (-15% bulk product, -27% liquid bulk), counterbalanced by an increase in containerised freight
(+32%) 11 . This is in tonnage terms. Because containers are increasingly used to carry relatively light weight
goods, Twenty-Foot Equivalent Units (TEU) for containers increased by 43%.
Container traffic is projected to increase by 32% (in TEU terms) by 2030 which is equivalent to an annual
increase of 2%. This is driven by an increase in imports from the Far East, and likely to increase once the
impact of Brexit is felt 12 . This growth is expected to remain dominant at the key ports of Felixstowe, London
and Southampton.
In 2015 the ports industry directly contributed £22.6 billion in business turnover, £7.6 billion in GVA and
supported 101,000 jobs. In the same year the industry contributed £1.5 billion in tax revenues to the economy
and is estimated to have exported £9.1 billion of goods and services.
With the combination of port activities with industry supply chains and induced effects on expenditures, CEBR
estimates that in 2015 the port industry helped to support a total of £23.8 billion of GVA, generating £2.15 in
GVA in the wider UK economy from every £1 of directly contributed GVA by the ports industry. 13
UK logistics sector has undergone rapid change with increased demand for online shopping and next day
delivery. Includes a move towards port centric logistics which represents an alternative to inland depots and
centrally located national distribution centres, allowing companies to streamline their supply chains and
reducing their impact on the environment.
2.1.2 Airports
Based upon 2012 data more than 197 million passengers and two million tonnes of freight travelled to, from
and within the UK via the air. There were more than 770,000 scheduled international flights departing the UK
to over 500 different airports in 131 countries, and over 420,000 domestic flights between UK airports. The
value of the benefit of these passengers from flying, in excess of their expenditure was worth £35.6 billion to
the UK economy. 14
Aviation contributes in excess of £22 billion directly to the UK economy (from air transport and aerospace
manufacturing) 15,with indirect and wage-financed contribution to the economy can be further broken down to
£16.7 billion and £12.9 billion respectively. 16 The sector directly supports 353,000 in manufacturing, aircraft
maintenance and air freight, with indirect support of 419,000 jobs in goods services and logistics, and a further
294,000 jobs through wages it pays employees. 17 Tourism contributes £106 billion to the national economy
and supports 2.6 million jobs, which is strongly supported by airport gateways 18.
8 https:/ / www.britishports.org.uk/ about-us/ the-uk-ports-industry
9 British Ports Association 2019
10 https://assets.publishing.service.gov.uk/government/uploads/system/uploads/attachment_data/file/908558/port -freight -statistics-
2019.pdf
11 Midlands Connect Freight & Trade (2020)
12 Maritime UK, n.d
13 CEBR Ports Report, 2017
14 https://www.aoa.org.uk/wp -content/uploads/2014/11/Economic -Benefits-from -Air-Transport-in-the-UK.pdf.pdf
15
https://assets.publishing.service.gov.uk/government/uploads/system/uploads/attachment_data/file/769696/aviation -2050 -print.pdf
16 https://www.aoa.org.uk/wp -content/uploads/2014/11/Economic -Benefits-from -Air-Transport-in-the-UK.pdf.pdf
17 https://www.iata.org/en/iata -repository/publications/economic -reports/united -kingdom-- value-of-aviation/
18 https://www.visitbritain.org/sites/default/files/vb -corporate/ Documents-Library/documents/England -
documents/ve_key_facts_and_trends_2019_csv.pdf
14Unlocking International Gateways
What is the significance of international gateways?
On top of this the economy benefits from passenger Air Passenger Duty tax which contributed £3,641 million
in 2019-20 (April-March), 0.1% increase on the year before 19 . There is an additional estimated £6.3 billion
generated by the aviation sector’s supply chain and £4.9 billion through taxation of activities supported by the
spending of employees from within aviation and the supply chain (wage-financed spending) 20
Air freight contributes significantly to the UK economy, with imports and exports in 2017 being worth
£181 billion, air freight services contributing £7.2 billion and the sector supporting 151,000 jobs 21 . Key
industries dependent upon air freight exports include pharmaceuticals, computer/electronics and creative arts/
entertainment, contributing £13.9 billion, £8.3 billion, and £5.3 billion in GVA respectively 22 .
Shippers pay airlines to transport high value weight products, generally within the belly hold of passenger
aircrafts. They pay airlines up to £3.1 billion annually to carry 2.3 million tonnes to freight, providing in excess
of £1.3 billion in benefit to the shipping companies. 23
The aviation manufacturing sector contributes significantly to the UK economy, making £9 billion in direct GVA,
£6.7 billion indirect and £4.1 billion induced contribution to UK GDP. These manufacturers support 327,000
jobs directly and indirectly, contributing almost £20 billion to UK GDP. 24
Figure 2.2: Value of air freight services to the UK economy 25
19
https://assets.publishing.service.gov.uk/government/uploads/system/uploads/attachment_data/file/881784/2020_Mar_APD_Commentar y.
pdf
20 https://www.aoa.org.uk/wp -content/uplo ads/2014/11/Economic -Benefits-from -Air-Transport-in-the-UK.pdf.pdf
21 Airlines UK, 2018
22
https://www.caasint.com/report -claims-uk-depends-more-on-air-freight -services-than-most-eu-competitors/
23 https://www.aoa.org.uk/wp -content/uploads/2014/11/Economic -Benefits-from -Air-Transport-in-the-UK.pdf.pdf
24 https://www.aoa.org.uk/wp -content/uploads/2014/11/Economic -Benefits-from -Air-Transport-in-the-UK.pdf.pdf
25 Airlines UK, 2018
15Unlocking International Gateways
What is the significance of international gateways?
Summary
UK relies upon ports for 95% of all goods crossing borders (tonnage) and 40% of all
goods (value)
Gateways facilitate trade and tourism – having significant impact on national economy
East of England one of four English regions to show year on year increase in annual
export value (2018)
UK port sector one of largest in Europe – handling 98% of UK freight tonnage (2018),
connects people & markets, and attracts inwards investment. Supported 101,000 jobs
and directly £7.6 billion in GVA (2015)
Passengers travelling through airports brought £35.6 billion in benefits to the UK
economy, with aviation as a whole directly contributing £22 billion, supporting 353,000
jobs, and tourism contributing £106 million to the economy, with 2.6 million jobs.
Air freight in 2017 contributed £181 billion through imports & exports and £7.2 billion in
air freight services
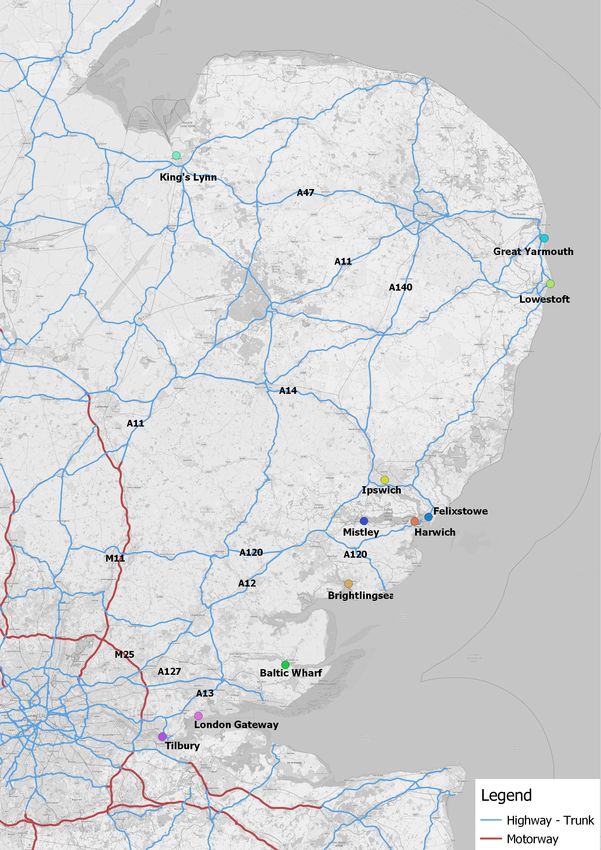
2.2 Regional Significance of International Gateways
The East is a key location for international trade, with ports located close to the main shipping lanes, close
access to offshore oil and wind farms, as well as historic connections with London and the ‘Golden Triangle’
in the Midlands Figure 2.3).
Figure 2.3: East of England map showing international gateways and access
16Unlocking International Gateways
What is the significance of international gateways?
The key international gateways identified in the Transport East region are:
Table 2.1: International gateways in the Transport East region
Major Ports Regional Ports Airports
Felixstowe King’s Lynn Stansted Airport
London Gateway Lowestoft Southend Airport
Tilbury / Tilbury2 Great Yarmouth Norwich Airport
Harwich Brightlingsea
Ipswich Mistley
Baltic Wharf/Wallasea
Port of London Wharves (North bank of River
Thames)
The region has strong trading links with the European
Union with 55.6% of Norfolk & Suffolk’s exports going
to the EU, higher than the national average of 42% 26 .
This exporting performance attracts increasing levels
of Foreign Direct Investment (FDI). When looking at
Norfolk and Suffolk’s total number of jobs created and
safeguarded by FDI projects, the New Anglia LEP was
the 5th most successful out of 38 in the county.
Despite the region operating on a global platform of
imports and exports, Norfolk and Suffolk have
comparatively low export value per job compared with
other Local Enterprise Partnership areas, with the
overall export per job figure 46% of the LEP average
(£4,300 compared with £9,200 LEP average), ranking
New Anglia 30th out of 38 27 . The most likely reason for
this is that exporting firms from Norfolk and Suffolk are
small in employment terms though global in their
operations, as well as a higher share in lower value
exports compared with other LEPs, with the export of
advanced Agri bulk, and dominance of the food and
drink sector.
2.2.1 Ports
The Transport East region is home to five key freight
handling ports, which each handle in excess of two
million tonnes of freight annually (Figure 2.4). 28 It is
also particularly driven by high quantities of inwards
freight, key to keeping the UK economy running.
Figure 2.4: Freight handling ports handling in
excess of 2 million tonnes, 2016
26 https:/ / newanglia.co.uk/ wp-content/ uploads/ 2 02 0/ 0 3/ 20 17 -1 2-0 5-FINAL-Economic-Evidence-Report-single-pages-HighRes.pdf
27 https:/ / newanglia.co.uk/ wp-content/ uploads/ 2 02 0/ 0 3/ 20 17 -1 2-0 5-FINAL-Economic-Evidence-Report-single-pages-HighRes.pdf
28 DfT Port Freight Statistics 2 01 6
17You can also read