Australian Transport Assessment and Planning Guidelines - August 2021
←
→
Page content transcription
If your browser does not render page correctly, please read the page content below
Australian Transport Assessment and
Planning Guidelines

August 2021
© Commonwealth of Australia 2021
ISBN 978-1-922521-38-5
August 2021
The contributions of the following people in the development of this report are acknowledged:
   SMEC: Steven Piotrowski, Richard Isted and sub-consultant David Kriger Consultants Inc.
   ATAP project team: Kieron Dauth, David Mitchell, Wes Soet, Peter Tisato
   Reviewers of drafts
   Members of the ATAP Steering Committee: Mark Harvey, Andreas Bleich, Belinda Sachse and Paula Stagg
   (Australian Government), Atiqur Rahman, Paul Stanley and David Tucker (Infrastructure Australia), Alban Pinz
   (QLD), Robert Smith and Matthew Jones (NSW), Justinieta Balberona (ACT), Ed McGeehan (VIC), Arun Kendall
   (TAS), Scott Cooper and Aaron Bell (SA), Des Lock (WA), Brett Clifford (NT), Sandy Fong (NZ), Richard Delplace
   (Austroads), Peter Tisato (Technical Coordinator).

Ownership of intellectual property rights in this publication
Unless otherwise noted, copyright (and any other intellectual property rights, if any) in this publication is owned by the
Commonwealth of Australia (referred to below as the Commonwealth).

Disclaimer
The material contained in this publication is made available on the understanding that the Commonwealth is not
providing professional advice, and that users exercise their own skill and care with respect to its use, and seek
independent advice if necessary.
The Commonwealth makes no representations or warranties as to the contents or accuracy of the information contained
in this publication. To the extent permitted by law, the Commonwealth disclaims liability to any person or organisation in
respect of anything done, or omitted to be done, in reliance upon information contained in this publication.

Creative Commons licence
With the exception of (a) the Coat of Arms; (b) the Department of Infrastructure, Transport, Regional Development and
Communications photos and graphics; and (c) [OTHER], copyright in this publication is licensed under a Creative
Commons Attribution 4.0 Australia Licence.
Creative Commons Attribution 4.0 Australia Licence is a standard form licence agreement that allows you to copy,
communicate and adapt this publication provided that you attribute the work to the Commonwealth and abide by the
other licence terms.
Further information on the licence terms is available from https://creativecommons.org/licenses/by/4.0/
This publication should be attributed in the following way: © Commonwealth of Australia 2020

Use of the Coat of Arms
The Department of the Prime Minister and Cabinet sets the terms under which the Coat of Arms is used. Please refer to
the Commonwealth Coat of Arms - Information and Guidelines publication available at http://www.pmc.gov.au.

Contact us
This publication was prepared by the Australian Transport Assessment and Planning (ATAP) Steering Committee and
approved by the Transport and Infrastructure Senior Officials' Committee. The Committees cannot accept responsibility
for any consequences arising from the use of this information. Readers should rely on their own skill and judgment when
applying any information or analysis to particular issues or circumstances.
This publication is available in PDF format. All other rights are reserved, including in relation to any Departmental logos
or trade marks which may exist. For enquiries regarding the licence and any use of this publication, please contact:
ATAP Steering Committee Secretariat
Australian Transport Assessment and Planning Guidelines
Department of Infrastructure, Transport, Regional Development and Communications
GPO Box 594
Canberra ACT 2601
Australia
Email: atap@infrastructure.gov.au
Website: atap.gov.au
T9 Urban freight demand modelling

Contents
At a glance ...................................................................................................................................................1

1. Introduction ...........................................................................................................................................2
     1.1      Links to other parts of the Guidelines ............................................................................................2
     1.2      Structure of this guidance..............................................................................................................2

2. Urban freight modelling overview ......................................................................................................4
     2.1      The need for urban freight modelling ............................................................................................4
     2.2      Urban freight components .............................................................................................................4
     2.3      Model types currently used in Australia ........................................................................................6
              2.3.1       Trip-based models ............................................................................................................6
              2.3.2       Modelling intrastate, interstate and international components .........................................7
              2.3.3       Current Australian urban freight models ...........................................................................7
              2.3.4       Issues and Opportunities ..................................................................................................8
     2.4      Overseas practice ...................................................................................................................... 10

3. Practical guidance ............................................................................................................................. 11
     3.1      Existing practice ......................................................................................................................... 11
     3.2      Context and principles for best practice ..................................................................................... 12
     3.3      Key assumptions ........................................................................................................................ 13
              3.3.1       Trip-based models ......................................................................................................... 13
              3.3.2       Commodity flow ............................................................................................................. 19
              3.3.3       Tour-based ..................................................................................................................... 24
     3.4      Data requirements for describing CV activity ............................................................................. 26
     3.5      Choosing the right type of model ............................................................................................... 28
              3.5.1       Decision process and factors for model selection ......................................................... 28
              3.5.2       Fitting the application to the need .................................................................................. 30
              3.5.3       Limitations ...................................................................................................................... 32
     3.6      Model Calibration and Validation Criteria ................................................................................... 32
     3.7      Light Commercial Vehicle Models .............................................................................................. 33
              3.7.1       Defining LCVs ................................................................................................................ 33

4. Emerging approaches and future directions .................................................................................. 34
     4.1      Supply chain (logistics) models .................................................................................................. 34
     4.2      Emerging model types ................................................................................................................ 34
              4.2.1       Agent-based freight modelling ....................................................................................... 34
              4.2.2       Changing purchasing and delivery practices ................................................................. 35
     4.3      Steps to maintain and improve urban freight modelling in Australia .......................................... 36

Appendix A                Model type detail .......................................................................................................... 38
     A.1      Trip based models ...................................................................................................................... 38
     A.2      Tour based models ..................................................................................................................... 40

Infrastructure and Transport Ministers | Australian Transport Assessment and Planning Guidelines                                                                   i
T9 Urban freight demand modelling
A.3 Data describing CV characteristics ............................................................................................ 42
A.4 Supply chain (logistics) models .................................................................................................. 44
A.5 Agent-based models .................................................................................................................. 47
Appendix B Glossary ........................................................................................................................ 49
Appendix C National freight models ............................................................................................... 52
Appendix D Overseas practice ........................................................................................................ 53
Appendix E Austroads Vehicle Classification ............................................................................... 56
References ............................................................................................................................................... 57
Figures
Figure 2-1: Urban freight movement components ........................................................................................6
Figure 3-1: Structure of trip-based model .................................................................................................. 14
Figure 3-2: Structure of commodity flow model ......................................................................................... 21
Figure 3-3: Components of a tour .............................................................................................................. 24
Figure 3-4: Structure of truck tour-based model ........................................................................................ 25
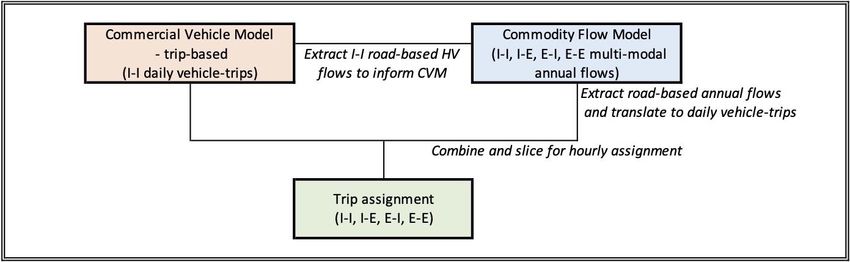
Figure 4-1. Trip-based urban freight model / commodity flow model (conceptualisation) ......................... 36
Figure 4-2. Tour-based urban freight model / supply chain model (conceptualisation) ............................ 37
Figure 4-3. Tour-based urban freight model with extensions for changing practices / supply chain
model, both with agent-based formulations (conceptualisation) ............................................. 37
Figure 4-4: Steps in developing the tour .................................................................................................... 41
Figure 4-5: Behaviour supply chain modelling process ............................................................................. 45
Figure 4-6: Supply chain for consumer goods – example using FAF ....................................................... 47
Tables
Table 2-1: Applications where urban freight modelling is required ..............................................................5
Table 2-2: Existing urban freight models in major Australian cities plus Auckland NZ ................................7
Table 2-3: Freight modelling issues and opportunities .................................................................................9
Table 3-1: Structured decision process for selecting most appropriate model form ................................. 28
Table 3-2: Comparison of modelling approaches by characteristics ......................................................... 30
Table 3-3: Recommended calibration and validation criteria for urban freight modelling ......................... 32
Table 4-1: Summary of key strengths and weaknesses by survey type ................................................... 43
Table 4-2: Key terminology ........................................................................................................................ 49
Table 4-3: International examples of urban freight models ....................................................................... 53
Infrastructure and Transport Ministers | Australian Transport Assessment and Planning Guidelines ii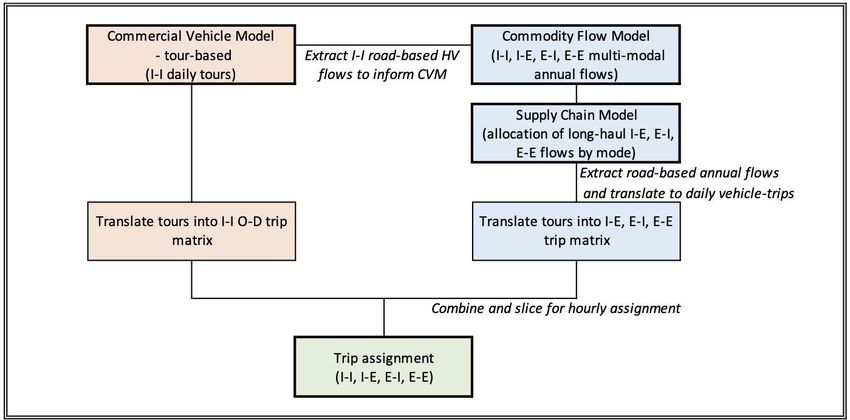
T9 Urban freight demand modelling
At a glance
This Part of the Guidelines provides guidance on urban freight demand modelling for use in transport
planning and the appraisal of major transport initiatives in Australia. The guidance is not intended to be
comprehensive, but rather represent a minimum level of recommended acceptable practice. It
complements Part T1 of the Guidelines which considers demand modelling of person-based travel.
Urban freight is an important factor in how cities work, providing the ability for the urban economy to
function, and plays a key role in the justification of many urban initiatives.
Urban freight refers to the movement of all types of goods and commercial services to, from, within and
through an urban area. Urban freight consists of:
– Intra-urban trips: undertaken entirely within a specified urban area
– Plus the first or last leg or the through component (all undertaken within the urban area) of the
following freight trips: Intrastate trips: entirely within a specified state or territory; Interstate trips:
between one Australian state or territory and another; and International trips: between one
Australian state or territory and a different country.
The primary type of urban freight model used in Australia is the trip-based model — also called a truck-
trip model, or commercial vehicles model. It is an application of the 4-step model approach that is
commonly used in urban passenger demand modelling (see ATAP T1). It typically uses 3 steps: trip
generation, trip distribution and trip assignment (mode choice is not typically required).
For intrastate, interstate and international freight movements, the majority of the movement is typically
outside the urban area of interest. In urban freight models, they enter the model at the boundary of the
urban area. There have been two ways in which these movements have been modelled:
– Commodity flow models (or freight flow models)
– Growth factor models.
Most Australian jurisdictions are likely to continue to use trip-based and commodity-flow models as their
main urban freight modelling tools.
An important newer model type is the tour-based model, which replicates the itinerary, or sequence of
stops, made by a commercial vehicle in its daily rounds. A tour typically begins and ends at the vehicle’s
garage or depot. A tour consists of multiple trips, each of which corresponds to the movement of the
vehicle from one stop to the next.
Data availability, data age, and the cost of data collection are significant issues for maintaining and
improving the quality of urban freight models. The type of freight model in use is highly influenced by the
availability (or lack thereof) of suitable data. Collecting freight data is notoriously difficult, often due from
private sector freight operators is the commercial sensitivity of the data owned by private freight
operators.
When deciding on the most appropriate form of freight model for an urban area, a range of factors
should be considered. These include: model purpose; city size; availability of data; financial resources
available; timeframe; and availability of skilled resources to build and operate the model.
The US Federal Highway Administration publish freight trip generation rates and trip distribution
coefficients for use in cities that have no access to trip generation data. Consideration could be given to
developing such an approach in Australia.
Infrastructure and Transport Ministers | Australian Transport Assessment and Planning Guidelines 1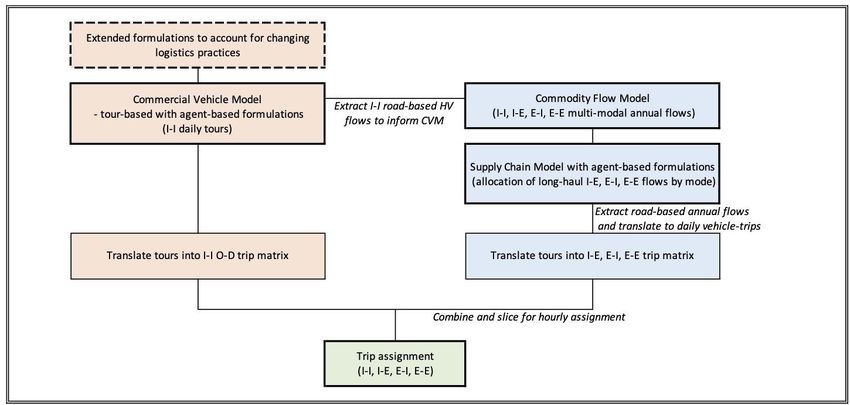
T9 Urban freight demand modelling
1. Introduction
This document provides guidance on urban freight demand modelling.
Urban freight is an important factor in how cities work, providing the ability for the urban economy to function.
Not only are unit urban freight time cost reduction benefits higher than for the average urban vehicle, but
across some parts of urban networks, freight accounts for a significant proportion of total traffic. Urban freight
therefore plays a key role in the justification of many urban initiatives.
The BITRE (2019, 2021) reports that:
Total freight activity in Australia has been forecast to grow by approximately 25% between 2018 and
2040
Growth in road freight has been forecast to be much higher, 56%
Road freight in capital cities and major provincial urban centres account for 30-40% of total road freight
kilometres
Capital city road freight in Australia is projected to grow by around 62 per cent between 2018 and 2040,
from around 47.3 billion tkm in 2018 to around 76.7 billion tonne kilometres by 2040.
The modelling and assessment of urban freight demand is therefore already important and will continue to
grow in importance over time. In this context, these urban freight demand modelling guidelines provide the
basis for consistent best practice assessment across the country.
This guidance for applying urban freight (urban goods/city logistics) models considers: a number of relevant
factors such as transport system objectives, policy objectives, scope of application, data availability, model
structure and functionalities and model transferability. The guidance is not intended to be comprehensive or
recommend a singular best approach. Rather, it represents a minimum level of recommended acceptable
practice for each level of model complexity (model type) based on relevant factors. It provides a sound
foundation for further development of the guidance in future.
In this guidance, the term urban is interpreted to mean the metropolitan areas that are represented in
Australian transport models.
1.1 Links to other parts of the Guidelines
This guidance complements the other ATAP guidance on demand modelling, Part T1 Travel demand
modelling which focuses on modelling person-based travel demand across road and public transport
networks.
Used together, these two parts provide the basis for demand modelling of both passenger and freight
movements in metropolitan areas.
1.2 Structure of this guidance
Chapter 2 provides a high level overview, considers the need for urban freight modelling and lists models
used in Australia.
Infrastructure and Transport Ministers | Australian Transport Assessment and Planning Guidelines 2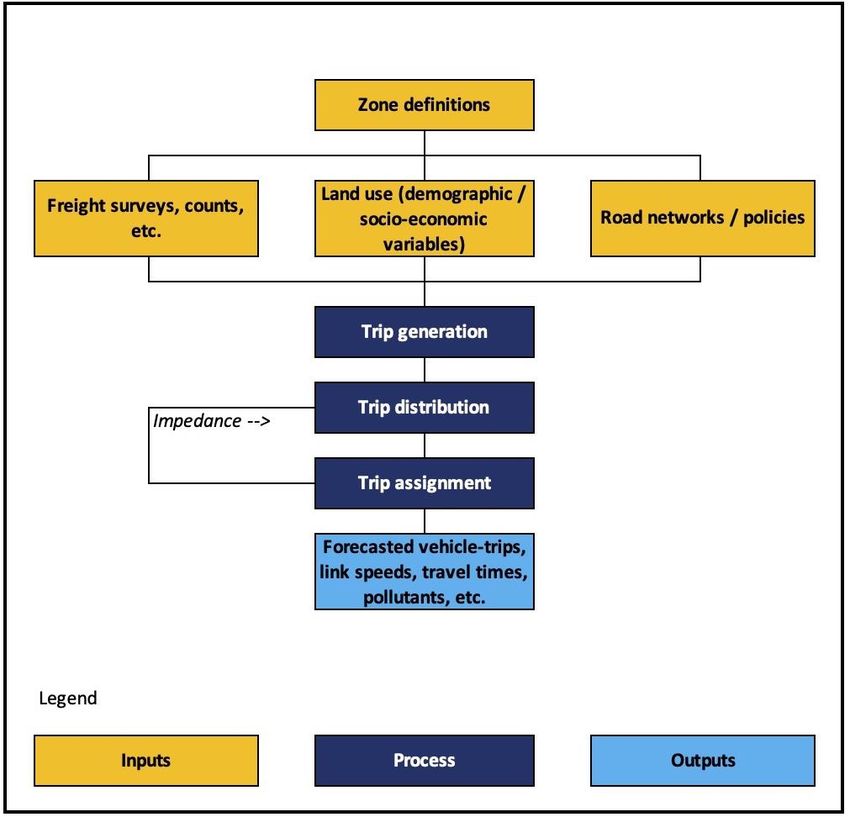
T9 Urban freight demand modelling

Chapter 3 is intended to provide practical guidance to practitioners on the different types of Commercial
Vehicle (CV) models that may be used in an urban context.

Chapter 4 discusses new and emerging model types which are not practical for implementation in Australia
today but may become more practical in the future. This includes supply chain (logistics) models (section
4.1), agent-based models (section 4.2.1), and changing delivery and purchasing practices (section 4.2.2).
Section 4.3 outlines some ideas for steps required to maintain and improve urban freight modelling in
Australia.

Lastly, three appendices accompany the guidelines.

Appendix A provides further technical details on the model types described in these guidelines.

Appendix B provides a glossary of terminology and definitions that users of these guidelines will find useful.

Appendix C briefly summarises national freight models, given that they provide some of the inputs to urban
freight models.

Appendix D provides more detailed discussion of overseas practice (in support of section 2.4).

Appendix E shows the Australian vehicle classification.

Infrastructure and Transport Ministers | Australian Transport Assessment and Planning Guidelines            3
T9 Urban freight demand modelling
2. Urban freight modelling overview
2.1 The need for urban freight modelling
The modelling of urban freight is an important input and requirement for a range of planning and assessment
situations. Urban freight modelling facilitates:
An understanding of the scale of urban freight, and its geographical and temporal features
Estimation of the impact of a range of policy measures and projects on urban freight
Estimation of the economic, social and environmental impacts of urban freight.
Table 2-1 summarises the wide range of applications where urban freight modelling can be used. Several
observations can be made:
The applications are a mix of considerations: short-term and long-term, traffic operations, land use and
infrastructure planning, investment plans and priorities, funding applications, policy issues and more.
This is a much wider focus than the traditional use of such models to identify future capacity deficiencies.
Many applications have a national and international perspective. Urban freight models thus represent
one component of this broader analytical need. They serve to analyse the impacts of locally-generated
flows on the broader multi-modal transport network and, in reverse, the impacts on the local road
networks of long-haul freight traffic entering or leaving the urban area via ports, terminals and airports.
Urban freight models are not intended as micro-scale tools (e.g. microsimulation traffic modelling) in their
own right. However, they can inform micro-scale analyses, e.g. traffic operations and site access design.
Needs are evolving, with the rapid evolution in logistics – notably, the rapid growth in e-commerce
purchases by individual households and businesses has changed delivery patterns in significant ways.
2.2 Urban freight components
Urban freight refers to the movement of all types of goods and commercial services to, from, within and
through an urban area. It is helpful to categorise urban freight into the following components:
Intra-urban: Freight movements made by commercial vehicles entirely within a specified urban area
Intrastate: Intrastate freight movements are made by commercial vehicles, rail, marine or air entirely
within a specified state or territory. This guideline considers the urban leg, e.g. the last-kilometre delivery
of a container that arrived in the urban area by transcontinental rail
Interstate: Interstate freight movements are made by commercial vehicles, rail, marine or air between
one Australian state or territory and another. This guideline considers the urban leg, e.g. the last-
kilometre delivery of a container that arrived in the urban area by transcontinental rail
International: International freight movements are made by marine or air between one Australian state or
territory and different countries. This guideline considers the urban leg, e.g. the last-kilometre delivery of
a container that arrived in the urban area through a marine port.
Note that whilst this report focuses on the urban component, because of the nature of much of commercial
vehicle travel in Australia there is often a need to consider the interactions with regional freight movement –
i.e., freight activity generated outside the urban / metropolitan area that starts, ends or passes through the
area. These externally based trips are described in the ensuing discussion.
Infrastructure and Transport Ministers | Australian Transport Assessment and Planning Guidelines 4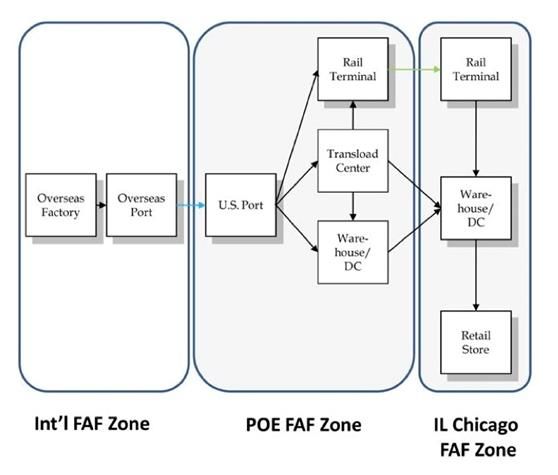
T9 Urban freight demand modelling

Table 2-1: Applications where urban freight modelling is required

    Application                Description

    Business cases             Business cases play a central role in funding submissions at National, State, Federal and
                               Local levels of government. Robust modelling of people and freight movements is a key
                               requirement of a good transport business case.

    Transport, economic        The identification of nationally significant corridors requires an understanding of how long-
    development and            haul freight (and other traffic) could be served by other modes. Also, forecasts of long-haul
    trade policies             freight traffic can inform local, state and national economic development and trade policies.

    Infrastructure             Freight vehicle forecasts are required in network planning to identify future deficiencies and
    Improvements               other problems, and in options assessment to determine the merits of alternative
                               improvement options.

    Toll roads and             Vehicles can be priced to pay for the cost of new infrastructure (e.g. a toll road), or to manage
    mobility pricing           traffic (e.g. cordon pricing). In the former case, typically commercial vehicles are a relatively
                               small component of traffic but have a much bigger impact in terms of revenues, infrastructure
                               rehabilitation, operations and maintenance costs. The success of a toll road forecast is
                               partially dependent on the ability to properly model and assess the willingness to pay of
                               commercial vehicle users.
                               In the case of traffic management schemes, potential future policy measures such as heavy
                               vehicle charging schemes rely on being able to properly model and assess the impact that
                               such a measure has on commercial vehicle generation, distribution, mode choice and
                               assignment. Such policies can also help manage traffic flow at access roads and access
                               points to intermodal terminals, spreading traffic to less congested times of day, avoiding
                               certain routes and even shifting modes.

    Asset management           Estimates of freight traffic are needed to inform pavement and structure rehabilitation cycles.
                               These estimates also could inform the allocation of road user charges for heavy vehicles.

    Development                Estimates of freight traffic generated by proposed land developments impact the design of
    approvals / land use       site accesses, on-site circulation, loading and parking.
    planning

    Planning for               Freight vehicles typically comprise an important and even dominant component of the traffic
    intermodal hubs and        along accesses to marine ports, airports, intermodal rail terminals and major freight-
    freight generators         generating land uses.

    Traffic operations         Estimates of freight vehicle movements are required for micro-scale analyses of traffic
                               operations at intersections and along corridors.

    Safety                     The presence of larger freight vehicles creates a higher severity potential on the road
                               network, particularly for vulnerable road users. The forecasted number of freight movements
                               is therefore often an input into a road safety assessment / road safety audit. The desire to
                               protect vulnerable road users from large freight vehicles is often the foremost motivator
                               behind the introduction of the Complete Streets transport policy and design approach.1

    City logistics             Rapid and pervasive improvements in communications and computing technologies have
                               allowed households and businesses the ability to purchase goods anywhere and anytime,
                               avoiding the need for in-person shopping and generating new delivery patterns and
                               frequencies at urban locations and all times of the day.
                               The emergence of new technologies, such as self-driving vehicles and electric vehicles, and
                               the promotion of carbon-neutral vehicles could have profound impacts on urban freight.

    Environmental and          Freight movements are a significant contributor to environmental and noise emissions. Freight
    Noise Emissions            modelling enables estimation of these impacts for Environmental Impact Assessments (EIA).

    Climate resilience         Plans for climate adaptation and mitigation will require an understanding of freight flows.

1
    ‘Complete streets’ is a transport policy and planning where streets are planned, designed and operated for the safety, access and
     needs of all people (American Planning Association 2010).

Infrastructure and Transport Ministers | Australian Transport Assessment and Planning Guidelines                                        5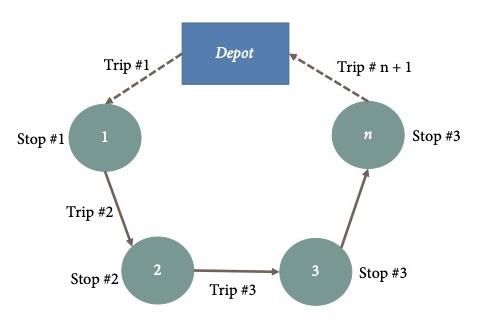
T9 Urban freight demand modelling
Figure 2-1 shows the four urban freight components in a stylised manner. An urban freight model considers
all of these components. Intrastate, interstate and international freight movements each contain two further
categories: to and from the urban area; passing through the urban area.
Figure 2-1: Urban freight movement components
2.3 Model types currently used in Australia
2.3.1 Trip-based models
The primary model used in Australia is the trip-based model — also called a truck-trip model, or commercial
vehicles model. It is an application of the 4-step model approach that is commonly used in urban passenger
demand modelling (see ATAP T1). For this type of modelling, the urban area is first divided up into
geographical zones that are treated as both origin and destination zones for the modelling. A 4-step model
has four sequential steps:
Trip generation: Estimation of the number of trips generated from each zone
Trip distribution: Estimation of how trips originating in each zone are distributed to destination zones
At the end of the trip distribution step, the output is a trip matrix for one or more time periods, showing
the number of trips between each origin-destination pair.
Mode choice: Determination of mode selection. With nearly all urban freight carried on road, the mode
choice step is typically not required in urban freight modelling.
Trip assignment: Assignment of trips to a designated road network.
Infrastructure and Transport Ministers | Australian Transport Assessment and Planning Guidelines 6T9 Urban freight demand modelling
2.3.2 Modelling intrastate, interstate and international components
For intrastate, interstate and international freight movements, the majority of the movement is typically
outside the urban area of interest. In urban freight models, they enter the model at the boundary of the urban
area. There have been two ways in which these movements have been modelled:
Commodity Flow Models and Freight Flow Models: A commodity flow model, a formulation commonly
used in Australia, models the movement of goods or commodities across a state or across the country
by various long-haul modes. From this, flows to, from and through urban areas are extracted. The flows
are derived from forecasts of economic activity and are typically expressed as annual or monthly flows.
These estimated commodity movements are subsequently converted into estimates of the number of
daily commercial vehicle-trips required to transport these commodities within the urban area.
These flows can involve the movement of goods into and out of the urban area via intermodal terminals
(airports, marine ports and rail terminals), which are then distributed to or collected from multiple sources
within the urban area by commercial vehicle. Some long-haul flows can be moved entirely by commercial
vehicle, moving between an external location and one or more locations within the urban area.
Commodity flow models are not typically deployed solely within urban geographies.
Growth factor models: In earlier models, truck movements crossing the urban boundary were measured
in a base year. Boundary surveys allowed information to be gathered on origins and destinations,
allowing trip distribution to be undertaken. For future model years, growth rates were applied based on
information about state, territory, national and international economic and demographic projections.
2.3.3 Current Australian urban freight models
Each of the capital cities in Australia either has an existing urban freight demand model or is planning to
develop one in the near future. As mentioned above, the two model types used are: truck or commercial
vehicle (CV) trip-based models; plus commodity flow and freight flow models.
Table 2-2 highlights the models currently used in Australian cities, plus in Auckland, New Zealand (NZ).
The outputs from a national freight model may form part of the input to an urban freight model. Appendix C
introduces national freight models.
Table 2-2: Existing urban freight models in major Australian cities plus Auckland NZ
City /
Type of model Description
location
Sydney Commodity Flow As part of the STM, there are several freight models; for heavy vehicles a
and Trip-Based commodity-based flow model is utilized to determine distribution of trucks, whilst
truck trip models are used for light commercial vehicles. The key models in this
suite were updated in 2017 based upon the 2014 ABS survey data, heavy vehicle
traffic counts and other information provided by relevant stakeholders (ABS 2015).
Further development work for light commercial vehicles (LCVs) was undertaken in
March 2020. The models estimate LCVs, heavy commercial vehicles (HCVs, i.e.
rigids and articulated).
Brisbane Commodity Flow The Queensland Freight Model (QFM) is a commodity flow model that extends into
urban areas, but it is fundamentally a state-wide model with a more inter-regional
focus.
Infrastructure and Transport Ministers | Australian Transport Assessment and Planning Guidelines 7T9 Urban freight demand modelling
City /
Type of model Description
location
Melbourne Commodity Flow The Freight Movement Model (FMM) was developed around 2008 and a light touch
recalibration was done in 2016 against the Freight Movement Survey data of 2014.
The model models Rigid and articulated HCVs, whilst B-doubles and HPFVs are
modelled as part of a separate port module. The whole model is incorporated into
the Victorian Integrated Transport Model (VITM).
Adelaide Trip-Based The MASTEM model has a trip-based commercial vehicle sub-model. A minor
update to this model last occurred in 2009/2010 period, but the survey data used to
build the model is very old (more than 20 years).
Perth Trip-Based and The ROM24 model utilizes a version of the FMM developed for Melbourne but
Commodity Flow modified for Perth conditions based upon data from the ABS Freight Movement
Survey (ABS 2015).
The STEM model includes a three-staged trip-based model of LCVs and HCVs
(created in the early 2000s and updated in 2010). The models are calibrated on CV
survey data from 1996.
Hobart Trip-Based Due to lack of local data, the Hobart CV model was developed with parameters
borrowed from other states (Brisbane Strategic Transport Model) and calibrated to
local conditions.
The Hobart CV model uses employment growth factors to grow the base year CV
matrix in order to produce travel demand for future years.
Canberra N/A The Canberra Strategic Model (CSTM) does not include a CV model at the time of
writing these guidelines (June 2021). However, a recent review of modelling in the
ACT has identified the development of a CV model as a high priority. The ACT
Government has subsequently commenced a scoping study to determine the data
requirements and most appropriate structure of a new CV model to be built. These
guidelines will inform that process.
Auckland Trip-Based Auckland has two models:
NZ
The Auckland Strategic Planning Model (ASP), a strategic integrated land-use
model, for medium and long-term planning, scenario development and evaluation,
and for providing the necessary land use inputs for transport modelling; and
The Auckland Regional Transport Model (ART), a conventional 4-stage and
relatively detailed transport model for medium term project and policy planning
and evaluation.
The overall approach to the modelling of the HCVs was to create a base year HCV
matrix from observed data and apply growth factors for the future.
HCV forecasting is based on growth factoring of the base year HCV matrix, using:
Ratio of future year and base year trip ends (using trip rates and future land use
data), and
An additional factor to reflect the historic trends of HCV usage growing faster than
employment (SKM 2008, Beca 2019).
Table note: Private models developed by consultants, universities or other third parties are not listed here. They do,
however, play an important role in the suite of available models.
2.3.4 Issues and Opportunities
Several issues and opportunities have been identified in the Australian context. These are highlighted in
Table 2-3.
Infrastructure and Transport Ministers | Australian Transport Assessment and Planning Guidelines 8T9 Urban freight demand modelling
Table 2-3: Freight modelling issues and opportunities
Issue /
Description
opportunity
It is clear from a review of practice that the availability of conventional data for the purposes of
both establishing and updating commercial vehicle models of any behavioural richness has been
lacking for some time. The current models rely very heavily on borrowed data from other spatial
jurisdictions and on data that are either very old or not fit-for-purpose. Whilst some commodities
may have good and up-to-date definition of parameters and movements, other commodities have
rapidly changing supply chains with data both spatially and temporally sparse.
Modelling freight and commercial vehicles has always been problematic for transport modellers.
Data availability
The primary reason for this is lack of data. Collecting data for CVs is difficult and expensive and
for that reason, it isn’t done very often.
A key issue in all of these models is that the datasets used to calibrate either model type are
significantly old and/or rely on very aggregate surveys. One source of data relied upon by many
of capital city models is the ABS Freight Movement Survey, which was last undertaken in 2014
(ABS 2015). There are also few recent data on the movement of small/medium CV that engage
solely in intra-urban freight movement.
Transport Certification Australia’s (TCA) National Telematics Framework develops common
infrastructure rules for collecting transport data across the country. The Framework and related
offerings, including the Telematics Analytics Platform, support public policy and private sector
National decision-making.
Telematics
Framework and The Australian Government has committed $8.5m to improve national freight data. Access to
National Freight robust freight data will help industry and governments plan, make better operational and
Data Hub investment decisions and be more resilient and responsive.
At the time of writing these guidelines, the National Freight Data Hub was not yet ready to
provide data. However, the Hub has the potential to become a good potential source of
calibration/validation data for any future Australian commercial vehicle model.
The significant growth in on-line purchasing, now spurred by the COVID-19 pandemic, has
increased deliveries made by light commercial vehicles and delivery vans throughout the urban
area, especially in residential areas, as purchasers seek deliveries to a place of their choice at a
Impact of E-
time of their choice. However, very little information is available regarding delivery volumes,
commerce
vehicle patterns and the like. Other impacts propagate throughout the urban area, including the
demand for short-term courier parking for pick-up and delivery and the proliferation of distribution
centers that enable quick deliveries.
One of the issues associated with freight is the level of definition associated with route choice
and appropriately capturing realistic choice particularly where there is regulation or pricing
mechanisms.
Multi-class Freight networks are always integrated with the road/highway network although in some cases,
assignment certain links may not be available to heavy freight vehicles.
Assignment parameters appear to mainly be developed using value of time from ATAP guidance.
There is a query whether more needs to be done to update these values regularly and with
greater granularity.
Whilst HCVs are well-defined within most of the Australian models, there is concern that Light
Light Commercial Vehicle movements are sometimes double-counted both within the non-home based
commercial (NHB) trips from the general passenger model and by the light commercial vehicle models that
vehicle exist within most of these models, depending on how the actual trips and the associated LCV
definition and counts are categorised. In other words, very little information is available that can be used to
double counting distinguish passenger and commercial uses of light vehicles. LCVs arguably represent the
‘weakest link’ in our urban passenger forecasting models.
Zamparini and Reggiani (2007) suggest that there is increasing evidence that pricing strategies
will influence mode choice within urban areas for freight movements. Currently mode choice is
Mode choice statically applied in either trip or commodity-based models. As discussed below, research into
agent-based formulations is starting to consider pricing signals and the decisions of individual
‘actors’ in mode choice.
New types of freight models are emerging and may play a future role in Australia. These include:
Emerging
tour-based models, supply chain (logistics) models, and agent-based models. These are
model types
discussed below in subsequent chapters.
Infrastructure and Transport Ministers | Australian Transport Assessment and Planning Guidelines 9T9 Urban freight demand modelling
Issue /
Description
opportunity
We are in the midst of the pandemic. No one knows how long it will last. At the time of writing this
report, there are promising new vaccines that may be available soon. However, the future is
Covid-19 uncertain. What we do know is that there has been a significant increase in e-commerce to date
Pandemic which has resulted in a dramatic increase in light CV trips. These changes to e-commerce have
accelerated a trend that was already happening before the pandemic began and the changes are
likely to be permanent although we can’t be 100% certain.
2.4 Overseas practice
Appendix D provides a discussion of some major models used overseas. The key learnings for Australia
from those experiences are:
Much of the focus on recent model development in North America and Europe has been on transitioning
from trip-based to tour-based models, which portray how urban delivery / pick-up stops are grouped into
itineraries. They provide a more precise basis for analysing policies and, especially, CV operations on
the urban road network. They serve as the urban freight complement to urban passenger tour- and
activity-based models, whose deployment is advancing rapidly.
Urban commodity flow models are not commonly used, at least in North America. Instead, the focus has
been on modelling the trip first and the commodity second, rather than deriving the CV trip from the
commodity flow model. The difference reflects the focus of the trip- and tour-based models on ultimately
understanding how CV activity interacts with the urban transportation network and its impact on
congestion, air quality, traffic operations and so on.
Some urban trip- and tour-based models have integrated long-distance trips generated by national
commodity flow models into their urban models. The deployment ranges from the extraction of long-
distance CV trip origin-destination matrices for importation into the urban freight model to agent-based
models of how decisions made along the supply chain ultimately impact urban freight activity.
Surveys have been developed to capture the behavioural choices of the urban establishments that
generate freight and of the itinerary, routing and time-of-day choices made by the CVs that serve them.
These data are used for model estimation.
Complementing these surveys is the availability of GPS traces that provide a continuous record of CV
routings, travel times, stops by time of day and information about the vehicle. Their 24/7/365 availability
provides a basis that can be leveraged by the establishment surveys and the CV surveys to provide the
necessary specifics for modelling behavioural, routing and time-of-day choices, and more.
Mobile apps and other technologies are being used to capture CV activity with greater precision and
accuracy. Even so, data collection is still relatively expensive. Some recent model calibrations have
adapted trip rates and variables from other models to complement limited local data. The FRETURB
model in France has developed a database of CV trip rates for urban areas of different sizes and
densities as the basis for estimating CV origin-destination matrices for models in western Europe (Toilier
2018).
Infrastructure and Transport Ministers | Australian Transport Assessment and Planning Guidelines 10T9 Urban freight demand modelling
3. Practical guidance
Chapter 2 demonstrated that:
Current Australian practice typically involves some combination of a 4-step trip-based model and a
commodity flow or freight flow model
Data availability, data age, and the cost of data collection are significant issues for maintaining and
improving the quality of urban freight models
A number of new modelling approaches are emerging, with tour-based models the most advanced from
a practice perspective.
These observations have directly influenced the specific focus in this chapter, which aims to provide
guidance for the areas of most immediate need of practitioners in Australia. As a result, the focus is on
guidance for existing model types and data. In addition, initial material is provided on tour-based models as a
way of familiarising Australian practitioners with this emerging model type.
3.1 Existing practice
As discussed in section 2.3 of this report, most Australian cities currently use CV models that are either trip-
based or commodity-flow models (i.e. the FMM). There are no tour-based freight models for HCVs in use in
Australia at the time of writing this guidance (June 2021). It is also considered likely that most Australian
jurisdictions are likely to continue to use trip-based and commodity follow models as their main urban freight
modelling tools. The ensuing discussion focuses on trip-based and commodity-flow models.
The type of freight model in use is highly influenced by the availability (or lack thereof) of suitable data.
Collecting freight data is notoriously difficult and is discussed in section 3.4 of this report. One of the most
important issues that can restrict the amount of data that can be collected from private sector freight
operators is the commercial sensitivity of the data. These organisations must be reassured that the data will
not be shared with their competitors, that all data will be anonymised before use in modelling, and that the
data will only be used for long-term strategic demand forecasting. Privacy legislation also means that the
planned uses must be clearly explained to participants (although this generally has not been a reason for
participants to refuse). In North America, some commercial operators have shared their electronic manifest
data, anonymised so as to protect the identities of customers, suppliers and so on. However, although these
data sets can offer substantial details, the need to integrate data sets from different operators into a common
database can be prohibitively expensive.
The theoretical basis of our existing CV models is that if commercial vehicle trip productions and attractions
can be estimated for the base year from land use data, then they can also be estimated for a future year,
based on forecast future land use information. This is a sensible assumption as we need to build models which
rely on data which are ‘forecastable’.
Our CV models rely on forecasts of population and employment data to forecast the number of light and heavy
commercial vehicles for the base year and any future horizon year. The inherent assumption built into our
commercial vehicles is therefore that growth in commercial vehicles is proportional to growth in population and
employment, although not necessarily in equal proportions depending on an urban area’s demographic
composition and its economic structure (e.g., a mining community will have different workforce and economic
structures than, say, a capital city). Moreover, structural changes in the economy have a clear influence on the
types and magnitudes of freight that are moved, and on the modes and vehicles used to move this. While
growth in economic activity (as measured by GDP) also influence traffic growth, its influence is indirectly
captured through the population and employment projects.
Infrastructure and Transport Ministers | Australian Transport Assessment and Planning Guidelines 11T9 Urban freight demand modelling
However, there is evidence to suggest that the commercial vehicle fleet grows more rapidly than either
population, employment or GDP. For example, in NZ between 1970 and 1998, the growth in goods
movement was about 2% higher than population growth. And in Western Australia, the average annual
growth rate in the number of registered semi-trailers and prime movers between 1987-2010 was 5% per
annum while population growth was in the range of 1.5%-2.0% per annum.
While this doesn’t necessarily change the data requirements for a CV survey, it needs to be considered
when any new CV model is built in the future.
As noted, one of the most common CV model formulations in Australia today is the trip-based structure. The
model follows a three-step formulation: trip generation, trip distribution and trip assignment, with the last step
preferably integrated with the passenger auto vehicle trip assignment (see section 2.3.1. The urban freight
model can be simplified by excluding the mode choice component. Mode choice is not an issue because all
goods movement trips are assumed to be made by road vehicle (i.e. we are not concerned with forecasting
goods movement demand by other modes) and, as experience elsewhere has shown, there are virtually no
options to road-based vehicles (i.e. drivers have limited choice as to vehicle type). This simplifies the model
calibration effort significantly and also reduces the minimum data requirements.
The other common CV model in use in Australia is the Freight Movement Model. The first FMM was
developed in 2006 and its production rates (tonnes per employee per weekday) were estimated from freight
survey data comprised of 602 samples collected for Melbourne, Brisbane and Sydney from 2006 to 2008.
Since this time, there have been three major updates in 2009, 2012, and 2016.
3.2 Context and principles for best practice
The context for the design of urban freight models is, in general, the same as for the modelling of urban
passenger movements, as outlined in ATAP T1 Travel Demand Modelling. The key aspects are:
Data collection;
Model design (incorporating trip generation, trip distribution and assignment in the case of a trip-based
CV model);
Model calibration and validation; and
Documentation.
Some key differences include:
Freight trips and tours involve the surveying of establishments and ports and intermodal terminals rather
than households
The selection of purposes is different, and is typically not differentiated due to a lack of data and the fact
that the purposes are more homogeneous
Freight travel typically has a different impedance2 associated with the trip than does passenger travel;
and
2
‘Impedance’ is a measure of the ‘cost’ of a trip, which can be defined as a function of one of more of journey time, path distance and
out-of-pocket cost. Passengers and commercial drivers both have a desire to minimise the ‘costs’ of a trip, which is reflected in how
models assign traffic (i.e. Wardrop’s first principle). However, the components of the impedance function, their relative importance and
the underlying unit costs (values of times, CV route prohibitions, etc.) can differ between the assignment of passenger vehicles and
commercial vehicle.
Infrastructure and Transport Ministers | Australian Transport Assessment and Planning Guidelines 12T9 Urban freight demand modelling
The value of time of generalised cost equations for freight in multi-class (vehicle) traffic assignment
would generally be expected to be higher for urban freight classifications than for passenger vehicles
(Refer to ATAP guidance PV2 for values of time. Note PV2 provides separate value of time for the driver
and the freight carried. See also King and Wallis (2020) for recent research in New Zealand).
The model development of passenger travel demand models is covered in Section 5 of T1 Travel Demand
Modelling Guidelines. Similar approaches apply to the development for freight models but with some key
considerations that are specific to freight modelling:
Freight almost always comprises a minority component of total road traffic. However, on a per vehicle
basis, it represents higher value (in terms of travel time savings, operating costs, impacts on road
operation and maintenance, etc.) than passenger traffic, and
For the freight carrier industry, a general axiom is that “time equals money.” This means that transporters
will tend to favour the shortest route, timewise, which can entail travelling longer distances if necessary,
to avoid congestion and delay. By comparison, although passengers also value their time, for freight
carriers delays result in direct out-of-pocket expenditures (e.g., additional driver salaries) that must be
recouped through increased tariffs or other means, or they must absorb the costs, which directly impacts
their economic viability. Although passengers also incur the impacts of delays (e.g., someone is late for a
meeting), but not always without incurring a corresponding out-of-pocket cost.
Recommended calibration requirements are shown in section 3.6. It should be noted (as per the discussion
in T1) that these should be considered as guidance only rather than as rigid standards.
3.3 Key assumptions
3.3.1 Trip-based models
This section discusses important assumptions common to most Australian trip-based CV models. An overall
description of the trip-based approach can be found in Appendix A.1.
It must be noted that the focus here is on urban or metropolitan freight models, as opposed to state-wide trip-
based models. The latter do exist elsewhere (e.g., in North America), but separate models that focus on key
urban areas are often developed in order to provide the necessary spatial detail within urban or metropolitan
areas compatible with the areas’ passenger travel models. The state-wide models thus estimate trips that are
external to the urban area – that is, the trips that start and/or end outside the urban / metropolitan area –
which can then be incorporated into the urban model’s CV origin-destination matrices.
The urban / metropolitan area and state-wide freight model formulations are mainly similar in concept,
although with some important distinctions. One key distinction is that mode choice is not typically a factor in
urban formulations, given that virtually all urban freight movement is by road-based vehicle (CV). This means
that the urban trip-based freight model typically has three steps: generation, distribution and assignment.
Another distinction is that urban models commonly focus on a single day’s vehicular activity commensurate
with the corresponding passenger travel model, while state-wide models can be based on annual commodity
flows that must be translated to vehicles (Comi et al. 2014, Beagan et al. 2019).
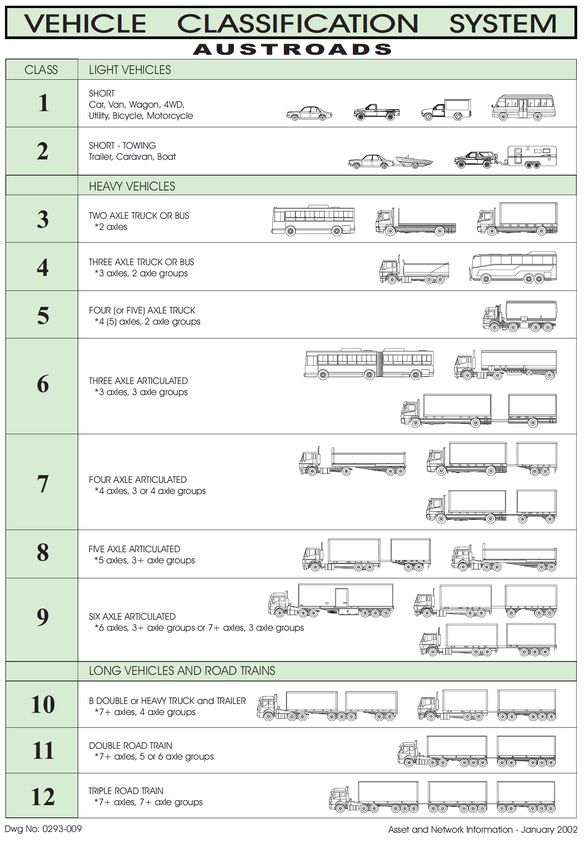
CV trips are generally categorised into light (LCV) and heavy (HCV), based on the Austroads vehicle
classification system shown in Appendix E. Classes 1 and 2 comprise LCVs and classes 3 through 12
comprise HCVs. However, there is a desire to move towards a more disaggregated definition of CVs which
may include additional categories as follows:
Infrastructure and Transport Ministers | Australian Transport Assessment and Planning Guidelines 13T9 Urban freight demand modelling Class 1 & 2 (light commercial vehicles) Class 3, 4 and 5 (medium commercial vehicles) Class 6, 7, 8 & 9 (articulated heavy vehicles), and Class 10, 11 & 12 (long vehicles and road trains). Adopting this type of disaggregated CV model will depend largely on the availability of data to calibrate each different segment. General model structure The general structure for a CV trip model is displayed in Figure 3-1. The figure has three components: Inputs, shown in orange The three steps of the modelling process, shown in dark blue Outputs, shown in light blue. Each component is discussed below. Figure 3-1: Structure of trip-based model Infrastructure and Transport Ministers | Australian Transport Assessment and Planning Guidelines 14
You can also read