Triceps brachii muscle architecture, upper-body rate of force development, and bench press maximum strength of strong and weak trained ...
←
→
Page content transcription
If your browser does not render page correctly, please read the page content below
HUMAN MOVEMENT (ISSN 1899-1955)
         2023; 24(1): 121–129

Triceps brachii muscle architecture, upper-body rate of force
development, and bench press maximum strength of strong
and weak trained participants
                                                                        © Wroclaw University of Health and Sport Sciences
original paper
doi: https://doi.org/10.5114/hm.2023.113714
NIKOLAOS ZARAS1,2, ANGELIKI-NIKOLETTA STASINAKI2, POLYXENI SPILIOPOULOU2,
THOMAS MPAMPOULIS2, GERASIMOS TERZIS2
1
    Human Performance Laboratory, Department of Life and Health Sciences, University of Nicosia, Nicosia, Cyprus
2
    Sports Performance Laboratory, School of Physical Education and Sport Science, National and Kapodistrian University
    of Athens, Athens, Greece

Abstract
Purpose. The study aim was: (a) to investigate the relationship between triceps brachii muscle architecture and upper-
body isometric rate of force development (RFD), isometric peak force (IPF), and maximum strength (one-repetition maximum,
1-RM) in bench press and (b) to explore whether triceps brachii architecture might determine RFD, IPF, and 1-RM strength
in stronger and weaker participants.
Methods. The study involved 21 males (age: 22.6 ± 4.7 years, weight: 76.6 ± 10.2 kg, height: 1.79 ± 0.07 m) with 3.4 ± 2.1
years of experience in resistance training. They were divided into a strong and weak group depending on their relative 1-RM
strength in bench press. Measurements included triceps brachii muscle architecture, upper-body isometric RFD, IPF, and
1-RM strength in bench press.
Results. Moderate to large correlations were found for triceps brachii thickness and fascicle angle with upper-body RFD
(r: 0.379–0.627), IPF (r: 0.582 and 0.564, respectively), and 1-RM strength in bench press (r: 0.530 and 0.412, respectively).
Maximum strength in bench press was largely correlated with IPF (r = 0.816); moderate to very large correlations were observed
with RFD (r: 0.499–0.725). The strong group presented significantly higher 1-RM relative strength, RFD, and IPF (p < 0.05)
than the weak group, but no significant between-group difference was found for triceps brachii architecture (p > 0.05).
Conclusions. Triceps brachii architecture correlates with 1-RM strength, upper-body RFD, and IPF in trained participants.
However, triceps brachii architecture may not distinguish upper-body strength and RFD between stronger and weaker male
participants.
Key words: resistance training, muscle strength, muscle thickness, explosive performance

     Introduction                                                 for many athletic actions which include elbow exten-
                                                                  sion, such as the shot put and the basketball shot [4, 5].
    Bench press is a multi-joint exercise regularly ap-           Regular resistance training may induce significant
plied by athletes and strength and conditioning coaches           changes in the triceps brachii muscle architecture.
to increase upper-body maximum strength, as well as               Long-term training studies have shown that resist-
muscle hypertrophy and stamina [1]. It is also a useful           ance training, including bench press, may increase
testing exercise/tool to measure upper-body maxi-                 triceps brachii muscle thickness and fascicle angle in
mum strength (one-repetition maximum, 1-RM) [2].                  untrained males, but no significant change occurred
Bench press exercise involves the activation of the up-           for fascicle length [6–8]. In line with these results, 1-RM
per-body musculature system, mainly the pectoral                  strength in elbow extension exercise was significantly
muscles, the anterior deltoid, and the triceps brachii [3].       correlated with triceps brachii thickness (r: 0.706–
More specifically, triceps brachii is an important muscle         0.831), fascicle angle (r = 0.827), and fascicle length

Correspondence address: Nikolaos Zaras, Human Performance Laboratory, Department of Life and Health Sciences,
University of Nicosia, 46 Makedonitissas Ave., P.O. Box 24005, 1700 Nicosia, Cyprus, e-mail: zaras.n@unic.ac.cy

Received: April 29, 2021
Accepted for publication: February 8, 2022

Citation: Zaras N, Stasinaki A-N, Spiliopoulou P, Mpampoulis T, Terzis G. Triceps brachii muscle architecture, upper-body
rate of force development, and bench press maximum strength of strong and weak trained participants. Hum Mov.
2023;24(1):121–129; doi: https://doi.org/10.5114/hm.2023.113714.
                                                                                                                         121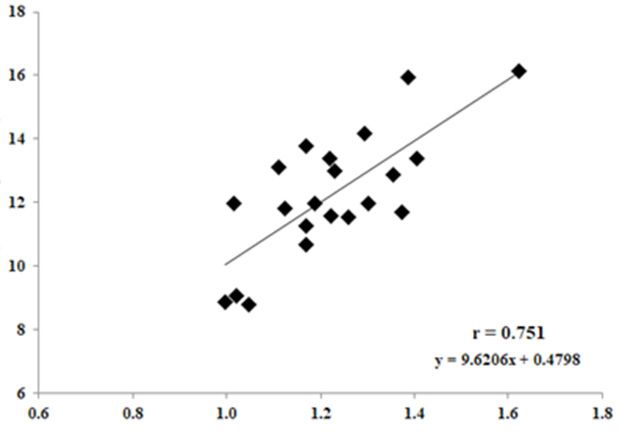
HUMAN MOVEMENT
N. Zaras et al., Rate of force development and triceps muscle architecture
(r = –0.723) in male participants [8]. Similarly, Waka long-term trained participants and their untrained
hara et al. [9] reported that during concentric elbow counterparts [16]. However, scarce data exist regard-
extension, the triceps brachii muscle volume and fas- ing the comparison between stronger and weaker in-
cicle angle were significantly correlated with joint power dividuals in upper-body muscles. Ichinose et al. [20]
production (r = 0.600) and angular velocity (r = 0.563), indicated that male athletes in soccer and gymnas-
respectively. However, whether the triceps brachii mus- tics presented greater triceps brachii muscle thickness
cle architecture characteristics may correlate with 1-RM than their female counterparts, while male gymnastics
strength in bench press remains largely unknown. athletes had greater fascicle angle than female gym-
One major factor that highly contributes to maxi- nastics athletes. It would be particularly interesting to
mum strength and fast force production is the rate of investigate whether upper-body maximum strength
force development (RFD) [10, 11]. RFD can be calcu- and RFD among stronger and weaker individuals may
lated by the force/time curve and evaluates the force be determined by triceps brachii muscle architecture
that can be produced per a unit of time, usually in time characteristics.
frames of 0–250 ms. It depends on both neural and Therefore, the purpose of the study was 2-fold: (a)
muscular factors [11, 12]. Muscle architecture char- to investigate the correlation between triceps brachii
acteristics have been linked with RFD. Studies showed muscle architecture and 1-RM strength in bench press,
strong correlations of vastus lateralis (VL) muscle upper-body RFD, and isometric peak force (IPF); and
thickness, fascicle angle, and fascicle length with RFD (b) to examine whether triceps brachii muscle archi-
performance in power athletes [11–13]. Although tecture might determine 1-RM strength, RFD, and IPF
a strong correlation exists between lower-body muscle in strong and weak male participants. The hypothesis
architecture and RFD, the relationship between upper- was that triceps brachii muscle architecture charac-
body RFD and triceps brachii muscle architecture re- teristics would correlate with 1-RM strength, RFD,
mains unexplored. The investigation of this relation- and IPF in trained participants, while stronger partici-
ship might provide important insights into the role of pants would exhibit higher muscle thickness, fascicle
upper-body muscle architecture in fast force produc- angle, and longer fascicle length compared with weaker
tion, which will be very useful for strength and condi- male subjects.
tioning coaches to design more effective training pro-
grams for athletes in whom the upper-body muscles Material and methods
have a key significance for performance.
It has been well documented that muscle mass is an Participants
essential factor responsible for high force and power
production [13, 14]. Individuals with greater muscle A total of 21 male physical education and sports
mass might perform higher in strength- and power- science students with a resistance training experience
oriented tasks compared with individuals with lower of 3.4 ± 2.1 years responded to a written message of
muscle mass [15]. Thus, stronger athletes may possess the study posted in the announcement area of the
greater muscle mass, produce greater amounts of maxi- School of Physical Education and Sport Science of
mum force, and obtain higher power outputs and RFD the National and Kapodistrian University of Athens.
than weaker individuals [13, 16–18]. In line with these The participants were further divided into a strong and
findings, a study in elite surfing athletes showed that a weak group in accordance with their 1-RM relative
stronger athletes exhibited greater VL thickness and strength in bench press. The anthropometric charac-
median gastrocnemius thickness and fascicle angle as teristics of the subjects are presented in Table 1. The
compared with weaker athletes [19]. Similarly, signifi- students were informed about the experimental pro-
cant differences in the quadriceps cross-sectional area, cedures. The inclusion criteria were as follows: (a) ab-
fascicle length, and fascicle angle were found between sence of any cardiovascular, orthopaedic, and neuro-
Table 1. Anthropometric characteristics and 1-RM strength of the participants
Participants Age (years) Weight (kg) Height (m) 1-RM strength in bench press (kg)
All (n = 21) 22.6 ± 4.7 76.6 ± 10.2 1.79 ± 0.07 95.4 ± 18.2
Strong (n = 10) 22.5 ± 2.8 72.4 ± 7.4 1.78 ± 0.07 97.50 ± 13.74
Weak (n = 11) 22.5 ± 6.2 79.6 ± 11.7 1.81 ± 0.07 88.05 ± 10.41
1-RM – one-repetition maximum
122
Human Movement, Vol. 24, No 1, 2023HUMAN MOVEMENT
N. Zaras et al., Rate of force development and triceps muscle architecture
muscular issue; (b) systematic resistance training at capture the largest continuous fascicle visualization,
least 2 times per week within the previous 6 months; a dashed line was drawn from the insertion of the
and (c) absence of drug abuse or nutritional supple- triceps long head up to the medial epicondyle of the hu-
ment intake. merus and the transducer was placed along this line
with parallel orientation with muscle fascicles [8].
Procedures A continuous single view (extended field of view) was
taken by moving the transducer along that dashed line.
The current study aimed (a) to investigate the re- Two images were captured and analysed for muscle
lationship between triceps brachii muscle architecture thickness, fascicle angle, and fascicle length by the image
and 1-RM strength in bench press, upper-body RFD, analysis software (Motic Images Plus 2.0, Hong Kong)
and IPF; and (b) to observe whether triceps brachii and the mean was used for the statistical analysis.
muscle architecture might determine the 1-RM
strength, RFD, and IPF among strong and weak par- Upper-body rate of force development
ticipants. Male resistance-trained participants were
recruited. All subjects were familiar with the bench For the evaluation of upper-body RFD and IPF, the
press exercise and with 1-RM strength measurements. participants sat on a custom-made steel chair (assum-
Evaluations were performed during a 4-day schedule. ing a seated bench press position) and placed their
More specifically, on the first day, the individuals vis- arms on a barbell which was positioned with struts on
ited a laboratory for anthropometric measurements the force platform (Applied Measurements Ltd. Co.,
(weight and height) and a familiarization session with Reading, UK; WP800, A/D sampling frequency 1 kHz).
the upper-body RFD assessment. On the second day, The barbell was positioned in parallel to the floor and
the triceps brachii muscle architecture was evaluated. located at the middle of the distance between the top of
On the third day, the participants underwent the upper- the shoulders and the lower point of the breastbone,
body RFD measurement and, finally, during the allowing an angle of 90° between the elbow and the
fourth day, the 1-RM bench press test was performed. armpits [24, 25]. A computer monitor was placed just
After the assessments, the subjects were further di- above the force platform in front of the participants in
vided into a strong (n = 10) and a weak (n = 11) group, order to provide real-time visual feedback of the force
in accordance with the median value of the 1-RM applied for each effort. During the familiarization ses-
strength in bench press expressed per body mass (me- sions, the subjects trained with 6–8 short-time at-
dian: 1.223 kg/weight) [19, 21, 22]. In order to answer tempts (1-s duration) to apply their force as fast as pos-
the first research question, a correlation analysis was sible. Then, on the third visit, RFD and IPF measurements
applied including all participants (n = 21), while for were performed. Brief ly, after a short warm-up on
the second research question, a Student’s t-test for in- a treadmill, dynamic upper-body stretching and 2 sets
dependent samples statistical analysis was performed of 6 fast unloaded push-ups, the participants performed
to examine differences between the stronger and weaker 2 attempts with progressively increasing force and
individuals. 2 fast attempts with approximately 80% of their maxi-
mum strength. Subsequently, 4 maximum efforts were
Triceps brachii muscle architecture performed with 3-s duration each, and 3 minutes of
characteristics rest in between. During all efforts, the individuals
were instructed to apply their maximum force as fast
For the triceps brachii long head architecture, as possible and received strong vocal encouragement.
B-mode panoramic ultrasound images were obtained From the 4 maximum efforts, the best and the worst
with a 38-mm linear probe using the i-Scape software were excluded from the analysis and the mean of the
of the ultrasound device (10.0 MHz, Mindray Z5, China). other 2 efforts was used for the statistical analysis
The measurement began with the participants remain- [26]. Data from the force platform were recorded (Kyowa
ing in a standing position with their arms extended on sensor interface PCD-320A) and the force-time curve
the sides of the body. The distance between the poste- was analysed for IPF, which was the greatest force
rior surface of the acromion and the lateral epicondyle generated, and the RFD in specific time windows of
of the humerus was marked and used as the total 0–30, 0–50, 0–80, 0–100, 0–150, 0–200, and 0–250 ms,
length of the upper arm [23]. Then, the subjects lay relative to the onset of contraction, which was set at
supine with their measuring arm extended on a labo- 2.5% of the difference between baseline and maximum
ratory bed at a position of 90° to their torso. In order to force [15].
123
Human Movement, Vol. 24, No 1, 2023HUMAN MOVEMENT
N. Zaras et al., Rate of force development and triceps muscle architecture
1-RM strength in bench press Results
Bench press 1-RM strength testing was conducted The intraclass correlation coefficients, confidence
on a parallel bench [27]. Briefly, after a light run on intervals, and the coefficients of variation of the per-
a treadmill followed by dynamic upper-body stretch- formed measurements are provided in Table 2.
ing, the participants performed 2 sets of 6–8 fast
push-up repetitions followed by 2 sets of 10 repetitions Table 2. Intraclass correlation coefficients, confidence
intervals, and the coefficients of variation of the
in the bench press with a constant load of 40 kg. Then,
measurements
3 sets of 8, 6, and 4 repetitions with approximately
50–60%, 70–75%, and 80–85%, respectively, of the 95% CI
predicted 1-RM were carried out. For the determina- Variables ICC Upper Lower CV%
tion of maximum strength (1-RM), 4–5 sets of 1 repeti- bound bound
tion were performed with 2–3 minutes of rest between
efforts. At all times, 2 of the researchers were present Muscle thickness (cm) 0.984 0.995 0.951 14.8
Fascicle angle (°) 0.858 0.952 0.626 17.0
to monitor the technique of the exercise, assisting all
Fascicle length (cm) 0.794 0.928 0.483 11.5
participants during lifting and encouraging them to
RFD 30 ms (N/s) 0.838 0.938 0.610 17.6
apply their maximum possible strength.
RFD 50 ms (N/s) 0.845 0.941 0.622 15.6
RFD 80 ms (N/s) 0.815 0.928 0.567 17.3
Statistical analysis RFD 100 ms (N/s) 0.787 0.917 0.514 17.9
RFD 150 ms (N/s) 0.652 0.859 0.261 17.5
All variables are presented as means and standard RFD 200 ms (N/s) 0.582 0.827 0.143 18.4
deviations. Normality of data was assessed with the RFD 250 ms (N/s) 0.744 0.899 0.427 18.0
Shapiro-Wilk test and no violations in normality were IPF (N) 0.869 0.899 0.427 18.0
observed. Correlations between variables were exam- 1-RM bench press (kg) 0.966 0.985 0.914 12.8
ined with r-Pearson coefficient. In addition, magnitude
RFD – rate of force development, IPF – isometric peak
of effect for the correlations was based on the follow- force, 1-RM – one-repetition maximum, ICC – intraclass
ing scale: trivial (< 0.10), small (0.10–0.29), moderate correlation coefficient, CI – confidence interval,
(0.30–0.49), large (0.50–0.69), very large (0.70–0.89), CV% – coefficient of variation
and nearly perfect ( 0.9) [28]. Independent samples
t-test analysis was used to compare the differences All participants completed the measurements with-
between the strong and weak groups. Cohen’s d effect out any injury. Correlational analysis for all subjects
size was calculated, with the following criteria used to revealed moderate to large correlations between triceps
infer the magnitude of the difference: < 0.2 (trivial), brachii muscle thickness and fascicle angle with ab-
0.2–0.5 (small), 0.5–0.8 (moderate), and > 0.8 (large) solute upper-body RFD and IPF (Table 3). Additionally,
[29]. The reliability of all measurements was deter- trivial to moderate correlations were found for triceps
mined with a 2-way random effect intraclass correla- brachii muscle thickness and fascicle angle with rel-
tion coefficient, confidence intervals, and the coeffi- ative upper-body RFD and IPF (Table 4). 1-RM abso-
cient of variation. Significance was set at p 0.05. lute strength in bench press was correlated with triceps
brachii muscle thickness (r = 0.530, large), with fas-
Ethical approval cicle angle (r = 0.412, moderate), and with fascicle
The research related to human use has complied length (r = 0.165, small). Small correlations were ob-
with all the relevant national regulations and institu- served between 1-RM relative strength in bench press
tional policies, has followed the tenets of the Declara- and triceps brachii muscle thickness (r = 0.295), fas-
tion of Helsinki, and has been approved by the bioethics cicle angle (r = 0.174), and fascicle length (r = 0.250).
committee board of the School of Physical Education There were large to very large correlations between
and Sport Science of the National and Kapodistrian 1-RM relative strength in bench press and upper-
University of Athens in Greece (project No.: 1024/8/ body relative RFD (Table 4). A very large correlation
11/2017). was established between 1-RM strength in bench press
and IPF both in absolute values and those relative to
Informed consent body mass (Figure 1).
Informed consent has been obtained from all indi- The results concerning 1-RM strength, RFD, IPF,
viduals included in this study. and muscle architecture for the strong and weak
124
Human Movement, Vol. 24, No 1, 2023HUMAN MOVEMENT
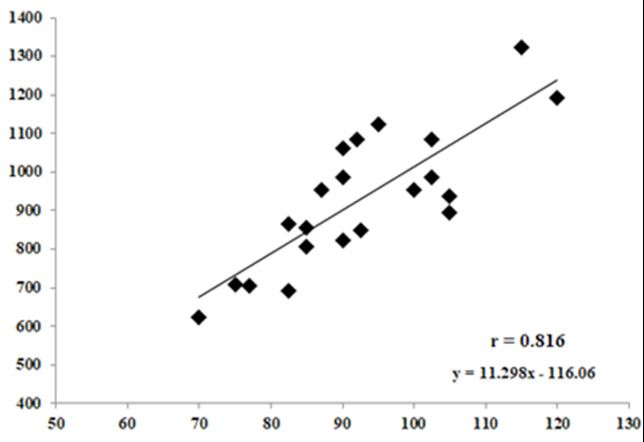
Upper-body isometric peak force (N) N. Zaras et al., Rate of force development and triceps muscle architecture
Upper-body iisometric peak force
(N/weight)
r = 0.816 r = 0.751
y = 11.298x – 116.06 y = 9.6206x + 0.4798
a) 1-RM strength in bench press (kg) b) 1-RM strength in bench press (kg/weight)
Figure 1. Correlation scatterplots for (a) 1-RM absolute strength in bench press and upper-body absolute isometric peak
force (p < 0.01) and (b) 1-RM relative strength in bench press [force (kg) / weight (kg)] and upper-body relative isometric
peak force [N / weight (kg)] (p < 0.01)
Table 3. Correlation coefficients between absolute values in 1-RM strength in bench press, triceps brachii muscle
architecture, upper-body rate of force development, and isometric peak force (n = 21)
RFD RFD RFD RFD RFD RFD RFD
Variables IPF
30 ms 50 ms 80 ms 100 ms 150 ms 200 ms 250 ms
1-RM bench press 0.499†* 0.642‡** 0.725#** 0.716#** 0.663‡** 0.616‡** 0.639‡** 0.816#**
TB thickness 0.372† 0.471†* 0.564‡** 0.591‡** 0.627‡** 0.615‡** 0.494†* 0.582‡**
TB angle 0.424† 0.515‡* 0.552‡** 0.548‡* 0.609‡** 0.625‡** 0.591‡** 0.564‡**
TB length –0.033+ 0.028+ 0.135+ 0.167 0.093 0.024 –0.071+ 0.051+
1-RM – one-repetition maximum, RFD – rate of force development, IPF – isometric peak force, TB – triceps brachii
+
trivial (< 0.10), small (0.10–0.29), † moderate (0.30–0.49), ‡ large (0.50–0.69), # very large (0.70–0.89),
§ nearly perfect ( 0.9), * p < 0.05, ** p < 0.01
Table 4. Correlation coefficients between 1-RM strength in bench press, triceps brachii muscle architecture,
upper-body rate of force development, and isometric peak force relative to weight (n = 21)
RFDR RFDR RFDR RFDR RFDR RFDR RFDR
Variables IPFR
30 ms 50 ms 80 ms 100 ms 150 ms 200 ms 250 ms
1-RM bench press relative 0.594‡** 0.727#** 0.781#** 0.770#** 0.646‡** 0.539‡* 0.513‡* 0.751#**
TB thickness 0.262 0.315† 0.360† 0.368† 0.412† 0.431† 0.320† 0.466†*
TB angle 0.317† 0.362† 0.353† 0.333† 0.395† 0.440†* 0.428† 0.427†
TB length –0.011+ 0.056+ 0.163 0.190 0.132 0.068+ –0.037+ 0.129
1-RM – one-repetition maximum, RFDR – rate of force development relative to body mass, IPFR – isometric peak force
relative to body mass, TB – triceps brachii
+
trivial (< 0.10), small (0.10–0.29), † moderate (0.30–0.49), ‡ large (0.50–0.69), # very large (0.70–0.89),
§ nearly perfect ( 0.9), * p < 0.05, ** p < 0.01
groups are presented in Table 5. Absolute maximum with the weaker individuals. When RFD was expressed
strength in bench press was similar in both groups in relation to body mass, then the stronger participants
(percentage difference: 10.7%, p = 0.090), but higher exhibited significantly higher relative RFD in time
for the stronger participants when expressed per frames of 0–30 ms (percentage difference: 38.2%,
body mass (percentage difference: 21.1%, p = 0.000). p = 0.009), 0–50 ms (percentage difference: 32.6%,
In addition, the stronger subjects presented signifi- p = 0.004), 0–80 ms (percentage difference: 27.5%,
cantly higher absolute RFD in time frames of 0–30 ms p = 0.004), 0–100 ms (percentage difference: 26.0%,
(percentage difference: 28.5%, p = 0.050) and 0–50 ms p = 0.004), 0–150 ms (percentage difference: 19.3%,
(percentage difference: 22.6%, p = 0.043) compared p = 0.018), and 0–200 ms (percentage difference: 15.3%,
125
Human Movement, Vol. 24, No 1, 2023HUMAN MOVEMENT
N. Zaras et al., Rate of force development and triceps muscle architecture
Table 5. Results of the analysis between strong and weak participants for anthropometric characteristics,
1-RM strength in bench press, rate of force development, and isometric peak force
Interpretation
Variables Strong (n = 10) Weak (n = 11) p Effect size
of effect size
Anthropometric characteristics
Weight (kg) 72.39 ± 7.29 79.61 ± 11.72 0.110 0.741 Moderate
Height (m) 1.78 ± 0.07 1.81 ± 0.07 0.246 0.522 Moderate
BMI (kg/m2) 22.93 ± 1.19 24.18 ± 0.06 0.190 0.604 Moderate
1-RM strength
Bench press (kg) 97.50 ± 13.74 88.05 ± 10.41 0.090 0.776 Moderate
Bench press (kg/weight) 1.345 ± 0.117 1.112 ± 0.079 0.000 2.344 Large
RFD absolute values
30 ms (N/s) 8930.8 ± 2796.5 6948.1 ± 1382.9 0.050 0.899 Large
50 ms (N/s) 6948.1 ± 1382.9 8872.4 ± 2089.9 0.043 0.938 Large
80 ms (N/s) 8872.4 ± 2089.9 7233.1 ± 1320.4 0.063 0.864 Large
100 ms (N/s) 7233.1 ± 1320.4 7494.9 ± 1270.1 0.074 0.828 Large
150 ms (N/s) 7494.9 ± 1270.1 6391.3 ± 1284.1 0.269 0.498 Small
200 ms (N/s) 6391.3 ± 1284.1 6652.3 ± 999.3 0.528 0.281 Small
250 ms (N/s) 6652.3 ± 999.3 5749.8 ± 1172.5 0.765 0.132 Trivial
IPF (N) 962.7 ± 189.2 899.4 ± 167.7 0.427 0.354 Small
Ratio of bench press to IPF (kg/N) 0.1024 ± 0.009 0.0996 ± 0.012 0.541 0.274 Small
RFD relative to body mass
30 ms (N/s/weight) 122.6 ± 32.1 88.7 ± 20.4 0.009 1.260 Large
50 ms (N/s/weight) 88.7 ± 20.4 122.1 ± 23.0 0.004 1.425 Large
80 ms (N/s/weight) 122.1 ± 23.0 92.1 ± 18.9 0.004 1.454 Large
100 ms (N/s/weight) 92.1 ± 18.9 103.4 ± 13.4 0.004 1.424 Large
150 ms (N/s/weight) 103.4 ± 13.4 81.1 ± 17.0 0.018 1.132 Large
200 ms (N/s/weight) 81.1 ± 17.0 91.9 ± 10.7 0.060 0.875 Large
250 ms (N/s/weight) 91.9 ± 10.7 73.0 ± 15.5 0.117 0.715 Moderate
IPF (N/weight) 73.0 ± 15.5 68.4 ± 9.2 0.023 1.079 Large
Triceps brachii muscle structure
TB thickness (cm) 2.00 ± 0.32 1.92 ± 0.38 0.598 0.235 Small
TB angle (°) 15.20 ± 2.05 14.15 ± 2.82 0.345 0.427 Small
TB length (cm) 9.91 ± 1.22 9.65 ± 1.19 0.633 0.212 Small
1-RM – one-repetition maximum, BMI – body mass index, RFD – rate of force development, IPF – isometric peak force,
TB – triceps brachii
p = 0.060) compared with the weaker subjects. Simi- Discussion
larly, IPF relative to body mass was significantly higher
for the stronger participants (percentage difference: The purpose of the study was to investigate the cor-
16.7%, p = 0.023) than among the weaker ones. relation between triceps brachii muscle architecture
Comparisons between the strong and weak subjects and upper-body RFD, IPF, and 1-RM strength in bench
for triceps brachii muscle architecture showed no sig- press, as well as to examine whether triceps brachii
nificant differences between the groups for muscle muscle architecture might determine upper-body RFD,
thickness (percentage difference: 4.2%, p = 0.598), fas- IPF, and 1-RM strength in bench press among stronger
cicle angle (percentage difference: 7.4%, p = 0.345), and weaker participants. The main findings of the
and fascicle length (percentage difference: 2.7%, p = study are as follows: (a) triceps brachii muscle archi-
0.633), while only small effect sizes were obtained tecture, especially muscle thickness and fascicle angle,
(Table 5). were moderately correlated with RFD and IPF, while
large to moderate correlations were found for muscle
thickness and fascicle angle with 1-RM strength in
126
Human Movement, Vol. 24, No 1, 2023HUMAN MOVEMENT
N. Zaras et al., Rate of force development and triceps muscle architecture
bench press; (b) RFD and IPF were very largely corre- solute values and those relative to body mass. Thus,
lated with 1-RM strength in bench press; and (c) tri- seated upper-body IPF measurement may be a strong
ceps brachii muscle architecture may not determine predictor of 1-RM strength in bench press in male
1-RM strength in bench press, RFD, or IPF in stronger trained subjects.
and weaker participants. These results suggest that Stronger participants presented higher 1-RM rela-
triceps brachii muscle thickness and fascicle angle were tive strength, relative RFD, and relative IPF compared
correlated with upper-body RFD, IPF, and 1-RM with weaker individuals. However, scarce data exist
strength in bench press in trained subjects. However, regarding the comparison of upper-body maximum
triceps brachii muscle architecture may not deter- strength and RFD between strong and weak subjects.
mine 1-RM bench press strength, upper-body RFD, A previous study showed significant differences be-
or IPF in stronger and weaker participants. tween stronger and weaker collegiate athletes concern-
Bench press is a fundamental exercise for upper- ing lower-body muscle strength, isometric mid-thigh
body muscular system. Triceps brachii, along with pull maximum RFD, and IPF [17]. Similar results were
pectoral and deltoid muscles, is mainly involved in determined between stronger and weaker netball
the bench press movement [3]. Triceps brachii muscle players for lower-body mid-thigh pull IPF, counter-
architecture, especially muscle thickness and fascicle movement jump, and squat jump, as well as for sprint
angle, was moderately to largely correlated with upper- and change of direction speed [18]. In line with these
body RFD in absolute and relative values, respectively, in findings, stronger surfing athletes may produce greater
all time frames. Although triceps brachii has a smaller isometric mid-thigh pull force, as well as higher coun-
contribution in bench press compared with pectoral termovement jump and squat jump compared with
and deltoid muscles [30], its role during the final ap- weaker surfers [19]. The results of the current study
plication of force in various athletic movements is confirm that upper-body RFD and IPF may be signifi-
important [4, 5]. The current results indicate that tri- cantly different between stronger and weaker trained
ceps brachii muscle architecture largely contributes to individuals, comparably with the results of lower-body
the upper-body RFD in trained participants. In addi- studies. RFD is affected by both neural and muscle
tion, studies examining lower-body muscles revealed factors, with maximum strength and muscle mass
significant correlations between VL muscle architec- being vital elements to differentiate between stronger
ture and lower-body RFD [11, 12]. According to the and weaker subjects [10, 14]. Nevertheless, the com-
authors’ knowledge, this is the first study to investi- parison between stronger and weaker participants
gate the correlation between upper-body muscle archi- regarding upper-body RFD and IPF needs further
tecture and RFD performance. Consequently, these investigation.
results should be interpreted with caution, and further An unexpected finding of the current study was
research is needed to reach certain conclusions about that triceps brachii muscle architecture characteristics
the relationship of upper-body RFD with triceps bra- were similar between stronger and weaker participants
chii muscle architecture. (the effect size was only small). Although stronger sub-
Similarly to RFD, IPF was moderately to largely jects presented greater 1-RM relative strength in bench
correlated with triceps brachii muscle thickness and press and higher upper-body relative RFD and IPF than
fascicle angle both in absolute values and in those rela- weaker individuals, no significant difference was found
tive to body mass. In line with these findings, moderate for triceps brachii muscle thickness, fascicle angle, or
to large correlations were found for triceps brachii fascicle length. Results obtained among elite surfing
muscle thickness and fascicle angle with 1-RM abso- athletes showed that stronger surfers exhibited greater
lute strength in bench press, while only small corre- VL muscle thickness, as well as lateral gastrocnemius
lations were observed with 1-RM relative strength in thickness and fascicle angle compared with weaker
bench press. Previous studies showed that VL muscle ones [19]. Thus, triceps brachii muscle architecture may
architecture (thickness, fascicle angle, and fascicle not be a significant parameter to distinguish upper-
length) was significantly correlated with leg press IPF body muscle strength, RFD, or IPF between stronger
(r: 0.636–0.848) and 1-RM strength in leg press and weaker subjects, although differences in muscle
(r: 0.585–0.761) [11]. According to the results of the fibre type composition and neural factors may con-
present study, triceps brachii muscle architecture may tribute to this finding. Another hypothesis refers to
be a good predictor of upper-body muscle strength in the effects of training experience [27] and long-term
trained individuals. Lastly, IPF was very largely corre- systematic resistance training on muscle architecture
lated with 1-RM strength in bench press in both ab- [12]. Different strength parameters (i.e. sets, repetitions,
127
Human Movement, Vol. 24, No 1, 2023HUMAN MOVEMENT
N. Zaras et al., Rate of force development and triceps muscle architecture
loads, etc.) combined with different training goals among stronger and weaker subjects, which means
(i.e. hypertrophy, maximum strength, etc.) might in- that pectoral and deltoid muscle architecture may con-
duce alternative muscle adaptations, leading to another tribute to upper-body force production.
shaping form of the triceps brachii muscle architec-
ture. Consequently, the initial hypothesis that triceps Acknowledgments
brachii muscle architecture may differentiate between We wish to express our gratitude to the participants
stronger and weaker individuals is rejected. Therefore, of the present study.
it can be hypothesized that upper-body muscle strength
and fast force production may depend more on pectoral Disclosure statement
and deltoid muscle architecture; however, such a prem- No author has any financial interest or received any
ise needs further investigation. financial benefit from this research.
To the best of our knowledge, this is the first study
to examine the correlation between triceps brachii Conflict of interest
muscle architecture and upper-body strength, RFD, The authors state no conflict of interest.
and IPF in trained participants. Thus, the current re-
sults should be interpreted with caution. A limitation References
of the current study is that muscle architecture char-
1. Baker DG, Newton RU. Discriminative analyses of
acteristics were investigated only for the triceps bra- various upper body tests in professional rugby-league
chii muscle and not for the pectoral and deltoid mus- players. Int J Sports Physiol Perform. 2006;1(4):347–
cles, which might have provided a better insight into 360; doi: 10.1123/ijspp.1.4.347.
the nature of the link between upper-body strength 2. Moir GL. Muscular strength. In: Miller T (ed.), NSCA’s
and muscle architecture. Moreover, upper-body RFD guide to tests and assessments. Champaign: Human
and IPF were evaluated at a certain elbow angle (90°). Kinetics; 2012; 147–191.
In addition, this study is one of the few to examine up- 3. Stastny P, Gołaś A, Blazek D, Maszczyk A, Wilk M,
per-body RFD and IPF in a large number of partici- Pietraszewski P, et al. A systematic review of surface
electromyography analyses of the bench press movement
pants. Still, more research is needed to investigate the
task. PLoS One. 2017;12(2):e0171632; doi: 10.1371/
differences in upper-body muscle architecture be- journal.pone.0171632.
tween stronger and weaker trained individuals. 4. Miller S, Bartlett RM. The effects of increased shoot-
ing distance in the basketball jump shot. J Sports Sci.
Conclusions 1993;11(4):285–293; doi: 10.1080/02640419308729998.
5. Terzis G, Georgiadis G, Vassiliadou E, Manta P. Rela-
The results of the current study suggest that triceps tionship between shot put performance and triceps
brachii muscle architecture was correlated with upper- brachii fiber type composition and power production.
body maximum strength in bench press, RFD, and IPF. Eur J Appl Physiol. 2003;90(1–2):10–15; doi: 10.1007/
s00421-003-0847-x.
In addition, stronger participants presented greater
6. Matta T, Simão R, de Salles BF, Spineti J, Oliveira LF.
upper-body relative RFD and IPF compared with their
Strength training’s chronic effects on muscle architec-
weaker counterparts, but triceps brachii muscle ar- ture parameters of different arm sites. J Strength Cond
chitecture might not differentiate between stronger Res. 2011;25(6):1711–1717; doi: 10.1519/JSC.0b013e
and weaker individuals in bench press, RFD, and IPF. 3181dba162.
The triceps brachii muscle plays a major role during 7. Ogasawara R, Thiebaud RS, Loenneke JP, Loftin M,
the elbow extension and the final application of force in Abe T. Time course for arm and chest muscle thickness
various athletic movements, such as basketball and changes following bench press training. Interv Med Appl
shot put. Therefore, strength and conditioning coaches Sci. 2012;4(4):217–220; doi: 10.1556/imas.4.2012.4.7.
should design training programs including the bench 8. Stasinaki A-N, Zaras N, Methenitis S, Tsitkanou S,
Krase A, Kavvoura A, et al. Triceps brachii muscle
press exercise to develop triceps brachii muscle archi-
strength and architectural adaptations with resistance
tecture and upper-body fast force production. More- training exercises at short or long fascicle length. J
over, the very large correlation between 1-RM strength Funct Morphol Kinesiol. 2018;3(2):28; doi: 10.3390/
in bench press and IPF implies that this might be jfmk3020028.
a functional laboratory test to predict maximum 9. Wakahara T, Kanehisa H, Kawakami Y, Fukunaga T,
strength in bench press. However, triceps brachii muscle Yanai T. Relationship between muscle architecture
architecture may not determine 1-RM strength or RFD and joint performance during concentric contractions
128
Human Movement, Vol. 24, No 1, 2023HUMAN MOVEMENT
N. Zaras et al., Rate of force development and triceps muscle architecture
in humans. J Appl Biomech. 2013;29(4):405–412; 21. Comfort P, Pearson SJ. Scaling – which methods best
doi: 10.1123/jab.29.4.405. predict performance? J Strength Cond Res. 2014;28(6):
10. Methenitis S, Spengos K, Zaras N, Stasinaki A-N, Pa- 1565–1572; doi: 10.1519/JSC.0000000000000394.
padimas G, Karampatsos G, et al. Fiber type composi- 22. Mpampoulis T, Methenitis S, Papadopoulos C, Papa
tion and rate of force development in endurance- and dimas G, Spiliopoulou P, Stasinaki A-N, et al. Weak as-
resistance-trained individuals. J Strength Cond Res. sociation between vastus lateralis muscle fiber compo-
2019;33(9):2388–2397; doi: 10.1519/JSC.000000000 sition and fascicle length in young untrained females.
0002150. Sports. 2021;9(5):56; doi: 10.3390/sports9050056.
11. Zaras ND, Stasinaki A-NE, Methenitis SK, Krase AA, 23. Reeves ND, Maganaris CN, Narici MV. Ultrasono-
Karampatsos GP, Georgiadis GV, et al. Rate of force de- graphic assessment of human skeletal muscle size.
velopment, muscle architecture, and performance in Eur J Appl Physiol. 2004;91(1):116–118; doi: 10.1007/
young competitive track and field throwers. J Strength s00421-003-0961-9.
Cond Res. 2016;30(1):81–92; doi: 10.1519/JSC.00000 24. Falvo MJ, Schilling BK, Bloomer RJ, Smith WA,
00000001048. Creasy AC. Efficacy of prior eccentric exercise in attenu-
12. Kavvoura A, Zaras N, Stasinaki A-N, Arnaoutis G, ating impaired exercise performance after muscle in-
Methenitis S, Terzis G. The importance of lean body jury in resistance trained men. J Strength Cond Res.
mass for the rate of force development in taekwondo 2007;21(4):1053–1060; doi: 10.1519/R-21406.1.
athletes and track and field throwers. J Funct Morphol 25. Hartmann H, Bob A, Wirth K, Schmidtbleicher D. Ef-
Kinesiol. 2018;3(3):43; doi: 10.3390/jfmk3030043. fects of different periodization models on rate of force
13. Zaras N, Stasinaki A-N, Spiliopoulou P, Arnaoutis G, development and power ability of the upper extremity.
Hadjicharalambous M, Terzis G. Rate of force devel- J Strength Cond Res. 2009;23(7):1921–1932; doi:
opment, muscle architecture, and performance in elite 10.1519/JSC.0b013e3181b73c69.
weightlifters. Int J Sports Physiol Perform. 2020;16(2): 26. Ioannides C, Apostolidis A, Hadjicharalambous M,
216–223; doi: 10.1123/ijspp.2019-0974. Zaras N. Effect of a 6-week plyometric training on pow-
14. Sale DG. Neural adaptation to strength training. In: er, muscle strength, and rate of force development in
Komi PV (ed.), Strength and power in sport. Oxford: young competitive karate athletes. J Phys Educ Sport.
Blackwell Science; 2003; 281–314. 2020;20(4):1740–1746; doi: 10.7752/jpes.2020.04236.
15. Suchomel TJ, Nimphius S, Stone MH. The importance 27. Maszczyk A, Wilk M, Krzysztofik M, Gepfert M, Zając A,
of muscular strength in athletic performance. Sports Petr M, et al. The effects of resistance training experi-
Med. 2016;46(10):1419–1449; doi: 10.1007/s40279- ence on movement characteristics in the bench press
016-0486-0. exercise. Biol Sport. 2020;37(1):79–83; doi: 10.5114/
16. Maden-Wilkinson TM, Balshaw TG, Massey GJ, Fol- biolsport.2019.83008.
land JP. What makes long-term resistance-trained indi- 28. Hopkins WG. Measures of reliability in sports medi-
viduals so strong? A comparison of skeletal muscle mor- cine and science. Sports Med. 2000;30(1):1–15; doi:
phology, architecture, and joint mechanics. J Appl 10.2165/00007256-200030010-00001.
Physiol. 2020;128(4):1000–1011; doi: 10.1152/jappl- 29. Cohen J. Statistical power analysis for the behavioral
physiol.00224.2019. sciences. New York: Routledge; 1988.
17. Thomas C, Jones PA, Rothwell J, Chiang CY, Comfort P. 30. De Araújo Rocha V Júnior, Gentil P, Oliveira E, do Car-
An investigation into the relationship between maxi- mo J. Comparison among the EMG activity of the pecto-
mum isometric strength and vertical jump performance. ralis major, anterior deltoidis and triceps brachii during
J Strength Cond Res. 2015;29(8):2176–2185; doi: the bench press and peck deck exercises. Rev Bras Med
10.1519/JSC.0000000000000866. Esporte. 2007;13(1):43e–46e; doi: 10.1590/S1517-86
18. Thomas C, Comfort P, Jones AP, Dos’Santos T. Com- 922007000100012.
parison of isometric midthigh-pull strength, vertical
jump, sprint speed, and change-of-direction speed in
academy netball players. Int J Sports Physiol Perform.
2017;12(7):916–921; doi: 10.1123/ijspp.2016-0317.
19. Secomb JL, Nimphius S, Farley OR, Lundgren L,
Tran TT, Sheppard JM. Lower-body muscle structure
and jump performance of stronger and weaker surfing
athletes. Int J Sports Physiol Perform. 2016;11(5):652–
657; doi: 10.1123/ijspp.2015-0481.
20. Ichinose Y, Kanehisa H, Ito M, Kawakami Y, Fukun-
aga T. Morphological and functional differences in the
elbow extensor muscle between highly trained male
and female athletes. Eur J Appl Physiol Occup Physiol.
1998;78(2):109–114; doi: 10.1007/s004210050394.
129
Human Movement, Vol. 24, No 1, 2023You can also read